1. Current Market: Breakout Accelerates, Liquidity Exhausted
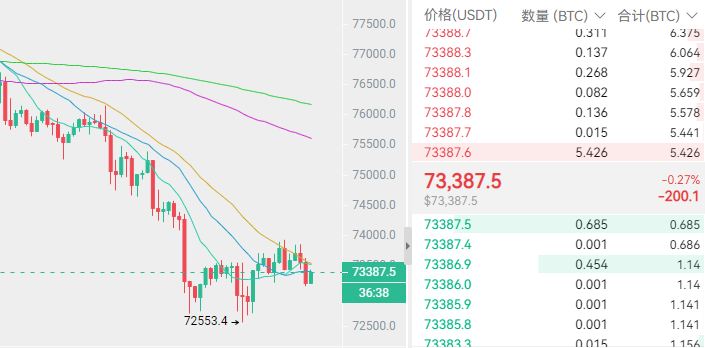
Today is May 29, 2026, Friday. Bitcoin has fallen below $73,000, hitting a low of $72,500, down over 11% from this month's high of $82,000, and a drop of 42% from the historical high of $126,000. Ethereum has lost the psychological level of $2,000.
In the past 24 hours, the entire network has experienced liquidations of $927 million, with long positions accounting for $851 million, and over 170,000 people have been liquidated. Liquidity has dropped to the lowest level since November 2023 — in a low liquidity environment, selling pressure is magnified.
The U.S. stock market is hitting new highs, while cryptocurrencies are falling independently, as funds have shifted from crypto to AI/chips.

2. Core Drivers: Triple Bearish Pressure
1. Macroeconomic: Signs of Stagflation Established, Rate Hike Expectations Rising
The U.S. core PCE for April year-on-year is 3.3%, a new high since November 2023; Q1 GDP has been revised down to 1.6% (expected 2%). Slowing growth + high inflation = classic stagflation. The market is pricing in a 60% probability of a rate hike, leading to zero attractiveness of non-interest-bearing assets in a high interest rate environment.
The month-on-month PCE at 0.2% was below expectations (marginally positive), but the year-on-year 3.3% far exceeds the benchmark — a short-term "bad news out" window exists, but medium-term rate hike pressure has not dissipated.
2. Funds: ETF Accelerating Outflows, Over $3 Billion Lost in Three Weeks
On May 27, BlackRock's IBIT saw a net outflow of $528 million in a single day, the second largest in history. On May 28, the total market ETF experienced a net outflow of $733 million, the largest since February. Grayscale transferred 1,530 BTC to exchanges, suspected for redemption preparation.
Spot ETF fund flow is currently the most crucial leading indicator — will not go long until a turning point is seen.
3. Geopolitical: U.S.-Iran "Rashomon", Market Unable to Price
The U.S. claims that a 60-day memorandum of understanding has been finalized, while Iran denies this, and both sides are engaging in mutual airstrikes. The market cannot price either a "reconciliation/breakdown" scenario, and the uncertainty itself suppresses risk appetite. Oil prices are sensitive to "upcoming agreements," causing plunges every time such news arises.
3. Technical Analysis: 71,000-70,000 is the Last Defense Line
The BTC 4-hour chart has significantly fallen below the lower Bollinger band, which is extremely oversold, but moving averages are diverging bearish, and rebounds are weak.
Support below: 72,500-72,000 (short-term), 70,000 (psychological level), if broken, look for 65,000.
Resistance above: near 74,000, must stabilize to look for 75,000.
Today, $6.25 billion in BTC options will expire on Deribit, the maximum pain point of 75,000 has been breached. After expiration, downward pull may weaken — but this is predicated on no new bearish triggers.
4. Structural Divergence: DeFi Against the Trend, XRP Breaking Down
Only the DeFi sector has seen an increase (+0.35%), HYPE rose 6.79%.
XRP is particularly hard-hit: Ripple moved 60 million XRP during the downturn, with the price falling below the support of 1.30 to 1.27, creating a new low since February.
ETH: Standard Chartered compared it to Amazon in 2001, maintaining a year-end target of 4,000. The logic can be referenced but should not be blindly followed — Amazon first fell 94% before starting a long bull market in 2001.
Chu Yuechen: May 29 Bitcoin ETH Contract Trading Reference
Core Principle: Currently it is a “stagflation + tightening liquidity + fund outflow” triple pressure, while long-term institutional benefits (ARMA Act, Federal Reserve payment accounts) are decoupled from short-term prices. Sentiment indicators are in “extreme fear.”
I have been emphasizing short positions recently, and the short position given at 74,500 yesterday morning was effective almost immediately. Continuing short at 73,500 in the evening has also yielded good returns.
Short-term pressure is near 74,000, so in trading, reference the layout for short positions at 73,500—74,000, with short-term take profit at 72,500, while larger take profit targets the 71,000—70,000 range, and stop loss above 75,000.
Synchronously operate with ETH, price reference for short positions near 2,020, stop loss at 2,070, short-term target at 1,970, larger target looking toward 1,900.
If you want to exchange operations with me, please message me for timely price alerts.

免责声明:本文章仅代表作者个人观点,不代表本平台的立场和观点。本文章仅供信息分享,不构成对任何人的任何投资建议。用户与作者之间的任何争议,与本平台无关。如网页中刊载的文章或图片涉及侵权,请提供相关的权利证明和身份证明发送邮件到support@aicoin.com,本平台相关工作人员将会进行核查。


