Under the rare combination of consumer confidence falling to historical lows, and the complete collapse of the correlation between US stocks and macro assets such as interest rates, oil prices, gold, and the VIX, the S&P 500 continues to hit new highs driven by AI and semiconductors.
Written by: Li Jia
Source: Wall Street View
Currently, the US stock market is showing a rare split: on one side, consumer confidence has dropped to historical lows, and the correlation among macro assets has completely distorted; on the other side, driven by the momentum in AI and semiconductors, major stock indices are constantly setting new historical highs. The real concern for the market is not whether the upward trend can continue, but how long this highly concentrated AI rally can withstand the impacts of oil prices, interest rates, and crowded positions.
Driven by rising expectations for US-Iran negotiations and a surge in the semiconductor sector, US stocks set a new historical high on Tuesday. The Nasdaq 100 index broke through 30,000 points for the first time, and the S&P 500 rose about 0.5%; meanwhile, the retreat in oil prices led to a decline in US Treasury yields, and the rebound in the dollar suppressed the performance of gold and Bitcoin.
Semiconductors remain the core driving force of this market phase. After UBS significantly raised the target price for Micron Technology, trading sentiment for memory chips quickly heated up, with the semiconductor sector accumulating a 14% rise over the past five days. However, Nvidia has begun to underperform the overall semiconductor index, indicating that funds are spreading from the leaders to more elastic trading directions.
Goldman Sachs trader Nelson Armbrust warned that the current correlation between the S&P 500 and interest rates, gold, VIX, and oil prices has deviated from the historical average of the past 20 years and entered an extreme range. "The market always has to yield at one end," he said, "The US stock indices do not reflect the entire reality of the market."
The main line of AI remains unchanged, but the driving forces are rotating
The current strongest driving force in the stock market comes from semiconductors, especially in the area of memory chips. Goldman Sachs trader Pete Callahan pointed out that the semiconductor index outperformed Nvidia by about 16.5 percentage points in the past five trading days, marking the largest five-day advantage of SOX relative to Nvidia since 2018.
It is worth noting that this rally is not led by large tech stocks as a whole. Large tech stocks are performing relatively weakly, with Nvidia slightly lagging, indicating that funds are spreading from the AI leaders to trading directions within semiconductors that show higher elasticity. Memory chip-related targets strengthened significantly at the open, with DRAM ETFs achieving a nominal trading volume of about $3 billion in a single day, and Goldman Sachs' Meme-Stocks basket also saw notable increases.
AI remains the main line of the market. AI semiconductors, Agentic AI, and AI data center sectors are leading the market. Goldman Sachs stated that the strong momentum factors of the day were almost entirely driven by bullish positions, with stocks that performed best over the past 12 months continuing to significantly outperform.
At the same time, the options market has also begun to show increasingly extreme structural signals. SpotGamma data indicates that aggressive negative delta flows have emerged in 0-DTE options, mainly driven by the selling of call options; while the combination of "rising volatility and increasing spot prices" continues. This means that the current rally is not a typical low-volatility risk-on expansion, but is increasingly driven by position squeezes and the structure of options trading.
Consumer confidence hits rock bottom, but behavior and sentiment are split
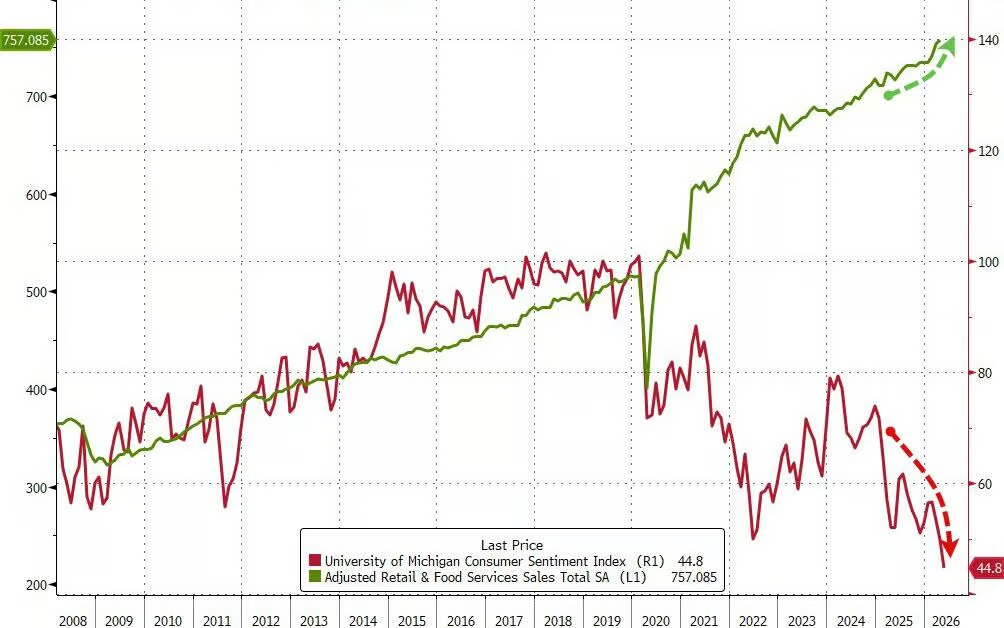
Goldman Sachs trader Chris Hussey pointed out that many are puzzled: why has the consumer confidence index fallen to historical lows, yet US stocks keep setting new historical highs? His explanation is that consumers' "perceived" state and their "actual behavior" are not aligned. In other words, while sentiment is pessimistic, consumer behavior has not deteriorated in sync.
Meanwhile, fiscal stimulus is still supporting household cash flows. Chris Hussey mentioned that the tax cuts in last July’s budget bill are improving household balance sheets and partially offsetting the pressure brought about by rising gasoline prices.
US macro data also shows significant divergence. The Chicago Fed National Activity Index has rebounded sharply, the Conference Board Consumer Confidence Index has exceeded expectations, and the Dallas Fed Manufacturing Index is performing robustly; while the S&P CoreLogic Case-Shiller Home Price Index has weakened, and the Philadelphia Fed Manufacturing Index has fallen short of expectations. Overall, US economic data still maintains a "slightly stronger than expected" status.
This also explains the current market contradiction: consumer sentiment is extremely low, but economic data has not shown a significant downturn, and actual consumer behavior has not declined in sync. However, the AAII bull-bear spread remains negative, indicating that investor sentiment has not truly turned optimistic with the stock index reaching new highs.
Macroeconomic correlation failure, negative gamma intensifies: Goldman Sachs warns of structural fissures in the US stock market
Goldman Sachs trader Nelson Armbrust warns that current US stock indices do not reflect the full reality of the market. The correlation between the S&P 500 and major macro assets has completely deviated from long-term averages: the correlation with interest rates is at a decade low, the correlation with gold has risen to a decade high, the correlation with VIX has reached a two-year high, while the correlation with oil prices has fallen to a decade low.
These levels are extremely rare even within a 20-year historical context. In other words, while US stocks are still on the rise, their traditional interconnections with interest rates, volatility, commodities, and safe-haven assets are failing. For investors who rely on historical correlations for asset allocation, hedging, and risk budgeting, this signifies a decrease in model stability.
At the same time, gamma has turned negative. In a negative gamma environment, the market becomes more sensitive to price fluctuations, and the state of "spot prices rising while volatility rises in sync" also means that the current market trend is not a typical low-volatility one-sided bull market, but is increasingly driven by positions and options structure.
Goldman Sachs' HF Trend Monitor data shows that hedge funds' current allocation to momentum factors has risen to the 90th percentile, with semiconductor positions reaching a record 10%, while software positions have dropped to the lowest level since 2019. The high degree of crowding in positions means that the market may continue to rise in the short term under the support of chasing funds, but any slight disappointment could be rapidly amplified if a reversal trade occurs.
How far can US stocks go? It depends on three constraints
The first constraint comes from oil prices. Diplomatic progress can quickly lower geopolitical risk premiums, but cannot immediately repair the buffering capacity of shipping, insurance, refining, and actual supply chains. As long as there are still uncertainties regarding the situation in the Strait of Hormuz and the prospects for a US-Iran ceasefire, oil prices may repeatedly fluctuate between optimistic expectations and tail risks.
The second constraint comes from semiconductor positions. The current rise in US stocks increasingly relies on AI and semiconductors, especially memory chips and momentum bullish trading. If funds continue to chase this direction, indices may maintain strength; but as positions become more crowded, the market's sensitivity to performance, guidance, or changes in fund flow will increase, and any slight disappointment could be quickly magnified.
The third constraint comes from the failure of correlations. The relationships between the S&P 500 and interest rates, gold, VIX, and oil prices have simultaneously deviated from long-term averages, meaning the current rise does not equate to a comprehensive easing of macro risks. More accurately, it is the result of a combination of falling geopolitical risk premiums, declining US Treasury yields, AI semiconductor momentum, and position squeezes.
Therefore, the "sole revelry" of the US stock market may continue, but the stability of the market is decreasing. The truly critical point is not whether the index can hit new highs, but which variables will force this trading logic to be repriced—will oil prices rise again, will interest rates rise again, will semiconductor momentum cool down, and when will those distorted correlations recover?
免责声明:本文章仅代表作者个人观点,不代表本平台的立场和观点。本文章仅供信息分享,不构成对任何人的任何投资建议。用户与作者之间的任何争议,与本平台无关。如网页中刊载的文章或图片涉及侵权,请提供相关的权利证明和身份证明发送邮件到support@aicoin.com,本平台相关工作人员将会进行核查。


