Cryptocurrency Academician: Bitcoin's pressure support switches back and forth on May 28! The moving average system is comprehensively weakening, and the southward advantage is gradually expanding! Latest market analysis and trading advice
Bitcoin's current price is 74900, the big coin is testing the bottom again. This time, will it lose the key support? Results will be known soon. The southward adjustments have eaten through several waves; just follow the trend. As long as the market trend does not change, encountering resistance during a pullback is an opportunity to go south. If you don't understand, just sit quietly and watch the show. If no signals emerge, absolutely do not act. The essence of trading is survival, and only secondarily profit. Be a bit more zen, patiently wait for it to choose a direction; otherwise, you won't make money and might lose your hair instead!
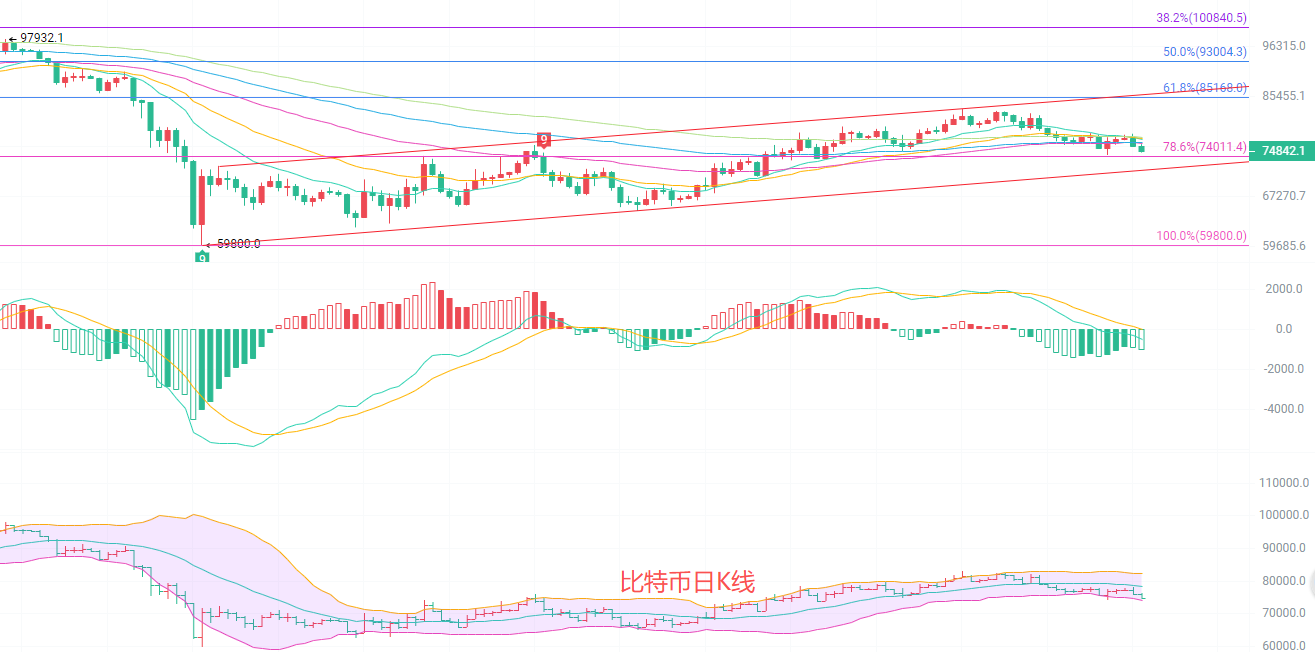
The daily candlestick chart shows a decline of 1.30% within the day. The current price is below multiple EMA moving averages, with the short-term moving average group turning downwards, while the long-term moving averages still show a slight upward trend. This indicates that the medium-term trend has not completely deteriorated, but short-term selling pressure is clearly increasing. The MACD indicator shows that DIF has crossed below DEA, and the green bars continue to expand, indicating that southward momentum is being released; the middle Bollinger Band has strong resistance at 78315, while the lower band at 74183 provides short-term support. The price is in a weak zone between the middle and lower bands, with a high probability of continuing a southward oscillatory trend in the short term.
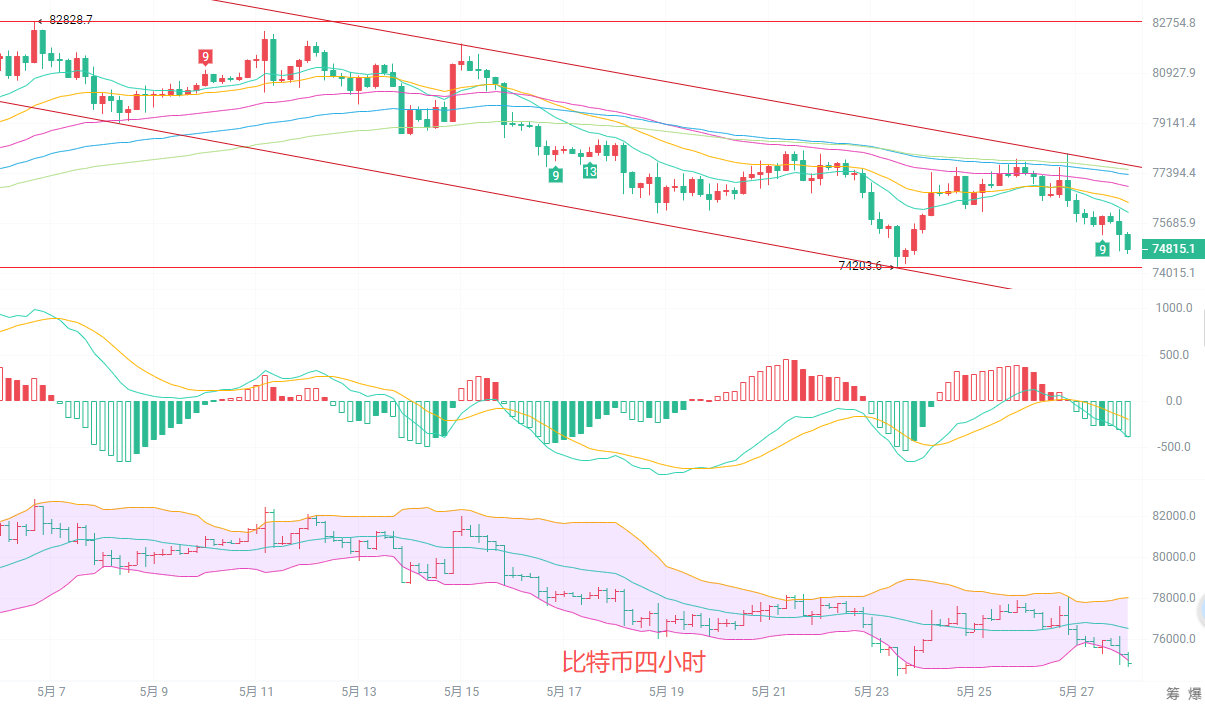
The four-hour candlestick chart shows that recent highs are gradually decreasing, and lows are also moving lower, forming a clear descending channel. After the price broke below the EMA15 and EMA30 moving averages, the rebound has consistently failed to rise above the moving average resistance, indicating that the upward counterattack is very weak. The MACD indicator's DIF continues to operate below the zero axis. Although the green bars have shortened, there has not been a clear golden cross signal, and southward momentum has not completely exhausted; the Bollinger Bands open downward, with the price running close to the lower band. Support near the lower band at 75020 has been repeatedly tested, and if broken, it will open up new downward space. Any short-term rebound can only be seen as weak recovery.
Short-term trading thoughts: Follow the major cycle trend, with small stop losses and quick entry and exit.
Going north from 74300 to 73800, with a stop loss at 73500, targeting 76000 to 77300.
Going south from 76000 to 76500, with a stop loss at 77000, targeting 74500 to 74000.
Specific operations should be based on real-time market data. For more information, you can consult the author. Articles may be published with delays; the suggestions are for reference only, and risks are to be borne by individuals.

Friendly reminder: The above content is only created by the author on Weibo. Advertisements at the end of the article and in the comments are unrelated to the author, so please be cautious in discernment. Thank you for reading.
免责声明:本文章仅代表作者个人观点,不代表本平台的立场和观点。本文章仅供信息分享,不构成对任何人的任何投资建议。用户与作者之间的任何争议,与本平台无关。如网页中刊载的文章或图片涉及侵权,请提供相关的权利证明和身份证明发送邮件到support@aicoin.com,本平台相关工作人员将会进行核查。