Cryptocurrency Expert: 5.22 Dual-Line Cycle Resonance Game, Exactly Locking in the Best Entry Zones for Ethereum Long and Short Positions? Latest Market Analysis and Operational Suggestions
Ethereum's current price is 2138. In the past few days, at least a dozen friends have asked me whether to bottom-fish Ethereum. My response is simple: during this phase of consolidation and bottoming, nine out of ten bottom-fishers end up stuck halfway. At the 2140 level, it can't go up or down. What you think is an opportunity is actually a trap; you chase when it rises a bit and panic when it drops a little, ultimately getting stopped out in both directions. Stop thinking about buying at the lowest point and selling at the highest point. What the cryptocurrency market lacks the least is this kind of daydream. Before breaking through key resistance levels, all retracements provide opportunities for short positions, and all declines provide opportunities for lightly positioned long trials, but the premise is that you carry a stop-loss. For those heavily leveraged, holding on without a stop-loss, I advise you to uninstall your trading software immediately and stop being a casualty in the market.
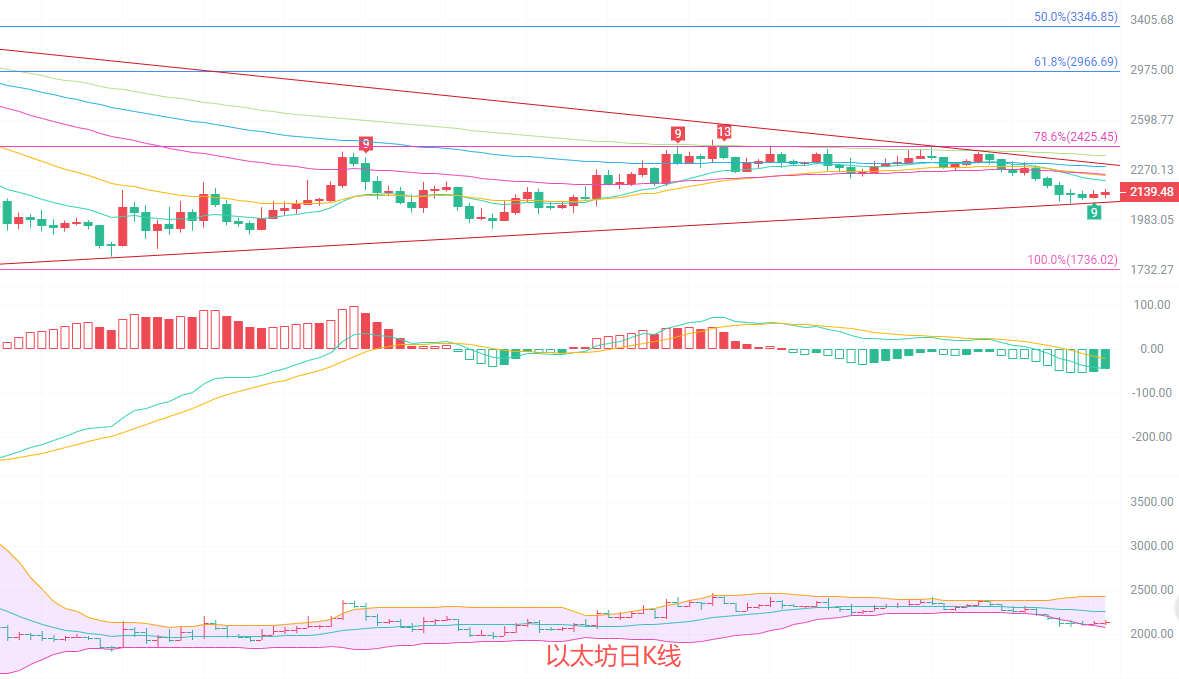
The daily candlestick chart has just dipped below the EMA15 line at 2206, the EMA30 line at 2237, and several other short-term moving averages, currently positioned below the cluster of moving averages, with noticeable short-term downward pressure. The MACD indicator shows the DIF and DEA, with green bars continuing to widen, and the southbound momentum is still being released. In terms of the Bollinger Bands, after the price touched the lower band around 2083, it rebounded slightly but remains below the middle band at 2258, with the middle band continuing to trend downward, indicating a weak trend. There is currently no clear sign of a stop in the daily timeframe, and caution should be taken against the risk of a second downward probe.
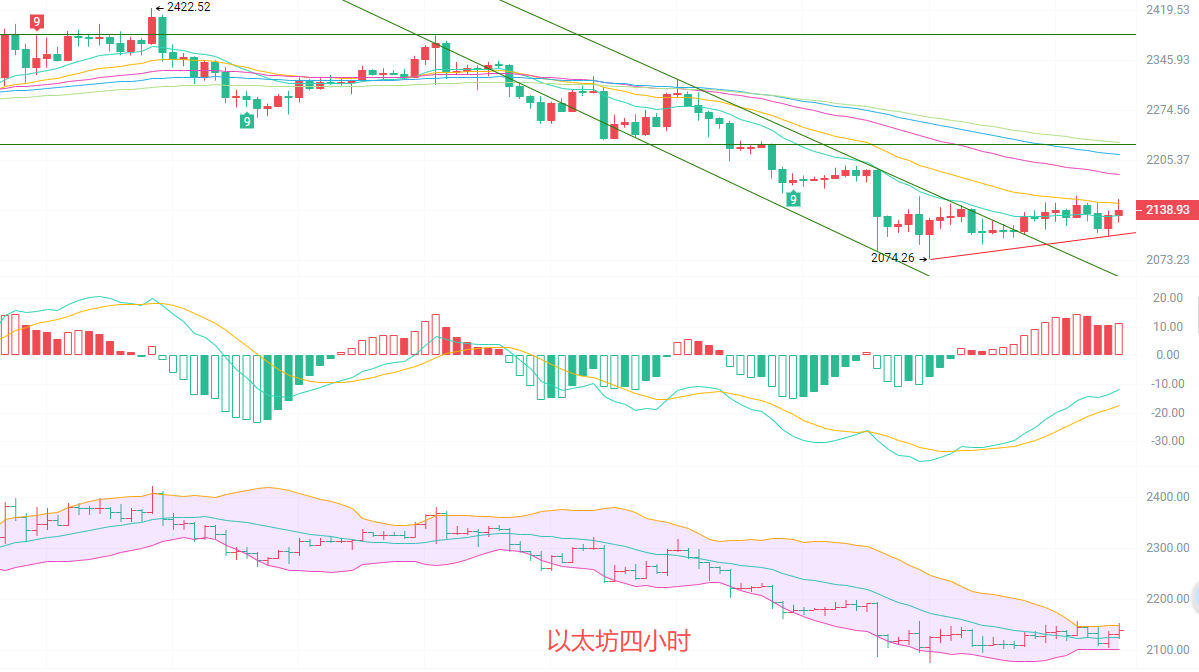
The four-hour candlestick chart is currently fluctuating narrowly near 2140, operating around the EMA15 line at approximately 2132. The short-term moving averages are flattening out, and the long and short positions are in a stalemate. The MACD indicator shows that the DIF has crossed above the DEA to form a golden cross, with red bars continuing to expand, indicating that the northward momentum has somewhat recovered in the short term. The Bollinger Bands are continuing to narrow, with the price hovering around the middle band at 2125, the lower band at 2101 providing support, and the upper band at 2149 forming resistance. The four-hour timeframe indicates signs of stabilizing after falling, but the momentum of the rebound is relatively weak, and it has not yet broken through the descending trend line.
Short-term reference:
If it moves north from 2120 to 2100, stop-loss at 2060, target at 2180 to 2200
If it moves south from 2180 to 2200, stop-loss at 2230, target at 2130 to 2100
Specific operations should be based on real-time market data; for more information, you can consult the writer. The release of this article may be delayed, and suggestions are for reference only; risks are self-borne.

Warm Reminder: The above content is solely created by the author for Weibo. The advertisements at the end of the article and in the comments section are unrelated to the author. Please discern carefully, and thank you for reading.
免责声明:本文章仅代表作者个人观点,不代表本平台的立场和观点。本文章仅供信息分享,不构成对任何人的任何投资建议。用户与作者之间的任何争议,与本平台无关。如网页中刊载的文章或图片涉及侵权,请提供相关的权利证明和身份证明发送邮件到support@aicoin.com,本平台相关工作人员将会进行核查。