Dear friends, I am Sister Qinglan. This morning, the market was ignited by two major pieces of news: First, the negotiation of a ceasefire intention between the United States and Iran boosted the rise of Bitcoin and altcoins, with all three major U.S. stock indices also rising. The easing of geopolitical tensions directly lifted risk assets; Second, SpaceX holds 18,712 BTC, rising to become the seventh largest Bitcoin holding company, and the increased holdings by large institutions further strengthens Bitcoin's value support. The combination of these two positive factors allowed Bitcoin to stabilize at $77,000 in today's early session and attempt to surge towards $78,000. However, at the same time, CryptoQuant warned that Bitcoin might repeat the bearish trend from March 2022; the fear index remains at 29, indicating that market sentiment has not fully warmed up. Today, we will use the Qinglan TPV system to analyze the current pattern of long and short positions.
Current Price and Time
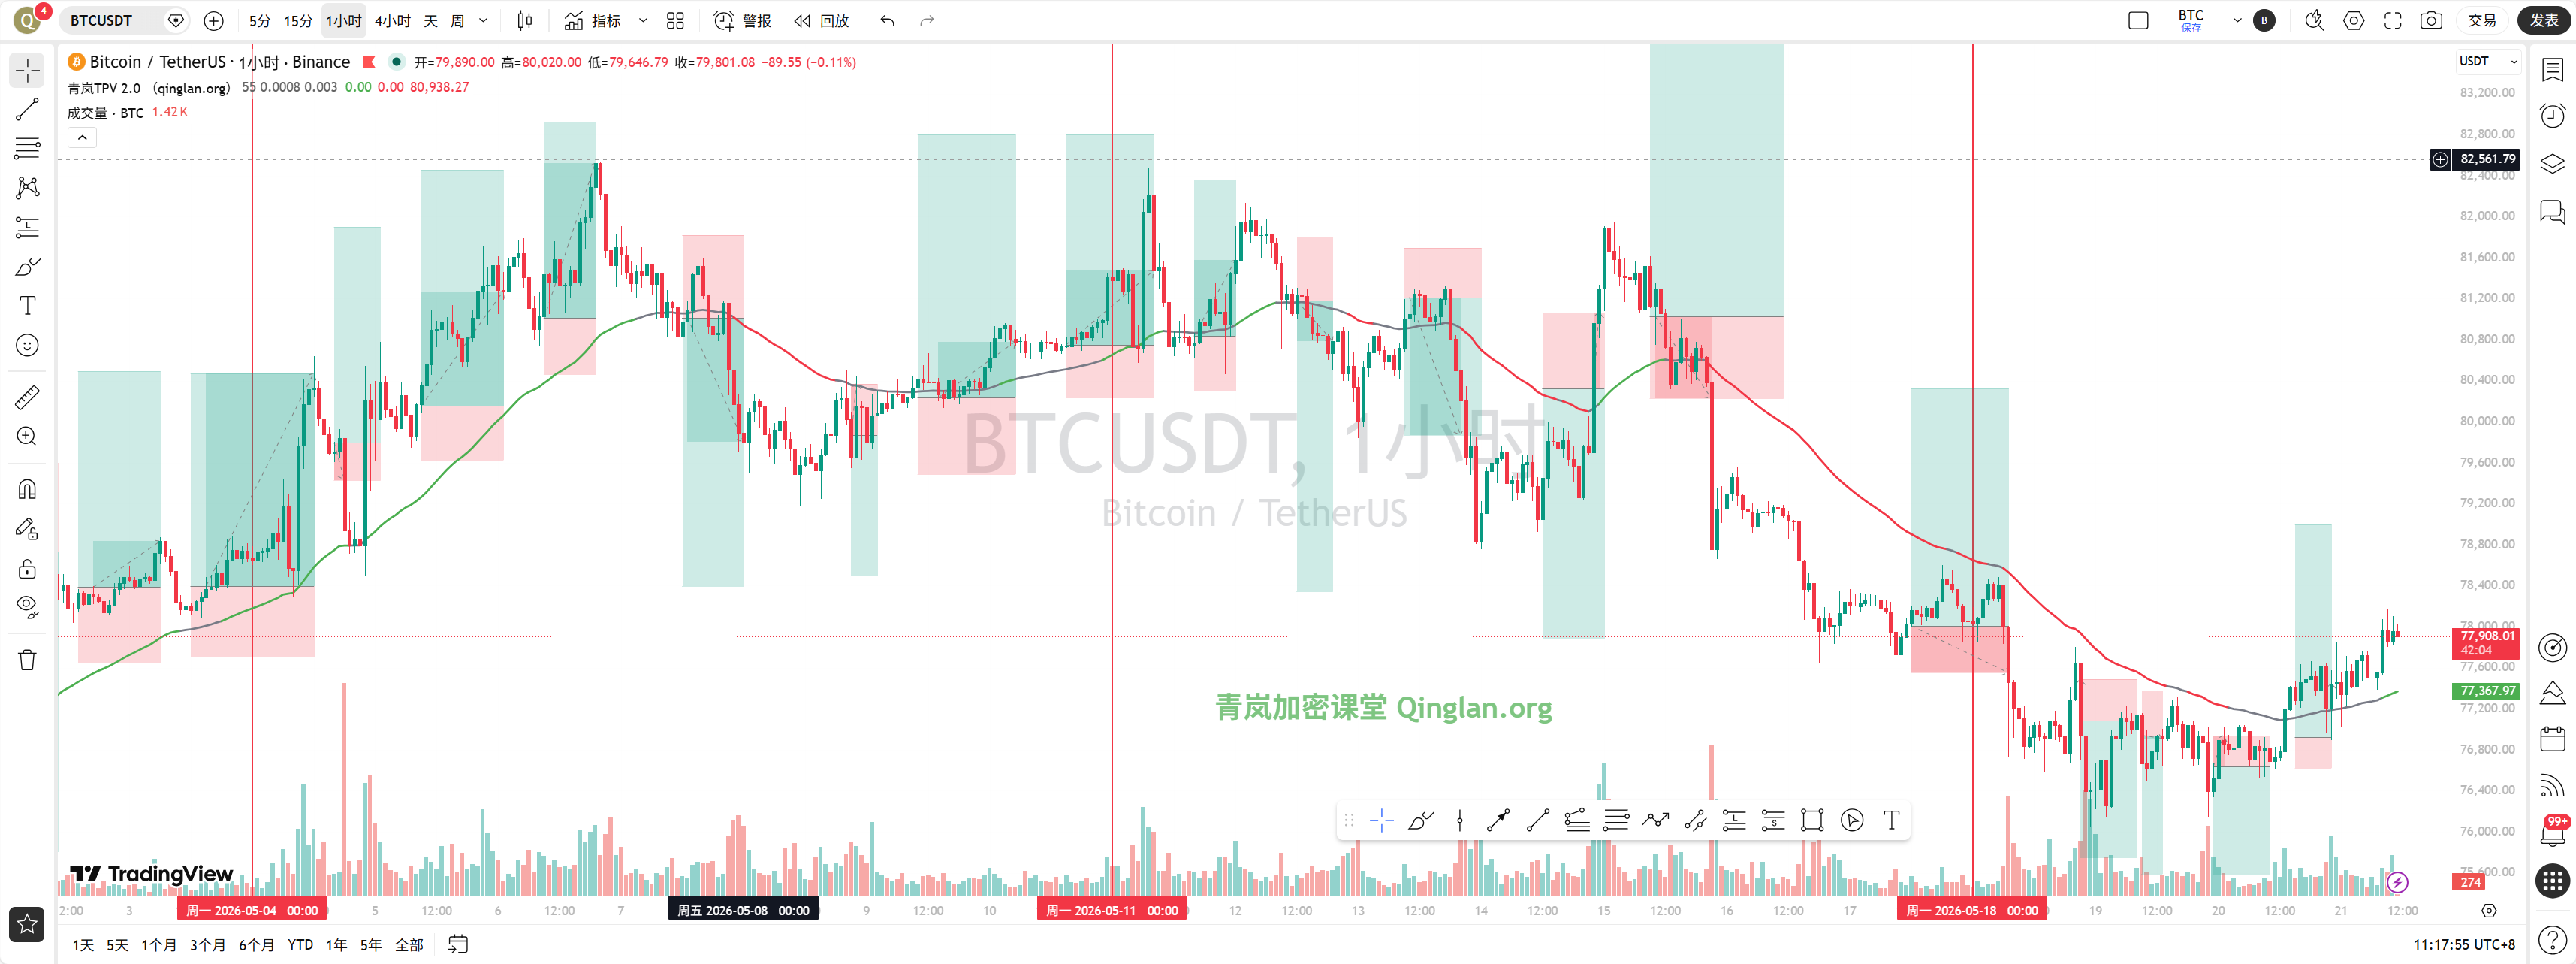
The current time is May 21 at 11:19, and the price of Bitcoin is 77,933 USDT. The 24-hour price increase is 1.62%, and the market share is 58.24%, showing Bitcoin's relative strength among mainstream coins. However, the funding rate has turned bearish, with a divergence between price and funding rates, indicating uncertainty in the short-term direction, and caution is needed.
Multi-Period Status Overview
First, let’s look at the daily chart. On the daily chart, MA5=77,355.83, MA10=78,494.85, MA30=78,782.60, with the price above MA5 but below MA10 and MA30. The short-term moving averages have not yet formed a bullish pattern. In terms of MACD, DIF=235.15, DEA=817.41, and the histogram value is -582.26. The bearish momentum histogram is still shrinking, but DIF and DEA remain below the zero axis in a dead cross state. RSI=41.53 is in a neutral to weak area. Overall, the daily chart presents a pattern of oscillation after a decline, and a reversal has not been confirmed.
At the 4-hour level, MA5=77,598.14, MA10=77,217.12, MA30=77,472.58, with the price above all short-term moving averages, showing a stronger short-term trend. The MACD's DIF=-233.88, DEA=-448.16, and the histogram value is 214.29, with the bullish momentum histogram continuously enlarging. DIF has crossed above the zero axis, which is a positive signal for the 4-hour level. RSI=65.17 is in a neutral to strong area and has not entered the overbought zone.
At the 1-hour level, MA5=77,854.40, MA10=77,707.93, MA30=77,359.93, with the price moving upwards along MA5, and the moving averages are in a bullish arrangement. The MACD's DIF=206.24, DEA=174.87, and the histogram value is 31.36, with the bullish momentum histogram still enlarging, but the histogram value has decreased compared to the previous one, indicating potential short-term momentum decay. RSI=68.57 is close to the 70 overbought line but has not yet reached it.
At the 15-minute level, MA5=77,983.55, MA10=77,955.68, MA30=77,720.88, with the price oscillating narrowly around MA5. The MACD's DIF=113.38, DEA=104.51, and the histogram value is 8.87; the bullish momentum histogram continues to shorten with signs of forming a dead cross. RSI=66.36 is in a neutral to strong area.
TPV Signal Verification
Now, we will use the Qinglan TPV system to verify the signals. First, the current value of the 1-hour EMA55 is 77,350.64, and the current price is 77,933 USDT, which is above EMA55. Additionally, the closing prices of the past 8 one-hour candles are all greater than EMA55, with a crossing frequency of 0, and the price is 0.75% above EMA55, which does not meet the oscillation threshold. The system identifies this as a bullish trend area.
Long Entry Conditions Check: First, the price has stabilized above the 1-hour EMA55 with the last two one-hour candle closing prices greater than EMA55, so the first condition is met. Second, support has stabilized as the current price has formed an effective low rebound in the 77,500-77,600 area, and the bullish momentum histogram on the 4-hour MACD continues to enlarge, providing support. Third, the downward momentum is exhausted; though the 1-hour MACD histogram is shortening, both DIF and DEA remain above the zero axis, and RSI has risen from below 30 to 68. The momentum exhaustion signal is not clear, but overall, it leans bullish. Considering these points, the system provides a bullish signal, but caution is needed regarding the potential risks of the shortening 1-hour MACD histogram.
In terms of handling oscillating markets, among the past 8 one-hour candles, the closing prices greater than EMA55 tally 8/8, with 0 crossings. The price is 0.75% above EMA55, which does not meet oscillation conditions; thus, the system does not classify it as oscillation but rather as a one-sided bullish trend.
On-chain/Funding Situation
Regarding on-chain data, the fear and greed index is at 29, still in the fear range, indicating that market sentiment has not significantly warmed up due to the price increase. As for the funding rates, mainstream CEX/DEX funding rates have turned bearish, and the divergence between price and funding rates typically suggests that a short-term rise may lack sustainability, necessitating caution for a pullback. Bitcoin's market share is 58.24%, indicating that funds are still concentrating on Bitcoin, while altcoins are relatively pressured.
Key Offensive and Defensive Levels
The key resistance level above is in the 78,000-78,200 area, which is the previous high at the 4-hour level and also a concentrated trading area at the 15-minute level. If this area is broken, the next target would be 78,500-79,000, which corresponds to the resistance area of the daily MA10 and MA30. The key support level below is in the 77,350-77,500 area, which coincides with the resonance area of the 1-hour EMA55 and 4-hour MA5. If this area is broken, the bullish trend may turn into oscillation, with the next support expected at the 77,000 whole number mark.
Trading Thoughts
Based on the bullish signal from the Qinglan TPV system, today's trading strategy focuses on buying on dips, but position control must be strict due to the divergence in funding rates and shortening MACD histogram indicating short-term risks.
Direction: Go Long.
Entry Conditions: Wait for the price to pull back to the 77,500-77,600 area, while also observing for a bottom formation or long lower shadow stabilization signal on the 15-minute level, and the MACD histogram begins to shorten or RSI rises from below 30. If the price directly breaks above 78,000 and stabilizes, light positions can be taken, but a stop-loss must be set.
Stop-Loss Level: Set below 77,300, specifically below the 1-hour EMA55. If the price breaks below EMA55 and the closing prices of two consecutive one-hour candles fall below EMA55, the bullish signal will be invalidated, requiring exit and wait-and-see attitude.
Target Levels: First target 78,200, second target 78,500, third target 79,000. If the price reaches around 78,500, consider reducing positions or setting a breakeven stop-loss.
Risk Warning
The bearish turn in funding rates and divergence from prices carry short-term risks in pursuing more, and avoid heavy positions.
Follow Qinglan Crypto Class to grasp more trading opportunities! Welcome to visit the official website www.qinglan.org
📊 Qinglan TPV Trading Strategy Backtest Reference
🕒 Last backtest time 05-21 07:00:01
Total analysis: 1674 Backtests: 1584 Accuracy: 66.6% (1055/1584)
免责声明:本文章仅代表作者个人观点,不代表本平台的立场和观点。本文章仅供信息分享,不构成对任何人的任何投资建议。用户与作者之间的任何争议,与本平台无关。如网页中刊载的文章或图片涉及侵权,请提供相关的权利证明和身份证明发送邮件到support@aicoin.com,本平台相关工作人员将会进行核查。