Good morning, friends, I am Sister Qinglan. Early this morning, the market was jolted awake by two significant pieces of news. First, the Federal Reserve's hawkish signal resurfaced, with officials suggesting that inflation has not declined and interest rates will not be raised for now and could even be raised further, delivering a blow to all risk assets. Second, U.S. Senator Warren criticized the OCC, indicating that nine major cryptocurrency trust licenses face a risk of revocation, and regulatory headwinds directly shake the foundation of cryptocurrency compliance in the U.S. The combination of these two negative factors directly suppressed the rebound momentum of BTC, and market sentiment is extremely fragile. Today, we'll analyze the data to determine the current position of BTC and where the trading opportunities lie.
Current Price and Time
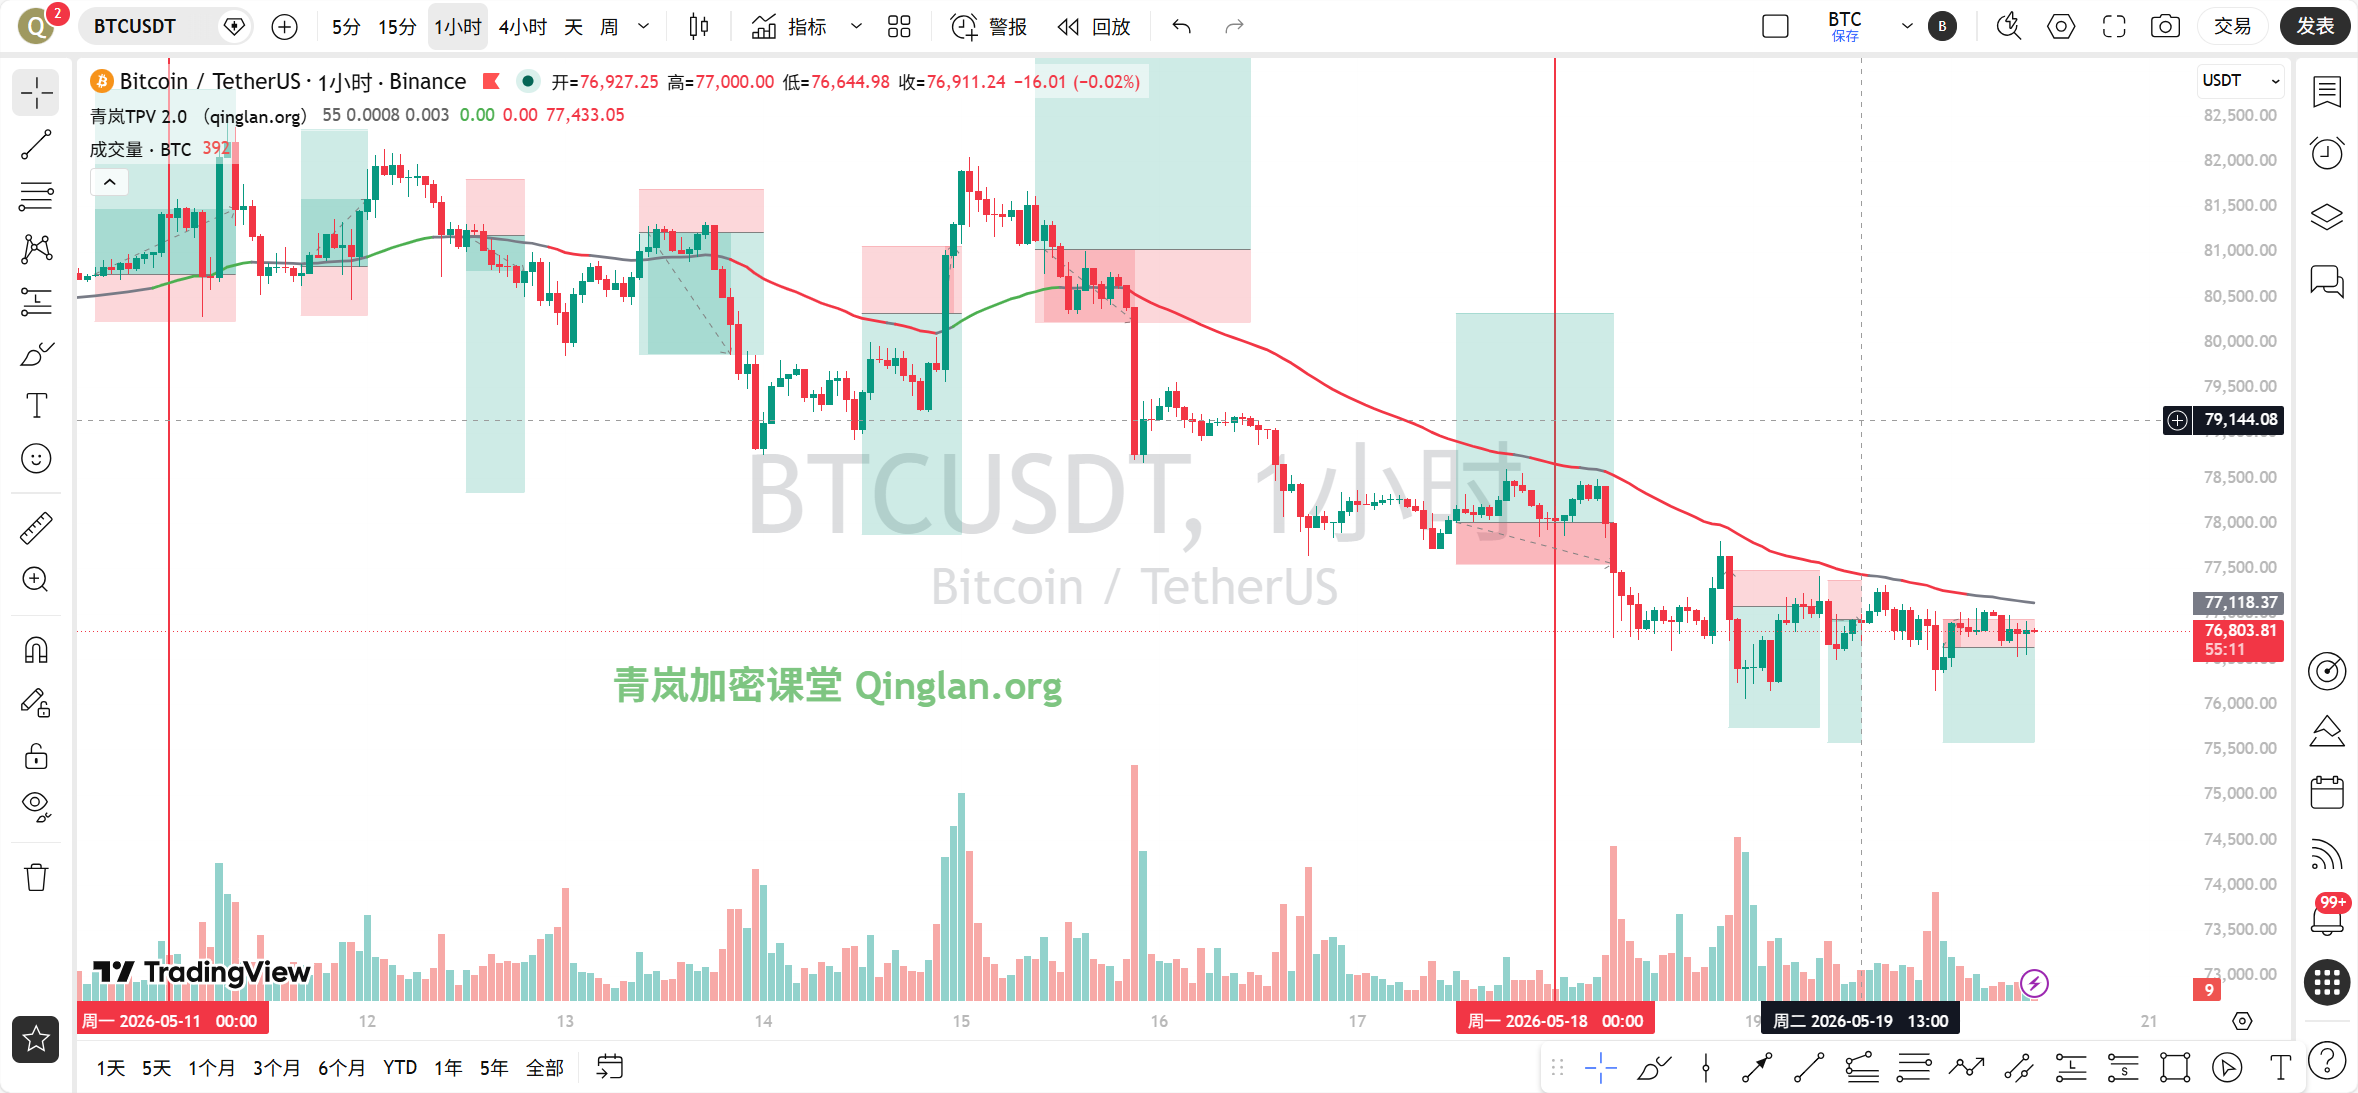
The current time is May 20, 10:33 AM, with the latest BTC price quoted at 76,689 USDT, a 24-hour drop of 0.22%. The Fear and Greed Index has fallen to 25, indicating an extreme fear zone, and retail sentiment is nearing a freezing point.
Multi-Cycle Status Overview
First, let's look at the daily chart. The daily MA5 is at 77,226, MA10 at 78,789, and MA30 at 78,700; the moving average system has formed a bearish arrangement, with the price operating below MA5. The MACD histogram shows negative values, with the DIF at 233, and the DEA at 947, indicating a sustained death cross state, and bearish momentum continues to release. The RSI has dropped to 31.30, nearing the oversold area, but has not yet formed an effective rebound signal.
The 4-hour level is clearer. MA5 is at 76,715, MA10 at 76,793, and MA30 at 77,893, with the price continuously under pressure below the moving averages. Although MACD's histogram has turned positive, the DIF is negative at 648, and the DEA is negative at 702, indicating a bottom divergence in the downtrend that needs further confirmation. The RSI is at 33.25, also in a weak zone.
The 1-hour level is the focus of today’s analysis. MA5 is at 76,769, MA10 at 76,832, and MA30 at 76,869, with the moving average system flattening. The price oscillates narrowly around the moving averages. The MACD's DIF is negative at 48, and DEA is negative at 52, the histogram has turned positive but the value is minimal, indicating that the bulls and bears are nearly balanced. The RSI is at 43.72, neutral but slightly weak. The most critical point is the EMA55, currently at 77,059; the price of 76,689 is obviously below EMA55, and in the past 8 1-hour candles, the closing price has been greater than EMA55 zero times, and there have been zero crosses, indicating a very clear bearish trend with no oscillation signals.
The 15-minute level is a window for short-term games. MA5 is at 76,738, MA10 at 76,734, and MA30 at 76,822, with the moving average system diverging downward. The MACD indicates a death cross, with DIF at negative 29, DEA at negative 26, and a negative histogram, showing a short-term bearish advantage. The RSI is at 45.63, neutral.
In summary, the daily and 4-hour bearish trends dominate, while the 1-hour and 15-minute levels are in weak oscillation, with the overall pattern leaning bearish.
TPV Signal Validation
Now let’s use the Qinglan TPV system to validate the signals. The system uses the 1-hour EMA55 as the boundary between bullish and bearish, with the current price of 76,689 far below EMA55 at 77,059, and the closing price of the last two 1-hour candles below EMA55 meets the first condition for shorting: price is under pressure below 1-hour EMA55.
The second step is pressure meeting resistance. Observing the 1-hour candlestick chart, the price has repeatedly shown long upper shadows in the 76,800-76,900 range, indicating significant selling pressure in this area. Meanwhile, although the MACD histogram at the 4-hour level has turned positive, the DIF and DEA are still negative, indicating very weak rebound strength, which is typical of a bearish continuation pattern.
The third step is weak rebound. Although the 1-hour MACD histogram has turned positive, the value is only 3.34, and it has not significantly increased over the last two periods, indicating insufficient bullish rebound momentum. The RSI at 43.72 has weakened again after a rebound from the oversold area, failing to form an effective breakout. In summary judgment, the current conditions are suitable for shorting, and the bearish trend continues.
On-chain Fund Situation
In terms of on-chain data, the Fear and Greed Index is at 25, indicating extreme fear, which historically corresponds to staging bottom areas, but may continue to drop in the short term. BTC's market share is 58.26%, indicating that funds are still seeking refuge in BTC, while altcoin liquidity worsens. Notably, the U.S. government has transferred FTX's seized assets to Coinbase; although neutral, potential selling pressure needs to be watched. The risks of stablecoin reserves have also been warned by asset management giants, with Tether and USDC being likened to high-risk hedge funds, which may lead to a liquidity crisis under extreme market conditions.
Key Defensive Levels
The first resistance level above is the 1-hour EMA55 at 77,059, which serves as the boundary between bullish and bearish; it must break through and hold above to turn bullish. The second resistance level is at 4-hour MA30 at 77,893, the defensive line of the medium-term bearish trend. The first support level below is the recent low around 76,000 from 4 hours ago, which is the last defensive line for bulls. If it breaks below 76,000, the next support is at the 75,000 round number, which is a psychological support at the daily level.
Trading Thoughts
Based on the above analysis, Sister Qinglan presents today's trading thoughts.
Direction: Mainly short, but need to wait for a rebound confirmation.
Entry Conditions: Wait for the price to rebound to the 76,900-77,050 range, appearing with a long upper shadow on the 1-hour candlestick or a topping pattern, and with the MACD histogram shortening again, and the RSI falling back from around 43 for short entry. If the price directly breaks below 76,000, one may chase shorts, but position size needs to be controlled.
Stop Loss: Strictly set above 77,200, that is, if it breaks and holds above the 1-hour EMA55, it indicates that the bearish logic has failed.
Target Levels: First target at 76,000, second target at 75,000. If market sentiment worsens, it may accelerate the drop to 74,000.
If the price unexpectedly breaks through 77,200 and holds, then the bearish logic is invalidated, and one should observe or turn bullish, but currently, the probability is low.
Risk Warning
The current market is in a state of extreme fear with dense bad news, and volatility may increase; please strictly control position sizes, set proper stop losses, and avoid holding losses.
Follow Qinglan's Crypto Classroom to capture more trading opportunities! Welcome to visit the official website www.qinglan.org
📊 Qinglan TPV Trading Strategy Backtest Reference
🕒 Last Backtest Time 05-20 07:00:02
Total Analysis: 1650 Backtests: 1582 Accuracy Rate: 66.6% (1053/1582)
免责声明:本文章仅代表作者个人观点,不代表本平台的立场和观点。本文章仅供信息分享,不构成对任何人的任何投资建议。用户与作者之间的任何争议,与本平台无关。如网页中刊载的文章或图片涉及侵权,请提供相关的权利证明和身份证明发送邮件到support@aicoin.com,本平台相关工作人员将会进行核查。