Cryptocurrency Scholar: On May 20, Ethereum fell into a weak oscillating pattern, momentum continues to weaken, and the opportunity for a bottom has not yet matured! Latest market analysis and operation suggestions
Ethereum's current price is 2120, and Ethereum's trend is currently a weak market led by a bearish sentiment. Do not listen to the noise shouting to buy the dip; the real bottom is not called out; it is waited for. Short-term trading is like walking on a tightrope; only take steps with good stop-loss measures; do not take on too heavy a position, admit mistakes, and do not stubbornly hold on. The biggest loss in trading is not being wrong in direction, but going against the market with emotions. Steady your pace; staying alive gives you a chance to turn things around.
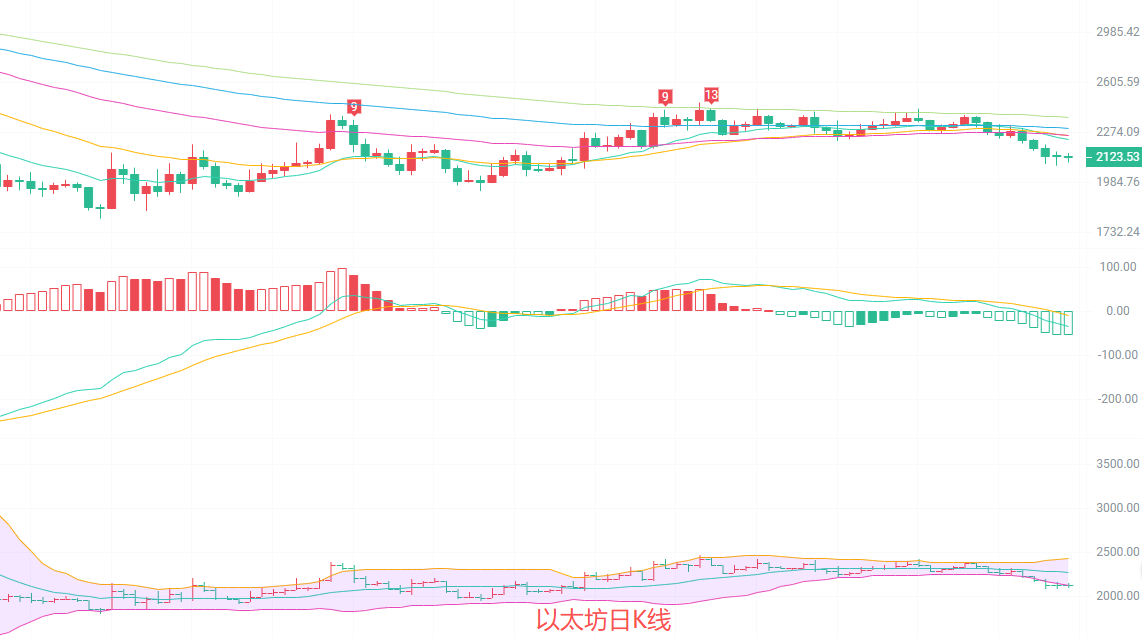
The daily candlestick chart is in a clear downward trend. The price has broken below short-term moving averages like EMA15 and EMA30, and all moving averages are arranged downward, with heavy pressure above. The MACD indicator shows that both DIF and DEA are below the zero axis, and the green bars continue to expand, indicating that the downward momentum is still being released. The middle track of the Bollinger Bands at 2273 is clearly restrictive, and the price has fallen below the lower track. Although it is oversold in the short term, there are no clear signals of a reversal; the overall weak pattern is hard to change.
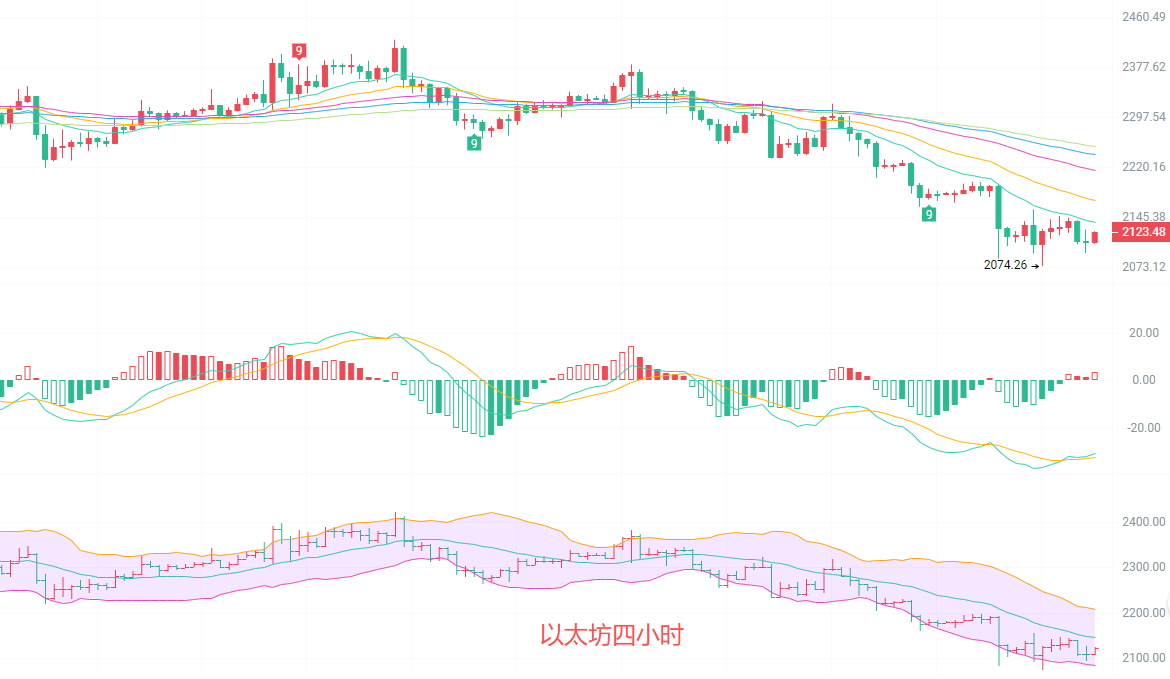
The four-hour candlestick chart has continued to weaken recently. Currently at 2120, the moving average system is in a typical downward arrangement, with short-term moving averages like EMA15 and EMA30 exerting pressure on the price. In the MACD indicator, although DIF shows signs of curving up, it is still below the zero axis, and just started to show weak red bars, indicating that the downward momentum has weakened but has not reversed. The lower track of the Bollinger Bands around 2084 provides support, while the upper track at 2209 presents short-term pressure. The current price is oscillating near the lower track of the Bollinger Bands, with a short-term weak rebound demand for correction, but the height of the rebound may be limited.
Short-term reference:
On the upside, from 2180 to 2200, sell down with a stop loss at 2230, target at 2080 to 2050
On the downside, from 2070 to 2090, buy up with a stop loss at 2040, target at 2120 to 2170
The current overall trend is slightly bearish; long positions should only be treated as short-term rebounds. It is essential to strictly control positions, implement stop-loss measures, and avoid heavy operations against the trend.

Warm reminder: The above content is created solely by the author on Weibo; you can scan the code to follow and stay connected. For the public account on WeChat, just search: Cryptocurrency Scholar. The advertisements at the end of the article and in the comment section are unrelated to the author, so please be cautious in distinguishing them. Thank you for reading.
免责声明:本文章仅代表作者个人观点,不代表本平台的立场和观点。本文章仅供信息分享,不构成对任何人的任何投资建议。用户与作者之间的任何争议,与本平台无关。如网页中刊载的文章或图片涉及侵权,请提供相关的权利证明和身份证明发送邮件到support@aicoin.com,本平台相关工作人员将会进行核查。