Summary
• Last week, the market shifted from "war risk aversion" to "soft landing + interest rate cut expectations" trading. The cease-fire proposal in the Middle East released positive signals, while AI and technology company earnings pushed the Nasdaq index to a weekly increase of 4.70%; BTC broke through $82,000 driven by continued inflows into ETFs.
• BTC ETF had a weekly net inflow of $632 million, with IBIT continuing to dominate institutional funds; the ETH ETF turned positive from negative, with ETHA becoming the main source of incremental funds, and institutional allocation sentiment clearly improved.
• TradFi on-chain trading was dominated by macro assets like gold and oil, with stocks and ETF-related trading ratios continuing to recover; the number of assets in CEX TradFi continued to expand, with stock types showing the most significant growth.
• On-chain funds refocused on leading DEXs and mature liquidity scenes, with Uniswap and PancakeSwap as core platforms; the stablecoin market favored compliant, settlement, and cross-chain capable dollar assets.
• Aave continues to digest the impact of the rsETH event, with the lending market remaining weak; new scenes like MegaETH and Plasma are starting to attract incremental funds, with Solana LST benefiting first from a warming risk appetite.
• The derivatives market continued a structure of "negative funding rates + high position fluctuations," with BTC short-squeezing phases occasionally releasing; options trading volume and implied volatility vastly increased during breakout phases, then subsequently cooled down.
• In May, Gate institutional spot volume increased by 14.54%, with contracts rising by 18.10%; CrossEx traded volume and asset scale reached new highs for three consecutive weeks; the Gate Institutional Circle Amsterdam station has entered the preparation stage.
1. Market Focus Interpretation
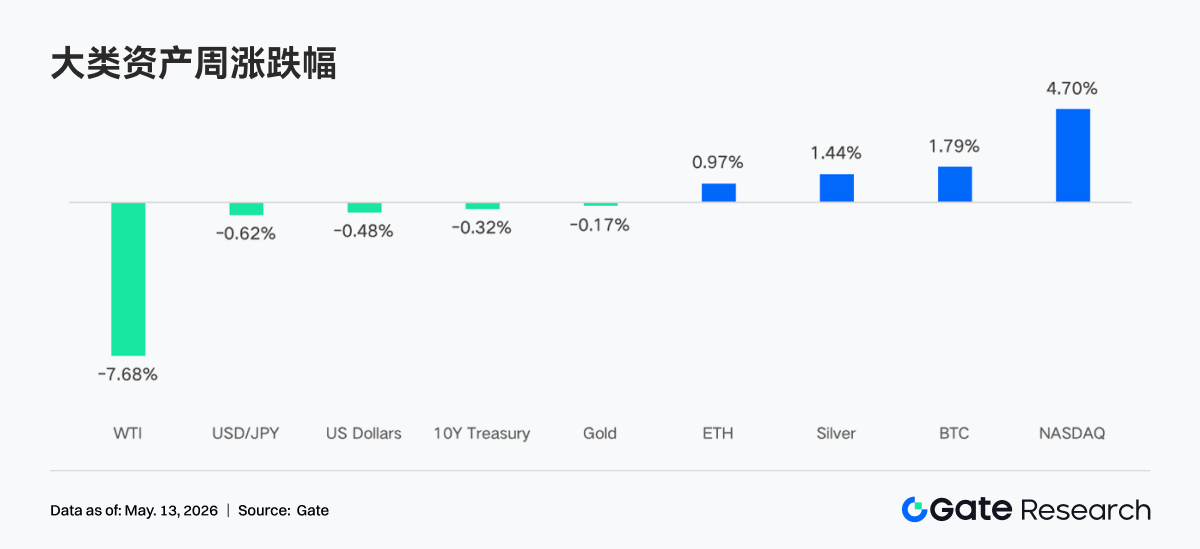
The U.S. proposed a cease-fire plan with substantial progress, covering 14 clauses, including the suspension of Iran's nuclear enrichment activities, gradual lifting of sanctions, and removal of restrictions related to the Strait of Hormuz. According to sources, this is the closest the two sides have come to reaching an agreement since the conflict began. The market reacted positively to this news, coupled with strong earnings reports across various industries, especially technology and artificial intelligence companies, driving the Nasdaq index to a weekly surge of 4.70%, reaching a recent high. Meanwhile, although geopolitical conflicts provided support for gold and silver, a significant decline in oil prices due to eased supply disruption worries (with WTI falling 7.68% for the week) limited gold's gains as inflation expectations cooled. In the cryptocurrency sector, Bitcoin steadily broke through the $82,000 mark, driven by continuous inflows into spot ETFs and improvements in market liquidity. In the forex market, the dollar index weakened due to dovish statements from the Federal Reserve, supporting a slight rebound in the yen.
Despite the impact of the oil crisis, the latest labor market data still shows improvement. In March and April, non-farm payrolls recorded gains for two consecutive months, reaching a new high for nearly a year, bringing the average monthly increase in the private sector to nearly 90,000 jobs so far this year. Meanwhile, the unemployment rate has decreased from its peak in 2025, with the latest data for April showing an unemployment rate of 4.3%, consistent with the previous year. Overall, the market has shifted from the "war panic" at the beginning of the week to optimistic pricing regarding "economic soft landing" and "Federal Reserve rate-cutting space."
2. Liquidity Analysis
2.1 BTC ETF Scale Continues to Expand
Last week, BTC ETFs showed a "strong opening, weak closing" pattern, recording net inflows for the first three trading days, then turning to net outflows for the last two days. The weekly net inflow of BTC ETFs totaled $631.6 million, a significant increase from the previous week, with overall market sentiment leaning positive. The ETH ETF weekly net inflow totaled $70.3 million, showing clear improvement from the previous week, turning positive from negative.
• Overall AUM Situation: As of May 8, BTC ETF total net asset value was approximately $106.77 billion, with historical cumulative net inflows exceeding $59.4 billion; ETH ETF total net asset value was approximately $13.6 billion, with historical cumulative net inflows of about $12.1 billion, with ETF net assets accounting for approximately 4.94% of Ethereum's total market value. BTC ETF scale continues to expand, with IBIT's single fund AUM reaching about $66.9 billion, accounting for approximately 66% of the entire BTC ETF market, surpassing most traditional commodity ETFs.
• Institutional Trends: This week, funds showed significant differentiation. IBIT had a net inflow of $596.3 million for the week, leading the way, maintaining its dominant position in institutional allocation; ARKB came in second with $53.1 million, indicating some institutions still hold interest in high beta strategy products. In contrast, FBTC recorded a net inflow of only $52.2 million, with substantial outflows of about $226.6 million over Thursday and Friday combined, reflecting institutions' more cautious stance on Fidelity products. GBTC continued its structural outflow, with a net outflow of $62.3 million for the week. In the ETH ETF arena, ETHA led with a net inflow of $100.1 million, while FETH was dragged down by a single-day outflow of $62.3 million on Thursday, resulting in a net outflow of $32.2 million for the week, showing significant divergence in the trajectories of the two major ETH products.
2.2 TradFi Liquidity
• TradFi Perp DEX: In the past week, TradFi Perp DEX's trading structure continued to focus on commodities as the absolute core, accounting for over 60%, showing that macro assets such as gold and oil still dominate on-chain TradFi trading demand. Amid ongoing geopolitical risks and risk aversion sentiments, funds clearly favor more volatile, directly narrative commodity assets. At the same time, the proportion of Indices/ETFs and Stocks continued to stabilize and rebound, reflecting some funds began to re-participate in U.S. stock index and ETF-related trading opportunities; traditional macro assets such as FX and Bonds maintained a low ratio. Overall, TradFi DEX's trading preference remains highly concentrated on the "macro trading" main line, with on-chain fund risk preferences not yet clearly switching to low-volatility assets.
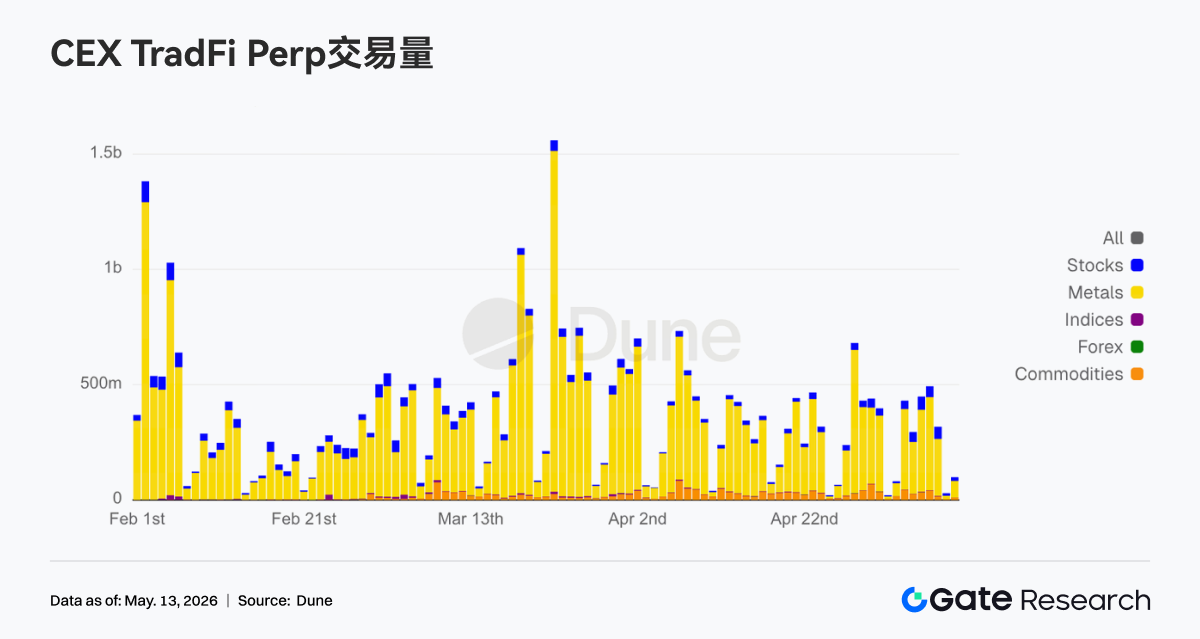
• TradFi Perp CEX: In the past week, CEX TradFi perpetual contract trading volume remained stable at high levels, with metals like gold continuing to dominate. The precious metals sector still accounted for the vast majority of trading volume, reflecting strong market participation enthusiasm for risk aversion and macro trading assets. Meanwhile, the stock sector's trading volume remained stable, indicating that funds continued to focus on U.S. stock indices and technology stocks' volatility opportunities; commodities saw periodic increases in volume driven by oil price fluctuations. Overall, the current CEX TradFi trading structure is still predominantly driven by gold, with macro events and risk aversion demands continuing to dominate market risk preferences.
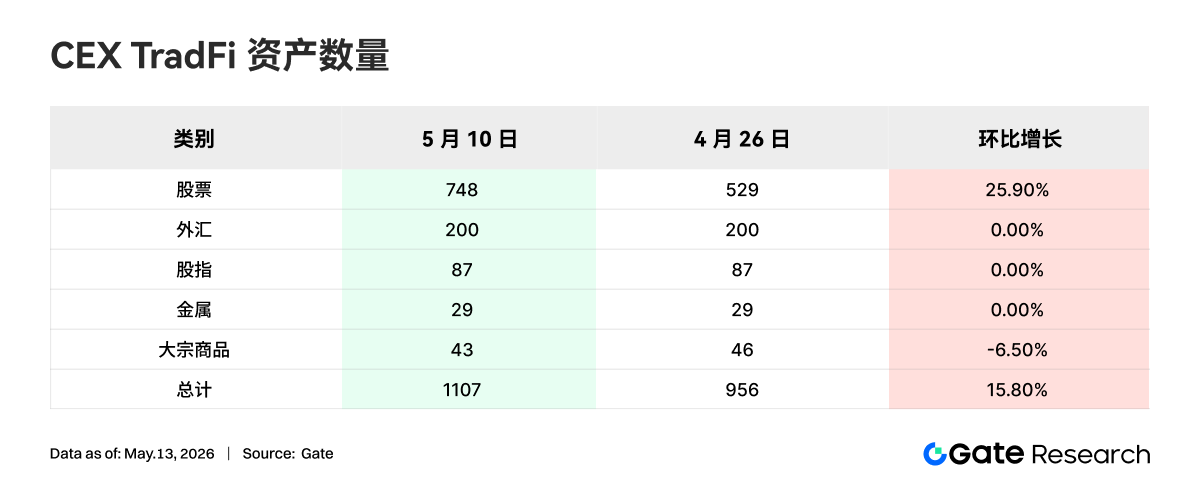
• CEX TradFi Asset Count: In the past week, the number of asset categories in CEX TradFi further expanded, with the total number of TradFi assets (counting only TradFi and CFD categories, excluding perpetual contracts) at mainstream CEX increasing from 956 to 1,107, a growth of 15.80% since the end of April. Stocks saw the most significant increase, rising from 594 to 748, a growth of 25.90%; Gate's stock-related TradFi grew by 104 compared to the end of April, reaching an increase of 38.95%.
• TradFi Order Book Depth: We selected XAUT, the highest trading volume in TradFi, analyzing its order book depth (Delta). In the past week, XAUT's depth structure exhibited a clear characteristic of "price rising, increased sell pressure." From May 4 to 5, the order book Delta recorded over $1 million in positive values consecutively, indicating significant buy pressure; however, the price still periodically retreated near $4,500, reflecting strong support at lower levels. From May 6, as gold prices rapidly rose above $4,700, the order book Delta turned to sustained negative values, with multiple instances of liquidity outflow exceeding $1.5 million per hour, indicating a clear increase in high sell orders, with some funds starting to take profit or hedge. Nonetheless, the XAUT price overall remained in high fluctuation, showing that the market's demand for gold as a risk-averse asset remains solid. The depth structure has gradually shifted from the earlier "active buying driving the price up" to the "high sell pressure and capital support game" stage, where short-term attention is needed to see if liquidity support around $4,650 can be maintained.
3. On-Chain Data Insights
3.1 Funds Flowing Back to Leading DEXs, Trading Focus Shifts Back to the Most Liquid Platforms
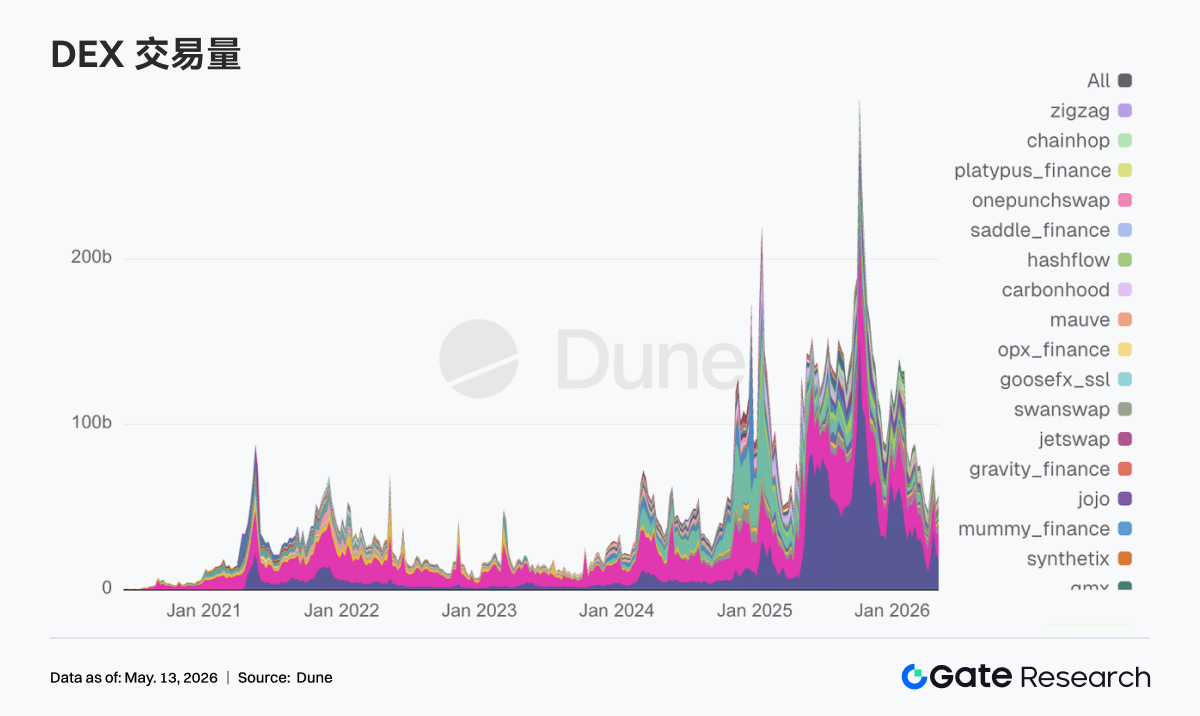
The first week's DEX market in May showed strong characteristics of returning to the main track, with PancakeSwap leading, but inflows favored Uniswap, Aerodrome, and other deeper liquidity trading scenarios more heavily. The Solana side hasn't slowed down, with Meteora and Raydium remaining active, and trading wasn't solely reliant on a single meme narrative like in previous weeks. After Bitcoin regained key psychological levels, overall market risk appetite reignited, and DEX transactions returned to a more active state. Notably, Grayscale removed Aerodrome in this week's DeFi fund quarterly rebalancing, increasing allocation to Ethena, while retaining Uniswap as the largest weight, indicating that institutional funds still prioritize mature liquidity protocols before selecting new narrative directions.
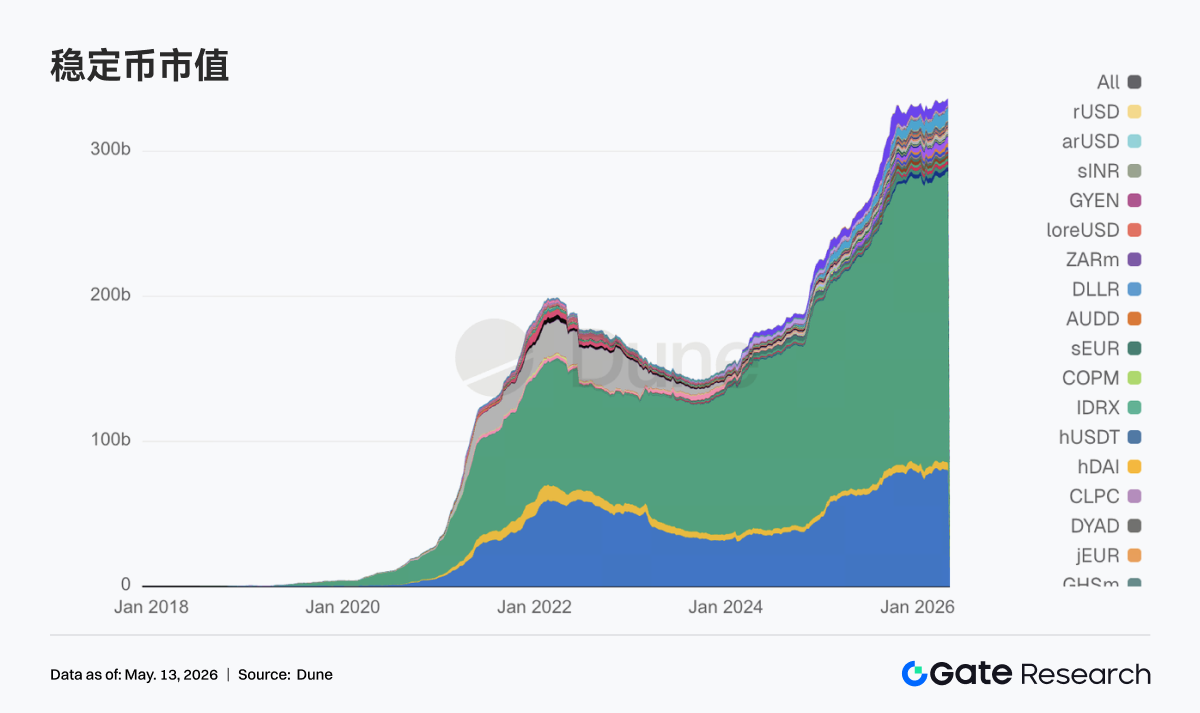
3.2 Market Attention Returns to Usable, Compliant, Cross-Chain Stablecoin Assets
Aside from the two major stablecoins, USDT and USDC, this week, payment-type, compliant stablecoins that can directly enter DeFi collateralization and clearing processes took more prominent positions, while yield-oriented and more experimental varieties saw reduced heat. This change parallels policy developments, with Reuters reporting that the Senate reached a crucial compromise around stablecoin reward and yield terms, prompting the market to quickly reassess which types of stablecoins best fit the next phase of the regulatory framework. Notably, Circle was intensely involved this week in bridging real-world regulations and ecosystems, obtaining relevant authorization from France's MiCA on May 4, submitting opinions on GENIUS rules the next day, and connecting USDC with CCTP on Injective on May 7, moving forward along the mainline of compliant distribution and cross-chain settlement.
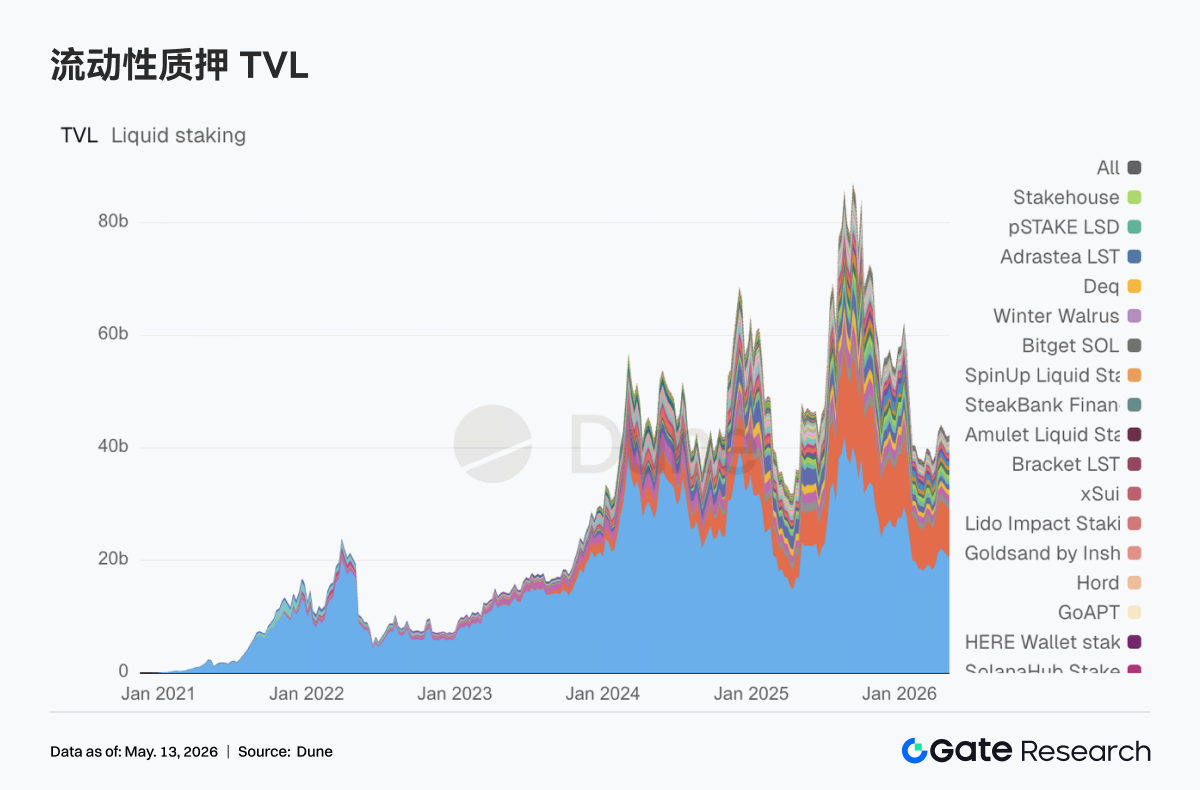
3.3 ETH LST Leaders Stabilize, Solana Side Catches Initial Risk Recovery
Top protocols on the ETH side have not fully come out of a one-sided strong recovery, with Lido showing some restraint, while Rocket Pool and StakeWise appear relatively stable. In contrast, Solana's LSTs are more proactively capturing the initial warming of market risk, with assets like Sanctum and Jupiter Staked SOL seeing more robust reception, with capital willing to reprice highly elastic staked assets. Meanwhile, Lido obtained Web3SOC certification this week, continuing to advance institutional due diligence, governance transparency, and security frameworks, further strengthening its slowly variable advantage in institutional funds.
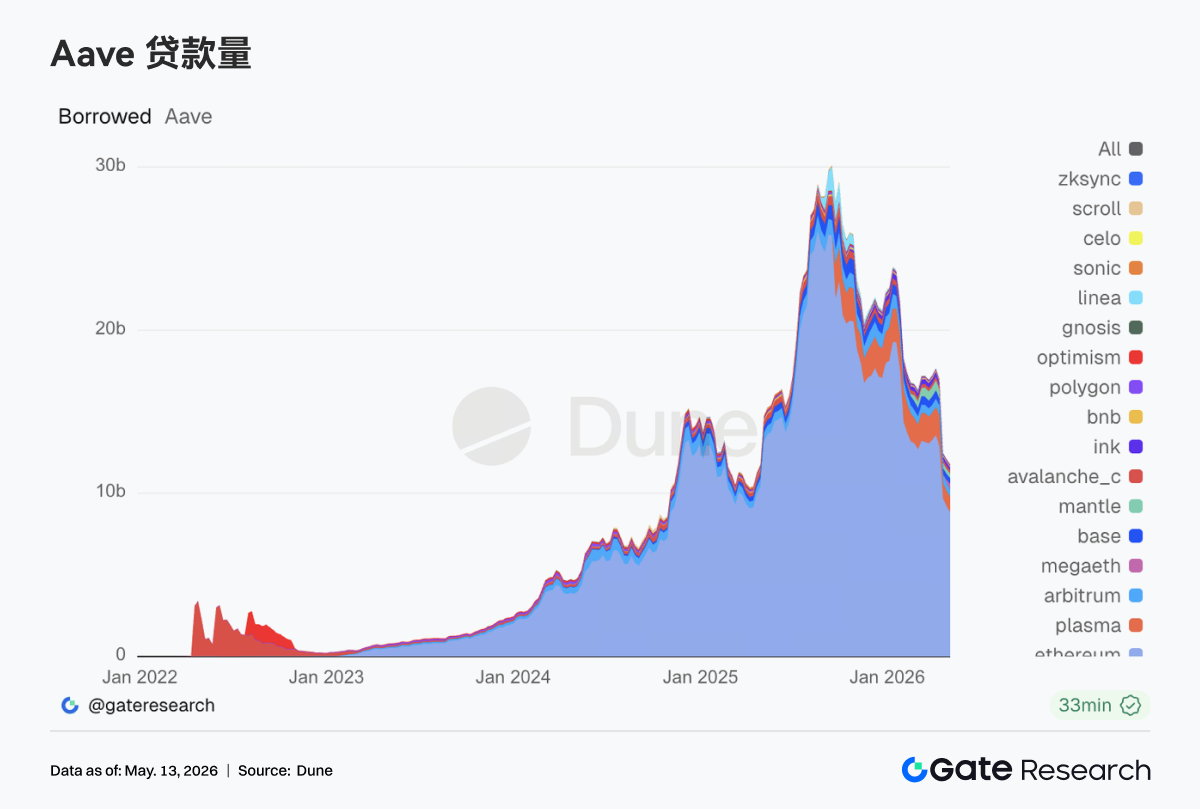
3.4 Aave Still Digesting the Aftermath of the rsETH Event, MegaETH Capturing New Loan Demand
Aave's lending data this week still showed strong signs of post-event recovery. The lending market for Ethereum decreased further, with old key markets like Arbitrum, Base, and Ink also appearing weak, and the previous scenes of multi-chain warmth have not returned. In contrast, Plasma continues to strengthen, with the lending market for the new public chain MegaETH rising especially prominently, as funds migrate from traditional main markets to newer scenarios and more incentivized markets. Aave Labs highlighted directly in the monthly update at the beginning of this month that the rsETH event interrupted the early growth pace of Aave V4. Subsequently, on May 5, Aave Lab's risk team pushed for an increase in the caps for EURC on Ethereum and USDm on MegaETH. Aave is shifting new growth points toward more regulatory clear stablecoins and lending markets on new chains, which can more easily form closed loops.
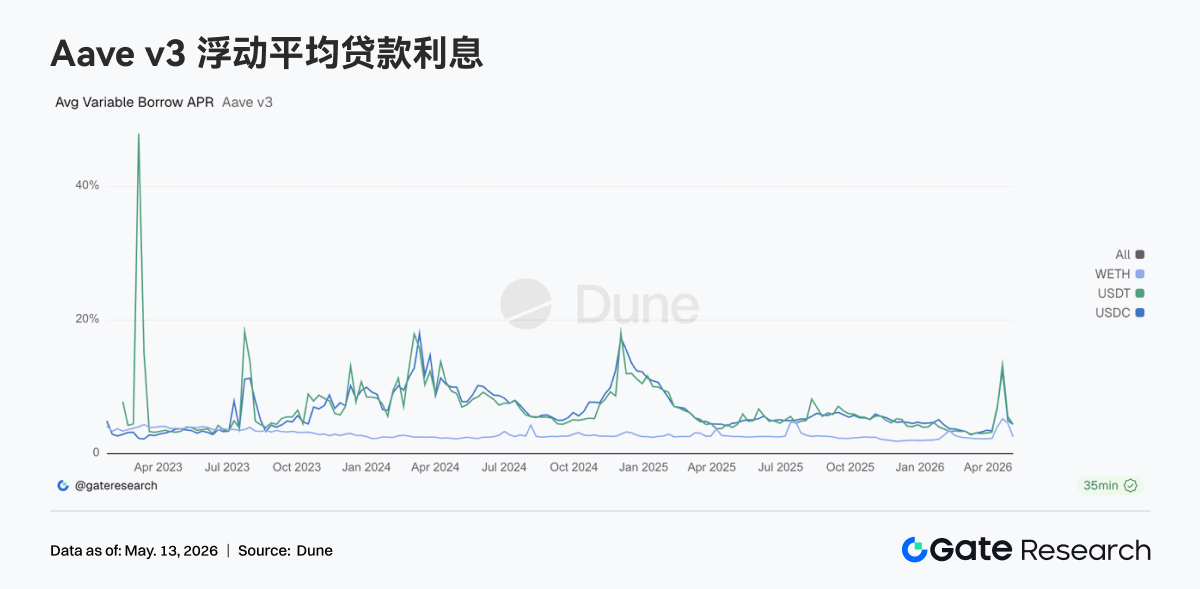
3.5 Aave Core Assets Returning from Stress State, WETH Leverage Retreating Most Noticeably
Compared to the rate increase due to accidents in the previous two weeks, Aave's loan rates have cooled down significantly this week. The average borrowing costs of USDC and USDT have returned to normal ranges, while WETH has decreased even faster. Looking at the combination with loan volumes, market demand has shifted from "snatching liquidity" back to "selectively borrowing liquidity." This also explains why EURC and USDm were prioritized in increasing supply caps, as stablecoin loan demands persist; however, they are now more inclined towards structured arbitrage, regional currency demands, and incentive trading on new chains.
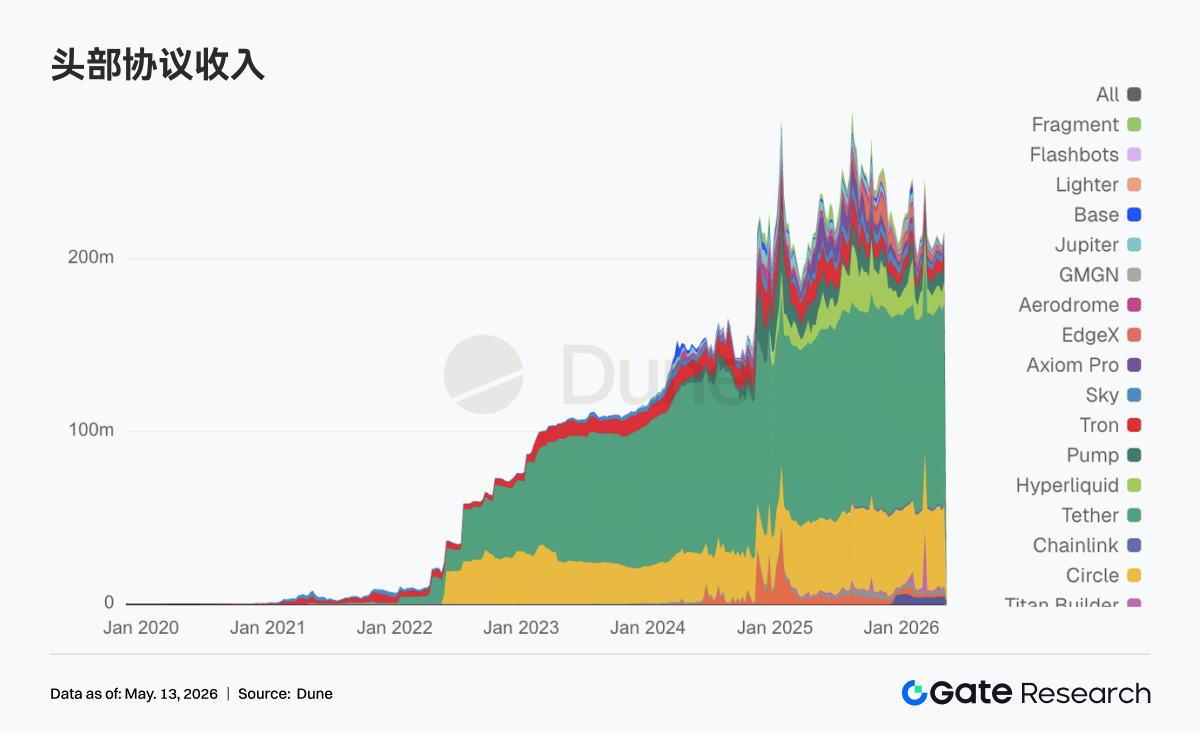
3.6 Protocol Revenue Returning to Stablecoin Foundations, Derivatives and Lending Elasticity Structures
Tether and Circle stablecoin issuance still contributes the most stable cash flow. This week, elasticity primarily returned to on-chain derivatives and lending infrastructure, with Hyperliquid gaining high traction, Aave's revenue elasticity significantly stronger than the previous week, and trading and clearing demands have not cooled down due to risk events from late April. Hyperliquid started entering Bitcoin outcome markets on May 5, and Hyperliquid Strategies disclosed expanding HYPE reserves and promoting validator collaborations, with the market pricing it as a signal of transitioning from perpetual contracts to a complete financial stack. On the other hand, Aave's revenue rise and the contraction of the lending market occurred simultaneously, reflecting both the risk premium and funds repricing in response to event impacts.
4. Derivatives Tracking
4.1 BTC Funding Rate Remains Deeply Negative with Rising OI, Short-Squeeze Structure Continues to Strengthen
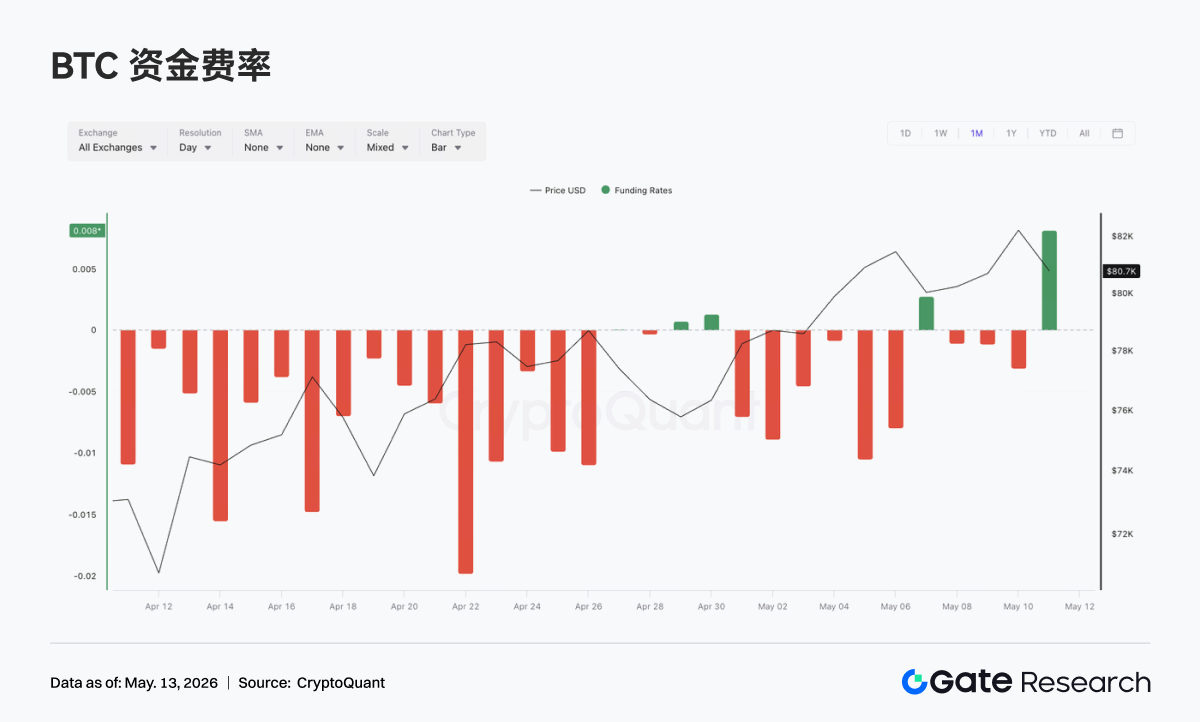
From May 4 to May 10, BTC's price continued to rise and maintained high fluctuations, climbing from around 79K to above 82K, although it briefly retreated to around 80K around May 7, it later recovered again. In terms of funding rates, it spent most of the week in negative territory, especially deeply negative around May 5 and 6, indicating that short sentiments in the price rising process have not completely faded, with certain "price strengthening but funding rates remaining bearish" diverging structures in the market.
Unlike the previous phase, OI quickly retreated after reaching about 29B around May 5, then oscillated between 26B and 27B. The combination of negative funding rates along with OI retreating suggests that the previously crowded short positions have begun to release as prices rose, with some leveraged positions exited either passively or actively. After May 7, BTC prices remained high and continued to recover, yet OI did not return to previous highs, indicating limited willingness to add new leveraged purchases, with the market gradually shifting from the accumulation phase of "shorts increasing + prices not falling" to the "post-squeeze high turnover" state.
Overall, the current derivatives structure still leans toward bullish dominance, but the short-squeeze momentum has experienced some phase-based digestion since around May 5. If prices continue to break above 82K and OI rebounds simultaneously, it might re-trigger a resonance of leveraged buying and short-covering; however, if prices fluctuate high while OI continues to decline, this indicates that the current upward momentum more stems from earlier short covering, necessitating spot buying or new long leverage to sustain further.
4.2 Options Trading Volume Temporarily Amplified, Monthly Contracts Maintain Dominant Structure
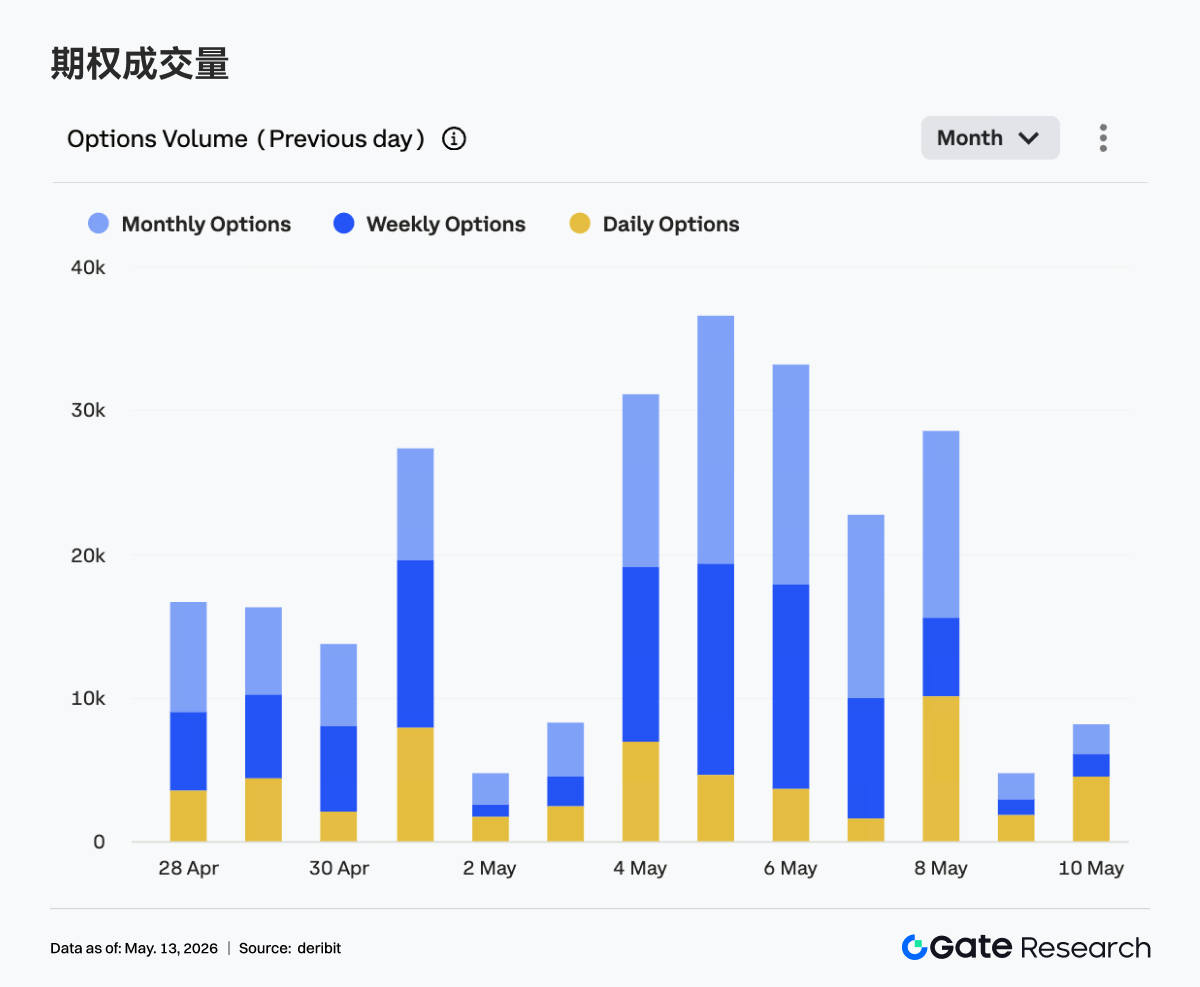
Last week, BTC options trading volumes exhibited obvious characteristics of peaking and then declining. From May 4 to May 6, trading volumes remained high, with May 5 reaching the peak at nearly 36K daily, and May 6 still holding around 33K, indicating that when prices rapidly ascended to the 81K-82K range, trading and hedging demands on the options side were significantly amplified.
In terms of structure, monthly and weekly options still dominate trading volumes, indicating that market participants continue to focus mainly on medium- to short-term directional positioning and volatility management. Notably, May 8 saw a significant rise in daily options trading volume, reflecting that during price volatility at high levels, demands for short-cycle event trading and near-expiry risk management have increased. However, volumes clearly retreated from May 9 to May 10, particularly dropping to weekly lows on May 9, indicating that proactive trading interest cooled after temporarily entering high-level consolidation.
Overall, with concentrated pricing for breakout during May 4 to May 6, the options market's trading heat has since moderated, indicating that the market hasn't continued to chase higher volatility. The current structure is closer to a "post-breakout high-level observation," with subsequent reactions to BTC again challenging upper ranges being critical signals for whether the market enters a new round of directional pricing.
4.3 Implied Volatility Across All Expiry Periods Overall Rebounds, Expiry Structure Tends to Converge
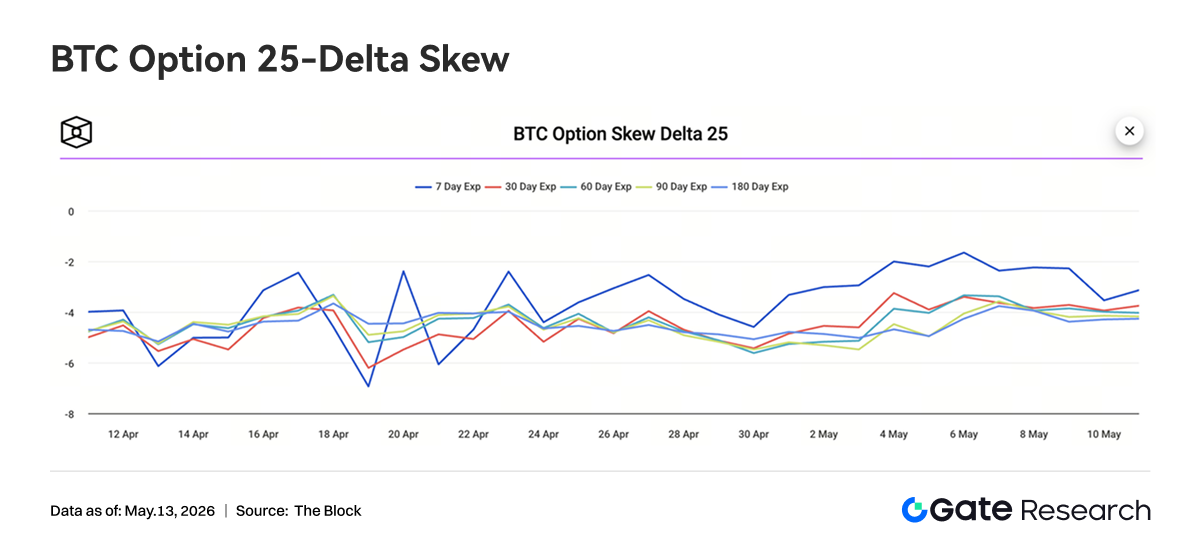
Last week, the BTC 25D Skew across all expiry periods remained in negative territory, indicating that the options market's pricing for downside protection remains higher than for upside chasing, and risk preferences haven't completely shifted towards unidirectional optimism. At the beginning of the week, the 7D Skew briefly rebounded to around -2, notably higher than other expiry periods, indicating that during the rapid price ascent, short-dated puts were seeing reduced premiums, with short-term panic emotions moderating for the market temporarily.
However, entering May 9 to May 10, the 7D Skew retreated back to around -3.5, gradually converging with mid- to long-terms, reflecting a resurgence in short-term protection demands following price volatility at high levels. The 30D, 60D, 90D, and 180D Skews overall saw less fluctuation, mostly maintained in the range of -3.5 to -4.5, indicating that the mid- to long-term market retains a certain defensive pricing, not significantly shifting towards a chasing structure due to price ascension.
Overall, the Skew structure reflects a market that is not pessimistic about BTC's upward trend but remains vigilant regarding retracement risks at high levels. The shift in short-term Skew from recovery to retreat suggests that short-term traders are increasing protection again after price spikes, and if subsequent prices cannot effectively break through highs, protective demands may continue to support put option premiums.
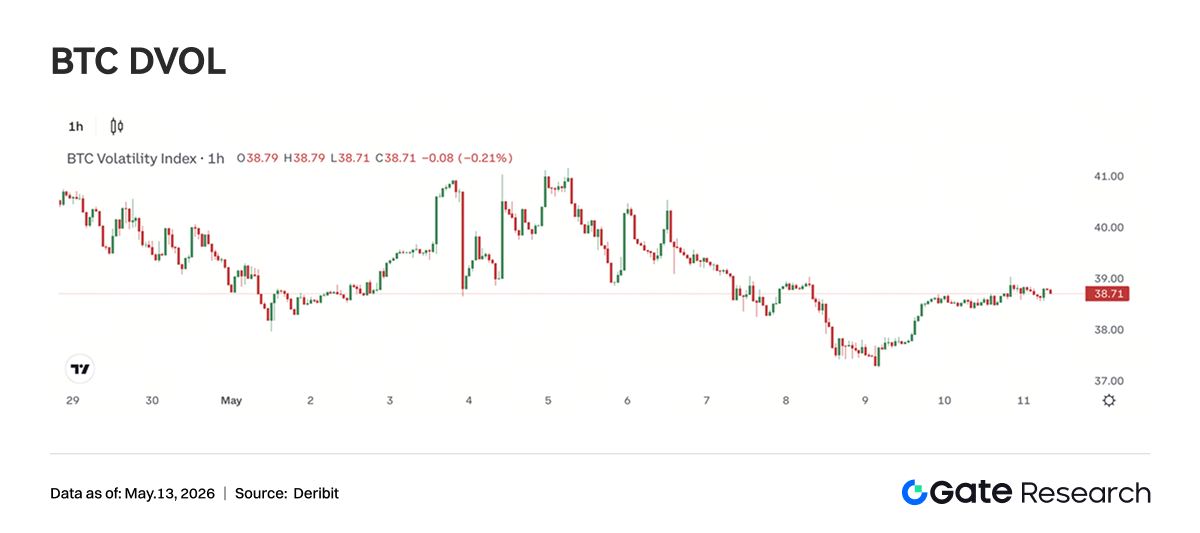
4.4 BTC Volatility Index Oscillating Downward then Stabilizing, Short-Term Volatility Compressing
Last week, the BTC Volatility Index (BVOL) exhibited a significant spike from May 4 to May 5, nearing 41, then quickly retreated, and during May 8 to May 9, dipped to the 37-38 range. On May 10, the volatility index saw some recovery, but generally maintained around 38.5-39, lower than the early week highs. In rhythm, BVOL's high points generally coincided with BTC's rapid price upswings and surges in options trading volumes, indicating that the market briefly raised volatility expectations during breakout phases. However, as prices entered high-level fluctuations, OI retreated, and options trading volumes cooled, volatility pricing quickly compressed, showing a decrease in market expectations for short-term drastic volatility.
Overall, the current status is a combination of "high price fluctuations + stabilizing volatility," indicating that the derivatives side's pricing for further unilateral breakthroughs remains insufficient. If BTC subsequently continues to maintain high-level consolidations, BVOL may stay in a low oscillation; however, with funding rates still experiencing fluctuations and Skew remaining negative, if prices again breach or dip below the range, there exists a possibility for rapid repricing of volatility.
5. This Week's Outlook
6. Gate Institutional Dynamic Update
Trading Volume and Liquidity Performance
• The overall trading volume in the first two weeks of May maintained an upward trend, with spot increasing by 14.54% and contracts increasing by 18.10%.
• The market share of contract trading and institutional client structures remained overall stable.
• Spot depth has recovered to nearly bull market levels, with significant rebound in trading of smaller coins; the overall performance of small coin spots continues to outperform the market.
CrossEx Products and Infrastructure
• CrossEx has set new highs in trading volume and asset scale for three consecutive weeks.
• Demand for cross-exchange arbitrage, hedging, and singular lock strategies continues to grow, with major exchanges significantly optimizing latency. CrossEx will add a new exchange in late May, supporting at least 6 exchanges by the end of Q2.
Brand and Ecosystem Development
• The Gate Institutional Circle Amsterdam station has entered its preparation stage, aiming to strengthen Gate's brand influence and ecosystem collaboration in the European institutional market.
Data Sources
• Investing, https://investing.com/currencies/xau-usd-historical-data
• Gate, https://www.gate.com/trade/BTC_USDT
• CMC, https://coinmarketcap.com/real-world-assets/?type=all-tokens
• Coinglass, https://www.coinglass.com/pro/depth-delta
• Dune, https://dune.com/gateresearch/gate-tradfi#weekly-volume
• Dune, https://dune.com/gateresearch/gate-institutional-weekly-report
• Bybit, https://www.bybit.com/future-activity/en/tradfi
• Bitget, https://www.bitgettradfi.com/tradfi/XAUUSD
• CryptoQuant, https://cryptoquant.com/asset/btc/chart/derivatives
• Amberdata, https://pro.amberdata.io/options/deribit/btc/current/
Gate Research Institute is a comprehensive blockchain and cryptocurrency research platform that provides readers with in-depth content, including technical analyses, hot insights, market reviews, industry research, trend forecasts, and macroeconomic policy analyses.
Disclaimer
Investing in cryptocurrency markets involves high risks, and users are advised to conduct independent research and fully understand the nature of the assets and products they purchase before making any investment decisions. Gate shall not be liable for any losses or damages arising from such investment decisions.
免责声明:本文章仅代表作者个人观点,不代表本平台的立场和观点。本文章仅供信息分享,不构成对任何人的任何投资建议。用户与作者之间的任何争议,与本平台无关。如网页中刊载的文章或图片涉及侵权,请提供相关的权利证明和身份证明发送邮件到support@aicoin.com,本平台相关工作人员将会进行核查。


