Ethereum ETH 1 Day K-Line Chart Explanation
I. News Analysis
Bearish Factors
US Inflation Expectations Rise: The market is concerned that this week's US CPI data may exceed expectations, increasing the likelihood of the Federal Reserve maintaining its tightening policy, strengthening the dollar and suppressing crypto risk assets, with Ethereum following the market under pressure.
Outflows from Spot ETH ETFs: Recently, there has been a continuous net outflow of funds from spot Ethereum ETFs, and institutions have a weaker short-term allocation willingness for ETH compared to BTC, with a lack of support from funds.
Bullish Factors
On-chain Staking Data Stabilizes: Ethereum beacon chain staking volume is stable, validator outflows have slowed, network activity remains stable, and the fundamentals have not further deteriorated.
Institutional Compliance Expectations Support: Progress in the US crypto regulatory framework, with some institutions still holding long-term compliance expectations for ETH, providing some price support.
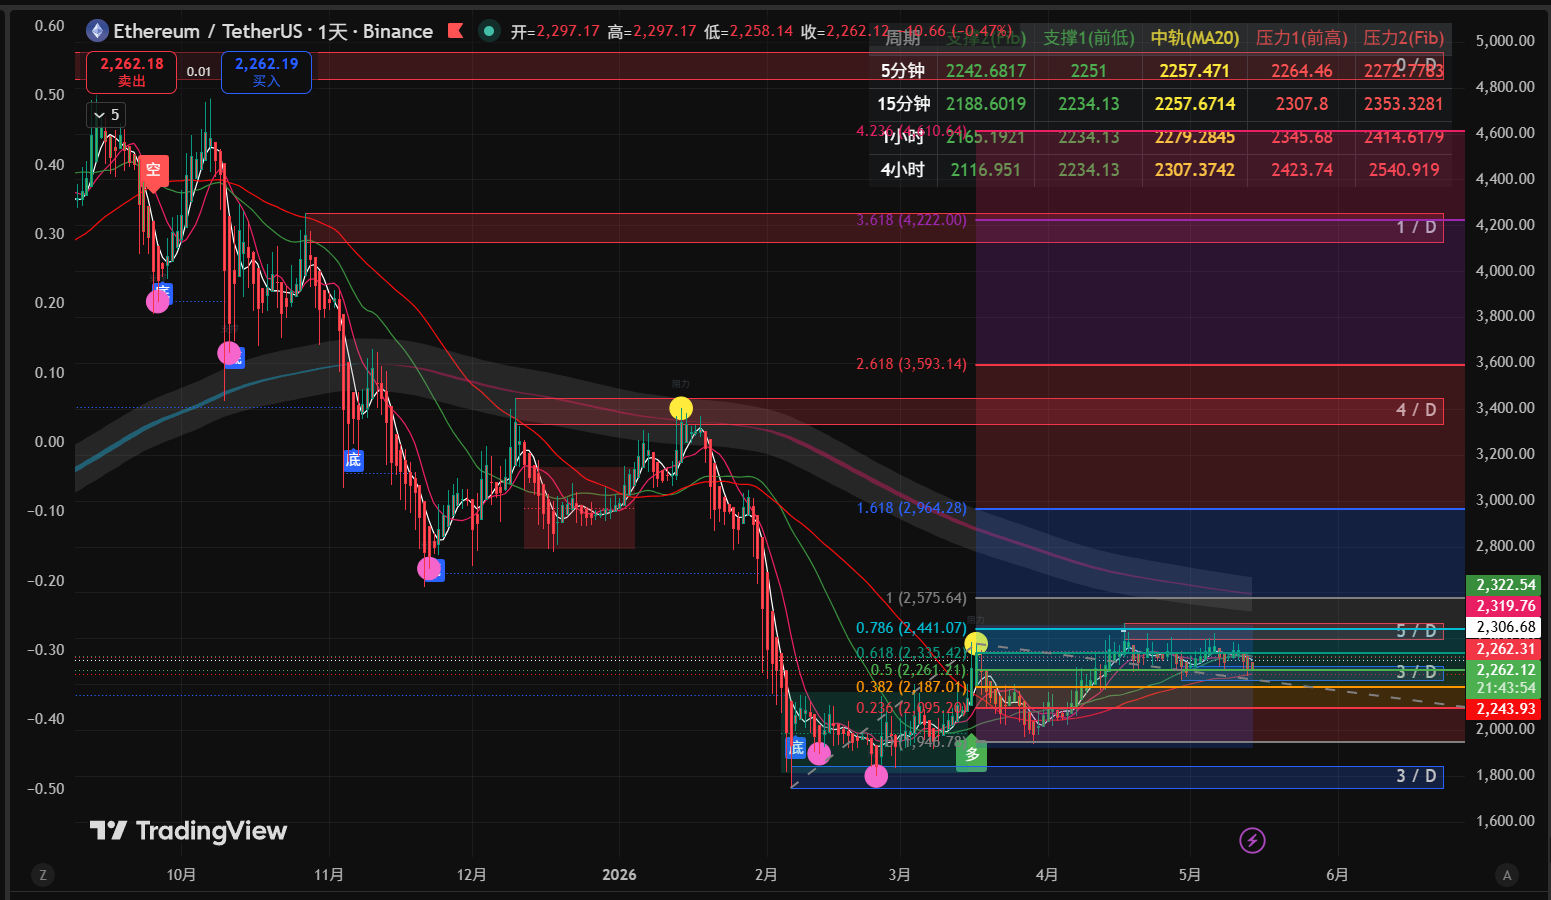
II. Technical Analysis (Daily Level)
Price and Fibonacci Extensions: The current price is approximately $2262, near the 0.5 retracement level of a downward trend, with the 1.618 extension level ($2964) serving as strong resistance, while the key support range is at 1 ($2575), 0.786 ($2441), and 0.618 ($2335).
K-Line and Moving Averages: The price is below the MA5/MA10/MA30 moving averages, with the moving averages arranged in a bearish formation, indicating a short-term bearish trend; currently, the K-Line is oscillating around 0.5 ($2262) without a clear reversal signal yet.
Indicator Performance:
RSI: Positioned in a neutral to bearish range, not showing oversold conditions, with downward momentum not fully released.
MACD: Bearish momentum persists, with the fast and slow lines not forming a golden cross, and rebounds lack volume support.
Bollinger Bands: The price is running below the middle band, and the Bollinger Bands are opening in a bearish direction, indicating a high probability of continued oscillation downwards in the short term.
III. Trading Direction Recommendations
Trading Direction | Key Levels (ETH/USDT) | Position Suggestion |
|---|---|---|
Short-term Short | Entry: $2280-2300 (Resistance met at 0.5-0.618 retracement range) Stop Loss: $2350 (Break above 0.618 resistance) Take Profit: $2180 (Drop to 0.382 support) | Total position 10%-15%, enter in batches |
Watch / Buy Low | Support Level: $2100-2150 (Strong support range) Stop Loss: $2000 (Fall below previous low) Take Profit: $2400 (Rebound to 0.786 resistance) | Only lightly test buy after support stabilizes, with a position not exceeding 5% |
IV. Risk Warning
Macroeconomic Data Risk: This week's US CPI data exceeding expectations may trigger violent market fluctuations, making it necessary to set stop losses in advance to avoid significant losses from one-sided market movements.
Regulatory and Liquidity Risks: If the US regulatory attitude towards ETH becomes stricter, or if ETF outflows expand, it may accelerate price declines, requiring close attention to related developments.
Operational Response Plan: In a volatile market, prioritize controlling positions and avoid chasing highs or lows blindly; positions can be appropriately reduced before key data releases to avoid liquidity risks.
The above article is by: Meridian Analysis. For more information on cryptocurrency and forex, scan the QR code to follow this public account and communicate with me. Articles may have a delay in sending, and content is for reference only. I have years of research experience in cryptocurrency and forex, welcome everyone to learn
免责声明:本文章仅代表作者个人观点,不代表本平台的立场和观点。本文章仅供信息分享,不构成对任何人的任何投资建议。用户与作者之间的任何争议,与本平台无关。如网页中刊载的文章或图片涉及侵权,请提供相关的权利证明和身份证明发送邮件到support@aicoin.com,本平台相关工作人员将会进行核查。