30-Minute ETH Chart Analysis
1. News Analysis
Macroeconomic Environment: In mid-May 2026, the market shows fluctuations in expectations for interest rate cuts, with some safe-haven funds flowing out of high-volatility crypto assets.
On-Chain Data: There has been a slight net inflow of ETH into exchanges in the past 24 hours, indicating increased local selling pressure.
Whale Movements: Monitoring shows that yesterday, at high levels (around 2380), large whale addresses were reducing positions, leading to a lack of strong supportive funds at current price levels.
Regulatory Dynamics: The market is digesting the marginal effects of previous Layer 2 expansion policies, with no new explosive positive news.
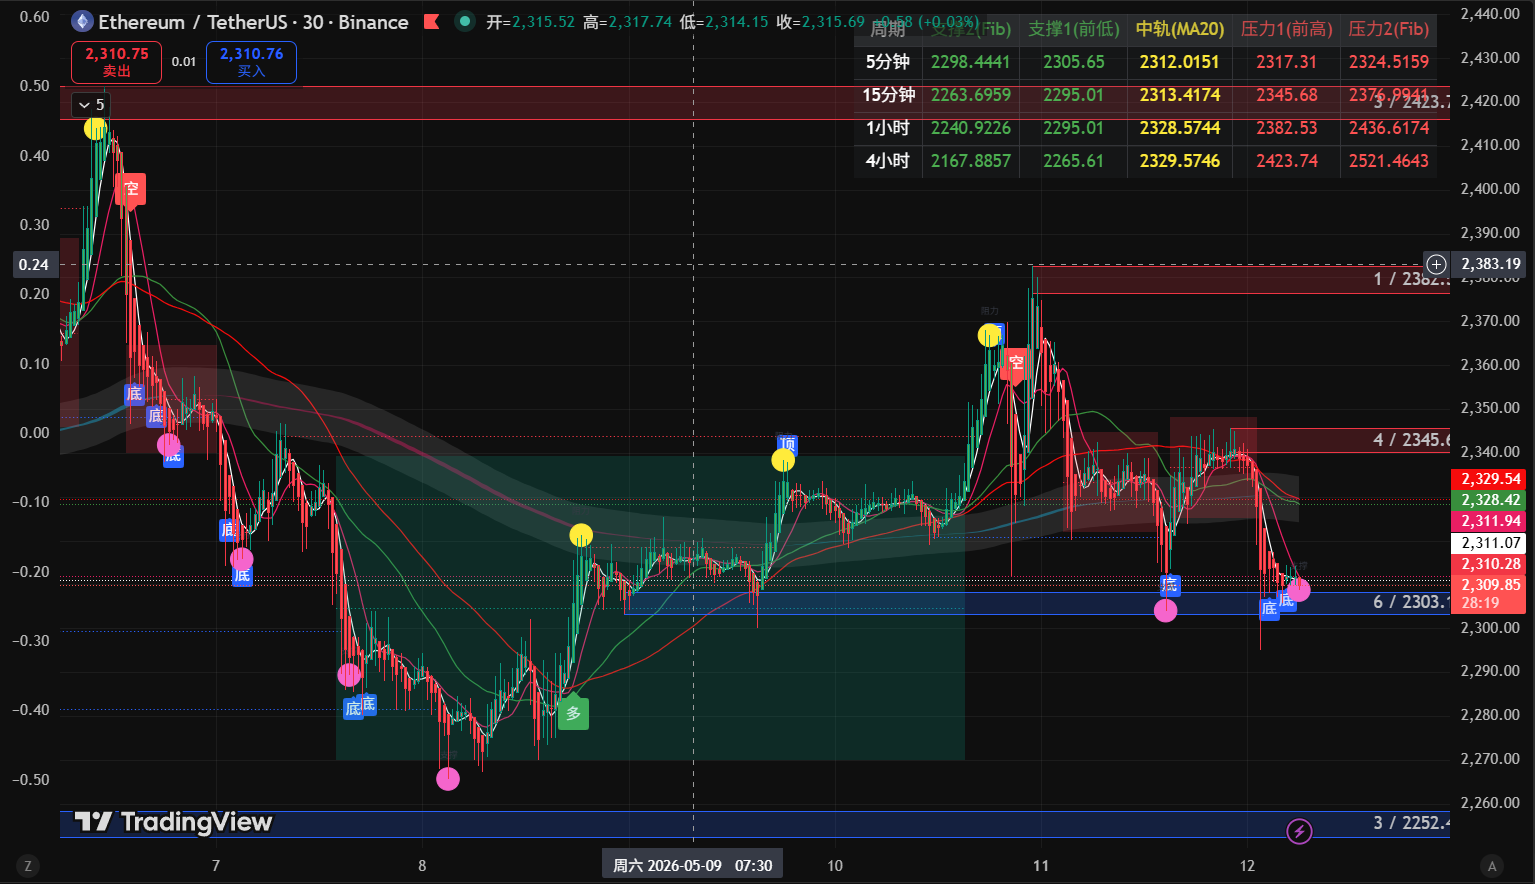
2. Technical Analysis (Based on 30 Minute)
Candlestick Pattern Analysis:
Breach Pattern: After failing to spike above 2380, the candlestick shows a series of downward shadows, having effectively broken below the previous concentrated transaction area (around 2340).
Low-level Consolidation: Currently, there is a long lower shadow indicating some buying support at the 2300 integer mark, but the rebound is weak, and in form, it is a typical "continuation of decline" or "bottom grinding" pattern.
Moving Average System (MA):
MA5/MA10/MA30/MA52: The four moving averages currently show abearish arrangement, and the short-term moving averages (red) are accelerating downward and moving away from the long-term moving averages (green), indicating strong downward momentum.
The current price is operating below all moving averages, with the upper 2330 - 2340 area having transformed from support to strong resistance.
Indicator Analysis:
RSI: The current value is 31.34 (on the edge of oversold), indicating significant short-term selling pressure. Although there is an expectation for a technical oversold rebound, its strength is questionable.
MACD: Positioned below the zero axis with the momentum histogram continuing to expand, there are no clear signs of exhaustion in bearish momentum.
3. Action Direction
Entry / Position Increase:
Left Side Testing: If the price retraces to the 2300 - 2305 range without breaking below, a light position can be taken to speculate on an oversold rebound.
Right Side Confirmation: Need to wait for the price to increase and reestablish above 2335 before entering or adding to positions.
Position Reduction / Profit Taking:
Rebound Target: 2328 - 2335 (moving average resistance level)
Stop Loss Points:
Core Stop Loss: 2295 (if broken with volume, the space below will open up to 2250)
Position Management:
Currently in a downward trend, it is recommended to reduce positions to within 20%.
4. Risk Warning
Accelerated Downside Risk: 2300 is an important psychological barrier; if effectively broken, it may trigger collective liquidation of leveraged long positions.
Prolonged Decline Risk: The RSI's oversold condition may be repaired through prolonged sideways oscillation instead of a quick rebound, and this "prolonged decline" is very detrimental.
Response Plan: Strictly implement a no-heroics strategy; all long positions must set a hard stop loss at 2,295.

免责声明:本文章仅代表作者个人观点,不代表本平台的立场和观点。本文章仅供信息分享,不构成对任何人的任何投资建议。用户与作者之间的任何争议,与本平台无关。如网页中刊载的文章或图片涉及侵权,请提供相关的权利证明和身份证明发送邮件到support@aicoin.com,本平台相关工作人员将会进行核查。