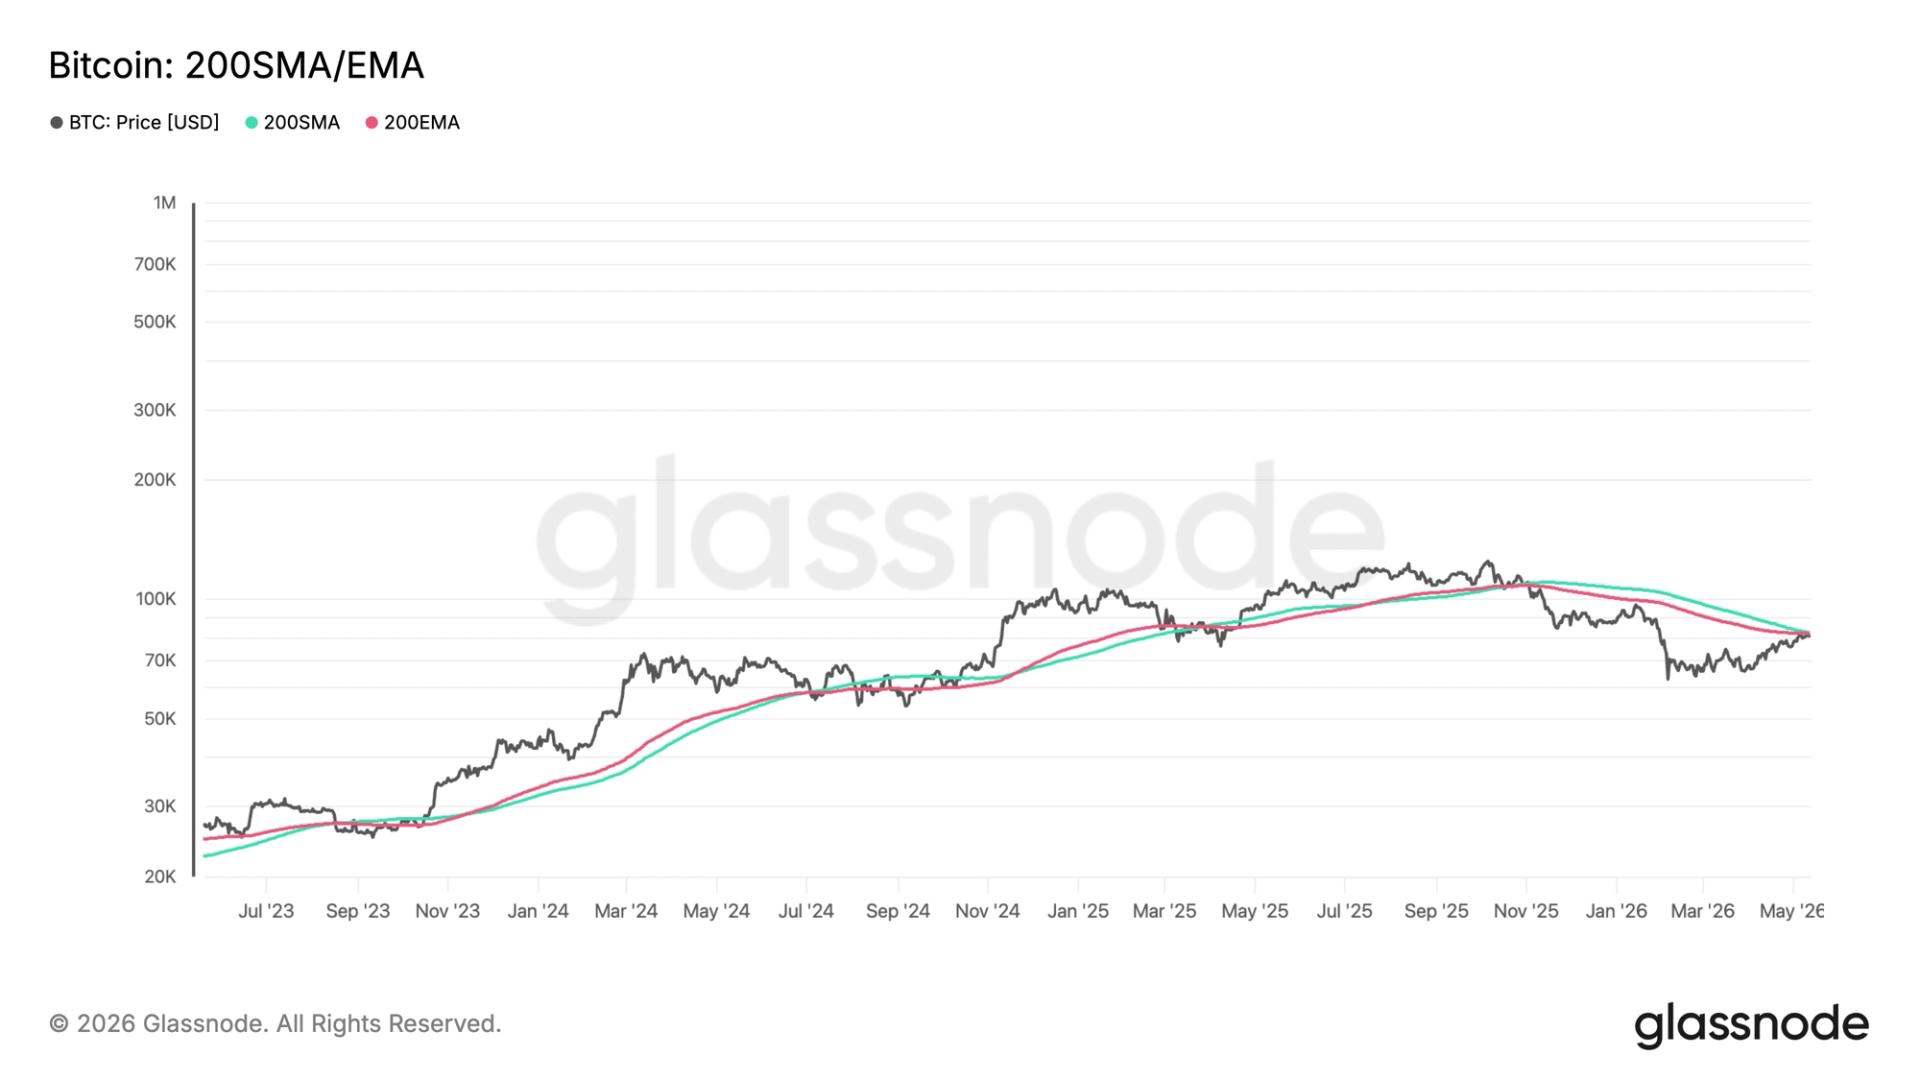
What to know : Bitcoin is trading just below the 200-day SMA of $82,455 and the 200-day EMA at $82,027, forming a major resistance zone that could determine whether the long-term uptrend resumes. The 200 SMA and 200EMA form a confluence resistance zone around $82,000–$82,500 that bitcoin must convincingly reclaim to signal a recovery of its long-term uptrend. Despite the rejection at the 200-day averages, bitcoin remains above the 128DMA, the True Market Mean, and the Short-Term Holder Cost Basis, signaling that most recent buyers are still in profit and reducing the risk of panic-driven selling.
Bitcoin is fighting a key technical battle and is trading just below two closely watched long-term trend indicators: the 200-day Simple Moving Average (200SMA) at $82,455 and the 200-day Exponential Moving Average (200EMA) at $82,027, according to Glassnode data.
The 200SMA calculates the average closing price across the last 200 days, weighting each day equally. The 200EMA uses the same 200-day window but places greater emphasis on more recent prices, making it slightly more responsive to current market conditions.
Together, they form a confluence resistance zone around $82,000–$82,500 that bitcoin must convincingly reclaim to signal a recovery of its long-term uptrend.
Bitcoin first lost the 200DMA in late November 2025, when the price rolled over from $108,000. A brief recovery attempt in January failed to reclaim the level around $97,000 and by early February 2026 bitcoin had fallen to $60,000.
What gives bulls reason for cautious optimism is that bitcoin is holding above several significant cost basis levels, according to CheckonChain. The 128-day Moving Average sits at $75,700, representing the average price paid by buyers over that shorter timeframe and a level BTCX has successfully defended.
The True Market Mean, currently at $78,200, reflects the average price of every bitcoin at the time it last moved onchain, essentially representing the aggregate cost basis of the entire active market.
The Short-Term Holder Cost Basis at $78,400 tracks the average acquisition price of investors who bought within the last 155 days, a group historically prone to panic selling when underwater.
Bitcoin trading above all three suggests the majority of recent buyers remain in profit, reducing sell pressure from forced liquidations or panic selling. The key zone to watch is whether bitcoin can flip the $82,000-$82,500 into support.
免责声明:本文章仅代表作者个人观点,不代表本平台的立场和观点。本文章仅供信息分享,不构成对任何人的任何投资建议。用户与作者之间的任何争议,与本平台无关。如网页中刊载的文章或图片涉及侵权,请提供相关的权利证明和身份证明发送邮件到support@aicoin.com,本平台相关工作人员将会进行核查。


