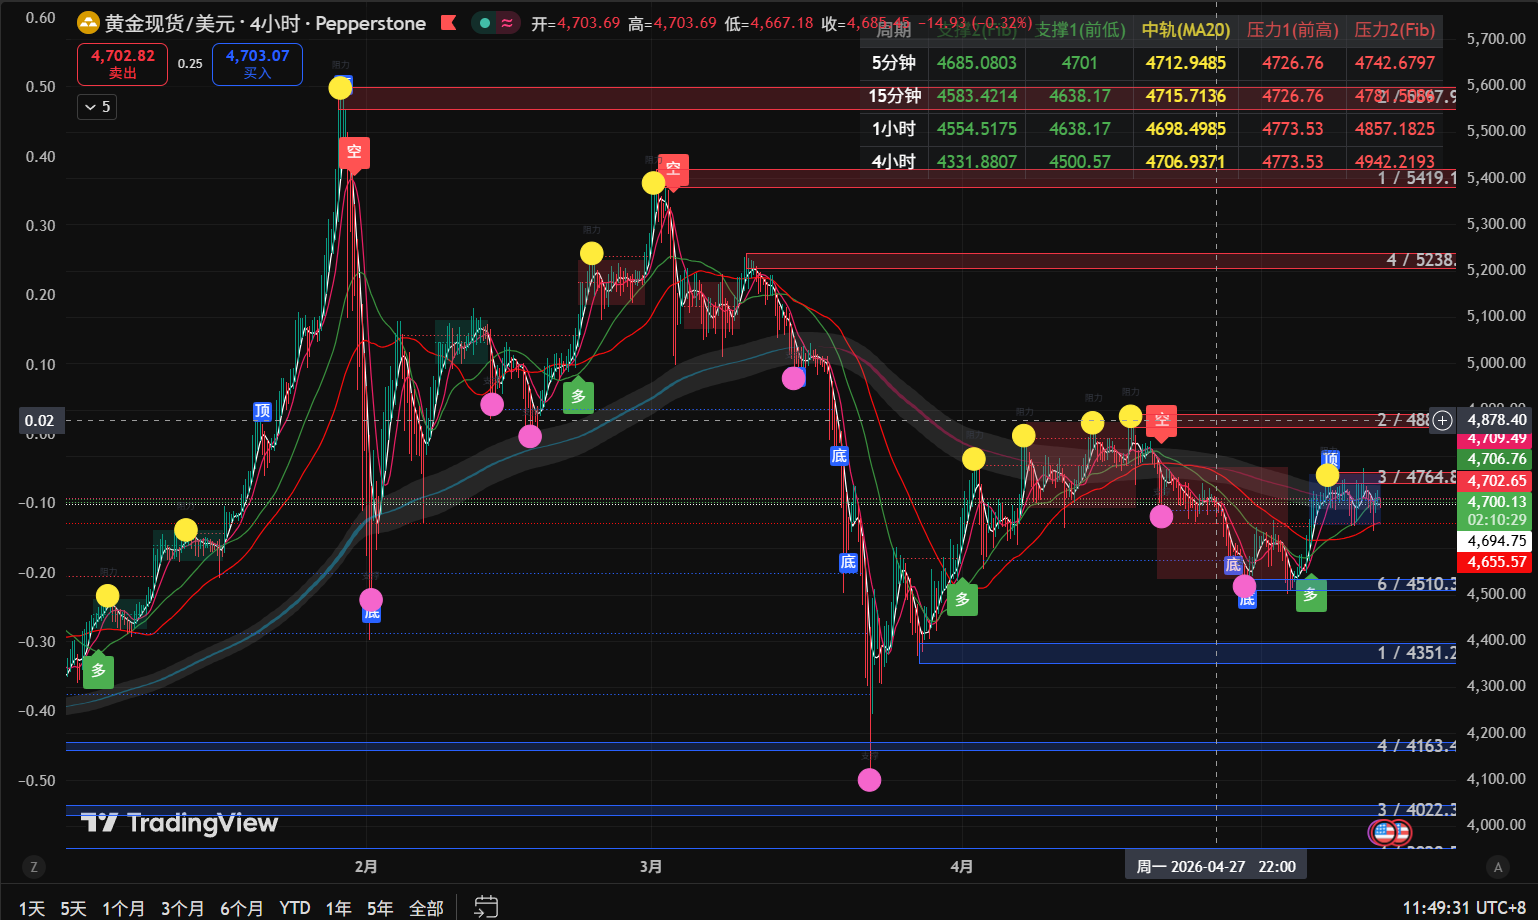
Gold 4-Hour Market Chart
I. News: Mixed Signals, Inflation Expectations Dominate Short-Term Sentiment
Bearish Factors: U.S. Inflation Data Exceeds Expectations
The U.S. April CPI data rebounded above expectations, strengthening market expectations for the Federal Reserve to maintain high interest rates, causing the dollar index and U.S. Treasury yields to rise together, directly suppressing gold's bullish momentum, and is the core bearish factor for the recent price increase and subsequent decline.Bullish Factors: Long-Term Support Logic Remains
Goldman Sachs raised its gold target price for 2026 to $5,200, combined with the People's Bank of China increasing its gold reserves for the 18th consecutive month, providing long-term bottom support for gold prices and limiting the space for short-term corrections.Neutral to Bullish Factors: Periodic Support from Geopolitical Situations
The geopolitical situation in the Middle East remains tense, providing periodic support for gold prices due to risk aversion, but no new significant escalation events have occurred, thus limiting its impact on the market.
Overall, short-term market sentiment is dominated by inflation expectations, presenting a pattern of “long-term bullish foundation, short-term bearish pressure,” with bullish and bearish forces in a relatively balanced state.
II. Technical Analysis: Weak Oscillation on 4-Hour Level, Intense Competition in Key Ranges
1. Price and K-Line Pattern
The current spot gold price is about $4,704 per ounce, with an intraday high followed by a decline, closing around $4,700. The K-line has a long upper shadow, indicating heavy selling pressure above, and short-term bullish momentum is clearly converging, showing a weak oscillation trend at high levels.
2. Key Support and Resistance Levels
Resistance Levels:
The first resistance level is $4,730, near the intraday high and the upper edge of the short-term oscillation range. If unable to break through effectively, gold prices will likely maintain a weak oscillation pattern;
The second resistance level is $4,770, a previous rebound high and a strong resistance zone. Only by breaking this level can we confirm the resumption of the bullish trend.
Support Levels:
The first support level is $4,670-$4,690, which is the lower edge of the recent oscillation range and also a dense area of the 4-hour moving average, crucial for short-term bullish-bearish competition;
The second support level is $4,637, the previous low point and a strong support level; if it falls below this point, gold could initiate a new round of adjustments.
3. Moving Average System and Technical Indicators
Moving Average System: The price is currently hovering around MA5 ($4,706), slightly below the short-term moving average, disrupting the short-term bullish trend; however, MA10, MA30, and MA52 moving averages are still arranged upward, indicating that the long-term upward trend has not been broken, showing characteristics of “long-term trend upward, short-term correction.”
MACD: The 4-hour level red bars are continually shortening, with signs of a dead cross in the fast and slow lines, indicating persistent diminishment of bullish momentum, and bearish forces are beginning to dominate the short term.
RSI: The current RSI is around 50, within a neutral range, with no overbought/oversold signals, indicating a relatively balanced market between bulls and bears.
Bollinger Bands: The price touched the upper band before falling back, currently running near the middle band, with the Bollinger Bands' opening narrowing, suggesting that short-term oscillating conditions will intensify.
III. Operational Direction: Bearish Bias in Range Oscillation, Trade Lightly
1. Core Operational Strategy
Short-term focus on high shorts paired with low longs, pay attention to breakout situations of key support and resistance levels; if the range breaks, adjust strategies accordingly.
2. Specific Points and Position Management
Short-Term Short Position (Main Strategy): It is recommended to enter in the $4,710-$4,725 range, targeting $4,680 first, further aiming for $4,650; set stop-loss above $4,740 to avoid being caught by false breakouts. Position should be controlled at 10%-15% of total capital, participating lightly.
Short-Term Long Position (Auxiliary Strategy): Only consider lightly testing long when the price falls back to the $4,670-$4,680 range and a stop decline signal appears, targeting $4,710, and after a breakout, aiming for $4,730; set stop-loss below $4,655, with position not exceeding 10% of total capital.
Key Points for Position Management:
Total position should not exceed 30% of funds, avoid high-leverage operations, and reduce risks brought by market volatility; if the gold price breaks below the strong support level of $4,650, directly abandon the long position strategy and shift to observing or following the trend to short; if the resistance level of $4,730 is broken, adjust the short strategy, focusing on the strong resistance at $4,770.
IV. Risk Warning: Beware of Three Major Risks and Prepare Response Plans
Currently, there are three major risk points in the gold market, and response plans should be prepared in advance:
Risk of Changes in Federal Reserve Policy Expectations: If subsequent U.S. inflation data continues to exceed expectations, the Federal Reserve's interest rate cut expectations may be further delayed, which could lead to continued strengthening of the dollar and U.S. Treasury yields, putting pressure on gold prices to fall rapidly.
Response Plan: Adjust stop-loss for short positions in a timely manner to avoid holding positions against the trend, and make decisive stop-loss exits if critical support levels are breached.
Risk of Sudden Escalation in Geopolitical Situations: If new conflict escalations occur in the Middle East, risk aversion could push gold prices to surge, breaking through current resistance levels and disrupting the weak oscillation pattern.
Response Plan: Set reasonable stop-losses, avoid blindly shorting, and pay attention to changes in news. If sudden news occurs, consider closing positions to observe, and wait for clarity before re-entering positions.
Risk of Liquidity Fluctuations: The gold market may experience severe volatility around the publication of key data, with high slippage risk, which can easily lead to ineffective stop-losses or profit reversals.
Response Plan: Reduce trading before the release of key data or lower leverage, avoid trading during periods of insufficient liquidity, and control the risk exposure of single trades.
The above article is from: Meridian Analysis. To learn more about cryptocurrency and foreign exchange information, scan the QR code to follow the public account and communicate with me. There may be delays in sending articles, and the content is for reference only. I have years of research experience in cryptocurrency and foreign exchange, and everyone is welcome to learn.
免责声明:本文章仅代表作者个人观点,不代表本平台的立场和观点。本文章仅供信息分享,不构成对任何人的任何投资建议。用户与作者之间的任何争议,与本平台无关。如网页中刊载的文章或图片涉及侵权,请提供相关的权利证明和身份证明发送邮件到support@aicoin.com,本平台相关工作人员将会进行核查。