Fifty-three years ago, Federal Reserve Chairman Burns characterized the oil price shock as an "exogenous variable," after which inflation spiraled out of control for seven years.
Written by: Wall Street Insight Research Team
Source: Wall Street Insight
"This is an exogenous shock, and monetary policy does not need to overreact."
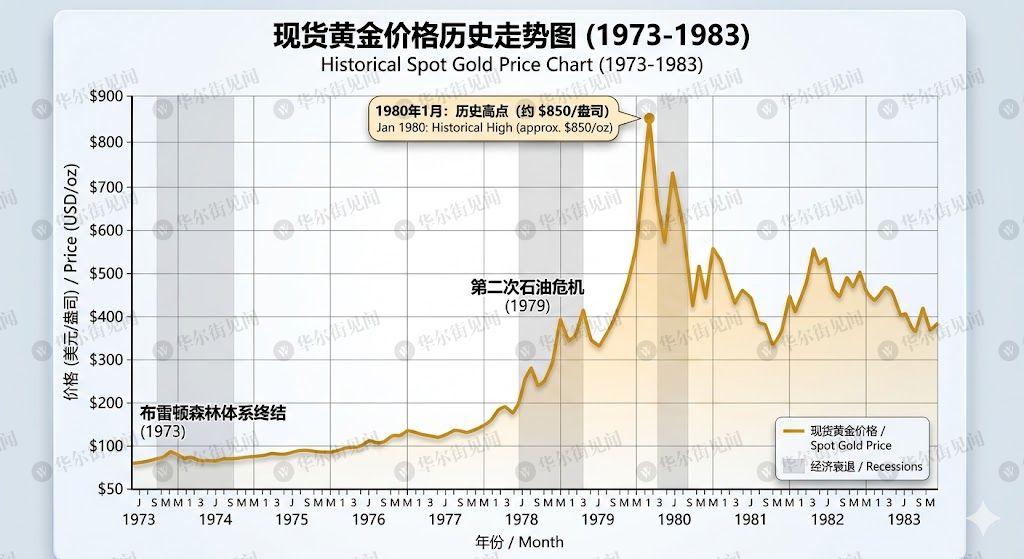
After the oil price shock in 1973, Federal Reserve Chairman Burns made this statement in Congress. Subsequently, inflation continued to spiral out of control, and the U.S. economy experienced the longest profit margin compression in history over the next seven years, with the real value of long-term government bonds drastically declining and gold rising from $35 per ounce to $850.
Fifty-three years later, newly appointed Federal Reserve Chairman Waller described the current situation using a nearly identical logical framework: the oil price shock belongs to exogenous variables, AI productivity provides a new buffer, and monetary policy does not need to respond aggressively.
Between these two statements lies an entire generation's investment lessons. April's CPI year-on-year expectation has reached 3.7%, WTI crude oil is above $100 per barrel, and non-farm employment has begun to weaken. The asset playbook from the 1970s—long positions in gold and physical assets, shortening bond durations, and avoiding broad equities—is being reconsidered by more and more institutions.
The pressing question today is how much of this playbook holds, what has already been priced in by the market, and what truly represents the allocation opportunities.
Three Conditions Met, the Analogy of 1973 Cannot Be Ignored
The energy shock driven by the Middle East war, inflation exceeding target levels, and simultaneous economic slowdown—these three conditions are simultaneously present today.
The blockade of the Strait of Hormuz is the physical source of this round of energy shocks. Currently, the daily number of transiting vessels has plummeted from about 70 before the conflict to only 2 to 5, accumulating a supply gap at a pace of about 10 million barrels per week, totaling approximately 880 million barrels so far. Trump recently rejected Iran's phased negotiation framework, calling the plan "completely unacceptable," and ceasefire negotiations are at an impasse, with increasing uncertainty regarding the duration of the blockade.
Regarding inflation, U.S. CPI accelerated from 2.4% in February to 3.3% in March, with April expected to rise further to 3.7% to 3.8%. The month-on-month pace has continued the strong momentum from March, with the energy component contributing significantly to the increase. The federal funds rate ceiling remains at 3.75%, with only one rate cut forecasted for the year, and real interest rates are close to zero.
The analogy to 1973 appears quite precise in numerical terms, with several institutions recently comparing the two periods side by side. However, the analogy itself does not tell you how to allocate assets—it simply provides a historical reference point. The real question is how similar today's structure is to that of fifty years ago, and what fundamental differences exist.
Three Differences Determine Today's Boundaries
Below the similar surface, three structural differences fundamentally limit the transmission path for a complete stagflation like that of the 1970s.
The United States is now the world's largest oil producer.
The oil price shock of 1973 affected an industrial economy that was entirely dependent on imported oil, and the supply break directly undermined the entire production base. Today, U.S. domestic production can hedge a significant external supply gap, and the direct impact of the Hormuz blockade on the U.S. economy is far less than its impact on Japan, South Korea, or Europe.
The wage-price spiral mechanism no longer exists.
The reason inflation in the 1970s could persistently reinforce itself was the presence of strong union coverage and automatic wage indexing arrangements—wages adjusted automatically with prices, raising costs, which in turn pushed prices higher, creating a closed loop. Today, the proportion of labor compensation in U.S. GDP is at a historical low, and union organization rates continue to decline, closing this dangerous transmission door.
Corporate profit margins are not at historical lows but at historical highs.
The S&P 500's net profit margin in the first quarter was 14.7%, the highest on record according to FactSet; the first-quarter profit growth rate was 27.1%, with 84% of companies exceeding expectations. The core damage path of stagflation in the 1970s—inflation eroding profit margins → declining margins triggering layoffs → layoffs suppressing consumption → consumption further compressing profit margins—has not yet initiated.
Together, these three differences determine that the current scenario aligns more closely with "differentiated war inflation" rather than a complete replication of the 1970s: macro-level shocks genuinely exist, but the core mechanisms driving uncontrolled inflation are not fully present.
AI Economic Moats Only Cover a Few Companies
However, the aforementioned three differences do not mean that the 1970s asset playbook has completely failed. A critical internal differentiation is being obscured by the aggregate figures in the market.
The 14.7% profit margin in the first quarter is highly concentrated within a few companies. The four major cloud providers—Google, Amazon, Microsoft, and Meta—have a combined capital expenditure budget of $725 billion for 2026, a 77% increase year-on-year, and their profitability essentially supports the entire index's profit margin ceiling.
If these companies are excluded, industries directly sensitive to energy costs, like airlines, logistics, retail, and dining, are facing entirely different profit pressures.
New Federal Reserve Chairman Waller suggested at the hearing that AI-driven productivity increases could support a relatively loose monetary policy stance.
This judgment is supported by data at the level of mega tech companies, but historical diffusion of technology tells us that both electricity and the Internet took over fifteen years to systematically transform broad economic productivity. The current energy cost shock and the stickiness of core inflation are acting on broad enterprises within a time window that significantly misaligns with the time window for the full diffusion of AI productivity.
If today's CPI falls as expected within the range of 3.7% to 3.8%, and the core components maintain a month-on-month increase of 0.3%, Waller will face his first inflation report since taking office: persistent inflation, with core stickiness not diminishing, and a federal funds rate of 3.75% corresponding to an inflation rate of 3.7%, with real interest rates close to zero.
His subsequent policy orientation—whether to stick to the "AI productivity supports low rates" framework, or to shift towards a more traditional data-driven path—is the single variable worth closely observing in the current macro landscape.
Long Bonds: Lessons from Fifty Years Ago Are Still Earning Interest
In the 1970s, holding long-term government bonds was the costliest allocation choice.
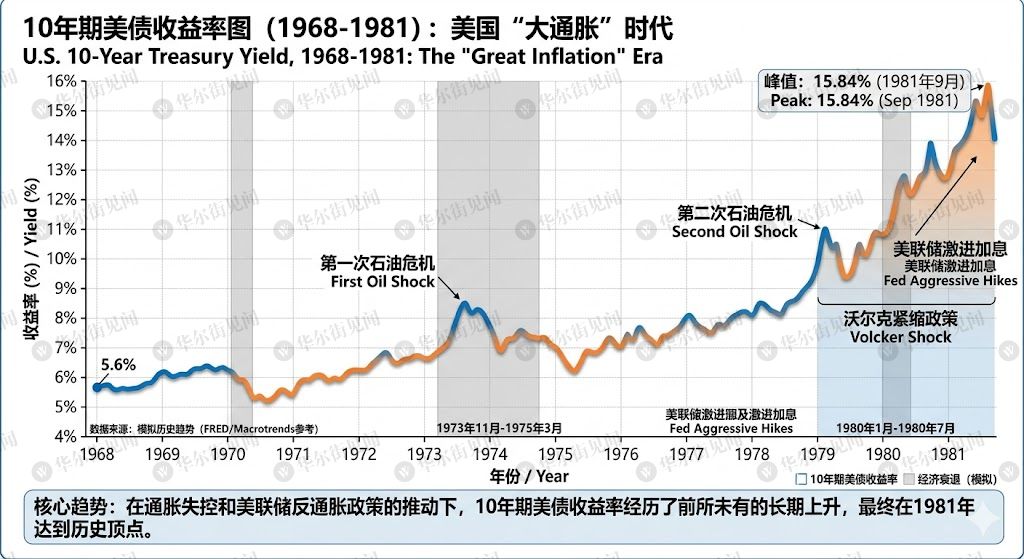
Inflation continued to erode the purchasing power of fixed coupon payments, and as real interest rates rose, bond prices simultaneously declined—the yield on 10-year U.S. Treasuries rose from 5.65% in 1968 to 13.92% in 1981, resulting in a continuous loss of real wealth for investors holding long bonds throughout this period.
The logical chain today aligns closely with this.
The current yield on 10-year U.S. Treasuries stands at 4.24%, and 30-year at 4.87%, with the yield curve showing a bear steepening shape, and the rise on the long end outpacing the short end.
In March of this year, the 30-year yield tested the 5% level, and the scenario described by the market at that time was termed a "policy trap": the Federal Reserve was constrained by inflation from cutting rates, while the simultaneous economic slowdown elevated the term premium required by long-end investors.
This pressure structure is even clearer today than it was in March. Inflation is relatively high compared to nominal interest rates, and the long end has yet to fully price in the scenario of sustained inflation exceeding expectations; the steepening trend of the curve is still in play.
This judgment has a failure condition: if Waller is forced to rapidly turn hawkish and significantly raise rates to suppress inflation, long-term real interest rates will spike, providing a temporary breathing space for bond prices. However, Waller's public framework currently points in the completely opposite direction.
Gold: The Bet is Not on Inflation, but on Waller
Gold is the most well-known winner in the 1970s playbook. But today, it is also the asset that most needs to reevaluate its incremental space.
The current price of $4,672 per ounce has already exceeded the inflation-adjusted historical peak of January 1980. This means gold's current pricing has embedded a significant degree of inflation and geopolitical risk premium, and it is not an unused wild card.
The core condition for opening its incremental space is no longer "higher inflation," but rather depends on Waller's policy path choice.
If he is forced to abandon the "AI productivity framework" and shift towards hawkish rate hikes, real interest rates will rise significantly, which would suppress gold; if he maintains a dovish stance, gold may hold its high level, but the marginal pushing force will be limited. Today, being long on gold is a directional bet on the monetary policy path, not on the direction of inflation itself.
Energy Bulls: Inflation Hedge or Geopolitical Bet?
Energy commodities were the core asset for hedging stagflation in the 1970s.
Supply-side political contraction, rising oil prices, and direct benefits to producers—the logical chain is complete. Today, crude oil is above $100, and the energy sector is one of the strongest performers in the S&P 500 this year.
However, today's drivers of oil prices differ fundamentally from those in the 1970s: it is not driven by supply-side economic interests leading to active production cuts but by the blockade of the Strait of Hormuz amid a state of war—a geopolitical variable that can quickly reverse as negotiations progress.
The CEO of Saudi Aramco recently stated that even if the Strait of Hormuz reopens today, oil market normalization would have to wait until 2027 due to the time required for inventory rebuilding and contract renegotiations.
This is a physical repair timeline, not a price adjustment timeline. Price revaluation will precede physical repair—once a ceasefire shows substantial breakthroughs, the market will preemptively digest reconciliation expectations, and oil prices will quickly fall, thereby nullifying the current logic support for energy bulls.
Holding energy bulls as an inflation hedge implicitly assumes that ceasefire negotiations remain stalled. This can be an independent investment judgment, but it belongs to a different risk dimension than inflation hedging and needs to be assessed separately.
U.S. Stocks: The Pressure Has Not Yet Arrived, but the Path is Clear
The current pricing of broad equities is predicated on the assumption that "AI economic moats are wide enough," and the first-quarter profit data supports this premise.
However, the first-quarter data reflects corporate states before the full transmission of the oil price shock. Industries facing rising energy costs, such as airlines, casual dining, and discretionary spending, will experience synchronous contractions in demand if inflation remains above 3.5%—adjustments in expenditure when consumers' real purchasing power declines will first impact energy-sensitive sectors, not the mega tech companies.
The true signal for activating the stagflation spiral of the 1970s was the systematic decline of broad profit margins from peak levels. Currently, this indicator remains at historical highs, but the second-quarter profit data, to be announced at the end of July, will serve as a critical time window to determine whether broad profit margins have begun to turn. Until then, the allocation logic for broad equities remains relatively intact, but the downward risk path has become clear.
What to Watch Next
Waller's public statements following today's CPI announcement will be the most direct market signal in the short term.
If he maintains the stance of "AI productivity supports easing," long bond yields will be under pressure and the steepening of the curve will be temporarily halted; if his tone shifts hawkishly, the 30-year yield will retest above 5%. The dot plot from the June FOMC meeting will be the first systematic opportunity to present a forecast of policy paths during Waller's term.
The Hormuz negotiations are the variable with the greatest influence and the most unpredictable in the entire macro story. The second-quarter earnings season at the end of July is a key data window to determine whether "differentiated war inflation" further evolves into complete stagflation. At that time, the actual erosion of broad corporate profits due to rising energy costs and sticky inflation will be fully reflected in the financial report figures for the first time.
The heaviest part of the history in the 1970s lies not in how much oil prices rose but in how long the error of policy judgment lasted: from Burns' initial misjudgment in 1973, to Volcker's takeover in 1979, enforcing a harsh conclusion with significant rate hikes, the cost being a deep recession from 1980 to 1982, separated by a full six years.
免责声明:本文章仅代表作者个人观点,不代表本平台的立场和观点。本文章仅供信息分享,不构成对任何人的任何投资建议。用户与作者之间的任何争议,与本平台无关。如网页中刊载的文章或图片涉及侵权,请提供相关的权利证明和身份证明发送邮件到support@aicoin.com,本平台相关工作人员将会进行核查。


