Author: Claude, Deep Tide TechFlow
Deep Tide Guide: CryptoQuant’s Bull-Bear Market Cycle Indicator has turned positive for the first time since October 2025, while another core indicator, the Bull Score Index, rose to a neutral range of 50 in late April. Bitcoin has seen three consecutive months of gains, rebounding from a low in February of about $60,000 to above $81,000. However, the lessons from 2022 remind the market: similar signals failed just a week later, and the price continued to plummet.
On-chain data for Bitcoin is releasing a long-awaited positive signal.
According to data from the CryptoQuant platform, its Bull-Bear Market Cycle Indicator has recently returned to positive territory, the first time since the P&L index fell below the 365-day moving average in October 2025.
This indicator assesses whether Bitcoin is currently in a bull or bear market cycle by measuring the distance between the P&L index and its 365-day moving average. The P&L index itself integrates three core on-chain indicators: the MVRV ratio, NUPL, and the SOPR of long- and short-term holders, serving as CryptoQuant’s unified valuation tool for assessing whether Bitcoin's price is overvalued or undervalued.
As of the time of writing, Bitcoin is priced at approximately $81,000, having rebounded more than 35% from the cycle low of about $60,000 in early February.
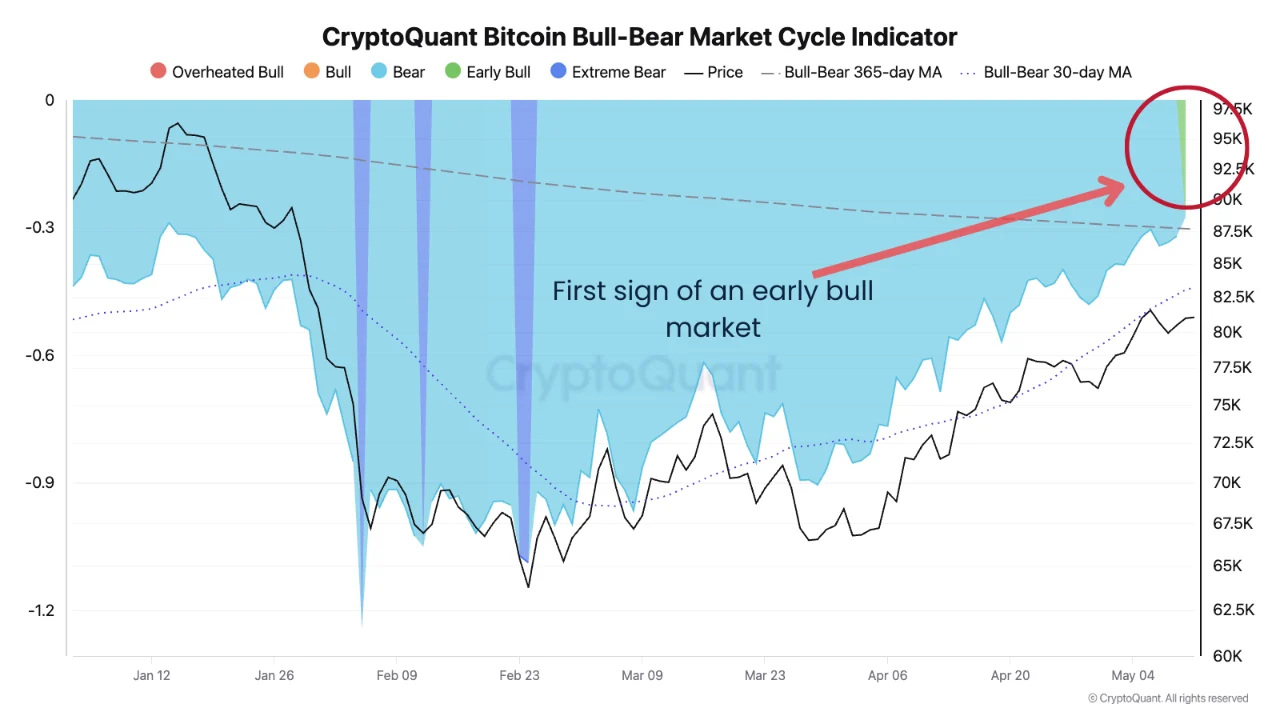
Image source: CryptoQuant, original post analyst MorenoDV_
From Deep Bear to First Positive Turn, On-Chain Repair Took 7 Months
Looking back at the on-chain trajectory of this bear market: after Bitcoin plummeted from a historical high of $126,000 in October 2025, the Bull-Bear Market Cycle Indicator quickly fell into negative territory. According to a report by Cryptonomist in February this year, the indicator fell to about -1.2 at the beginning of February, equivalent to the low during the COVID crash in March 2020. CryptBull's concurrent report also confirmed that the indicator reading reached the lowest level since the FTX collapse in 2022.
From the deep bear bottom in February to the recent positive turn, the repair process took about three months. This speed is faster than in the 2022 cycle (when the indicator stayed in the negative range for about 12 months), but considering the approximately 55% decline from peak to trough in this cycle (from $126,000 to less than $60,000), whether the repair is sustainable remains disputed.
Bull Score Index Synchronizes to Neutral, Multiple Indicators Resonating
The positive turn of the Bull-Bear Cycle Indicator is not an isolated event.
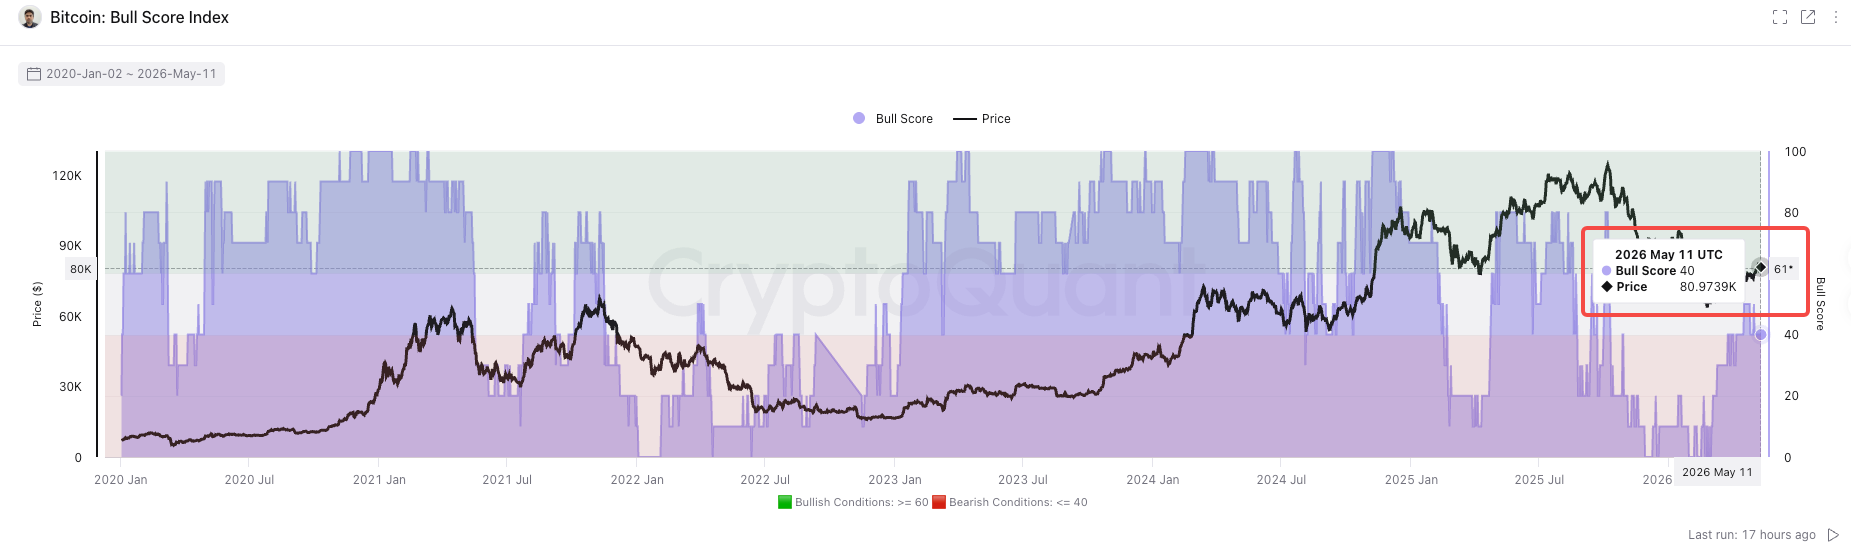
According to CoinDesk’s report on April 23, CryptoQuant's other core indicator, the Bull Score Index, has risen to a neutral reading of 50 during the same period, marking the first time since Bitcoin began its decline from its peak of $126,000.
The Bull Score Index integrates 10 on-chain indicators, covering dimensions such as blockchain activity, investor profitability, and liquidity. A reading below 40 typically indicates a structural bear market, while above 60 points to a strong sustainable upward trend.
CryptoQuant’s research director, Julio Moreno, commented that this is the first time during this bear market that the Bull Score Index has entered neutral territory. However, he also referenced the precedent from March 2022: at that time, the index similarly briefly rose to 50, but only maintained it for about a week, after which prices continued to fall significantly.
Improvements in price levels are also evident. Bitcoin has gained about 2% and 12% in March and April, respectively, and has increased about 6% so far in May, recording positive gains for three consecutive months.
2022 "False Signal" Cautionary Tale: History Doesn’t Always Repeat, But the Market Remembers
The biggest doubt about the current positive signals in the market stems from the historical lessons of 2022.
In March of that year, the Bull Score Index briefly rose to the neutral range of 50, and Bitcoin subsequently plummeted from about $47,000 to $16,000. The Bull-Bear Market Cycle Indicator also experienced a brief positive turn in 2022, but ultimately continued to decline under the impact of the subsequent collapses of Luna/UST and FTX.
However, this cycle has structural differences compared to 2022. Spot Bitcoin ETFs have become an important anchor for institutional demand since their listing in January 2024. According to a report by SpotedCrypto, in April, the net inflow into Bitcoin spot ETFs reached $2.44 billion, the strongest month since October 2025. Glassnode data shows that the number of whale addresses holding over 1,000 Bitcoins has increased by 142 in the past six months. Additionally, Glassnode’s RHODL ratio is currently at 4.5, the third highest reading in Bitcoin's history, with the previous two similar high points occurring at the cycle bottoms in 2015 and 2022, both followed by sustained bull markets.
Matt Weller, global research director at StoneX, provided a more cautious reference framework in the Q2 outlook.
Based on Bitcoin's four-year halving cycle, the durable bottom in this cycle may not appear until around the fourth quarter of 2026. If historical patterns hold, the decline from peak to bottom is about 60%, corresponding to a price of approximately $50,000.
For traders, the real meaning of the current signal may be:
The most panicked phase may be over, but it is still too early to declare the start of a new bull market. Bitcoin needs to break through the 200-day moving average resistance above $82,000 and hold above it for a more persuasive trend reversal confirmation from the technical perspective.
免责声明:本文章仅代表作者个人观点,不代表本平台的立场和观点。本文章仅供信息分享,不构成对任何人的任何投资建议。用户与作者之间的任何争议,与本平台无关。如网页中刊载的文章或图片涉及侵权,请提供相关的权利证明和身份证明发送邮件到support@aicoin.com,本平台相关工作人员将会进行核查。


