News Analysis
Macro Liquidity (Neutral): The market is digesting yesterday's correction sentiment. Investors are focused on the upcoming non-farm payroll revised figures, with market expectations that liquidity will remain tight, lacking strong upward momentum in the short term.
Large Holder Movements (Bullish): Monitoring shows that some long-term holding addresses have made small-scale accumulation actions in the 2260-2270 range over the past 12 hours, forming some buying support.
On-chain Activity (Bearish): Ethereum network gas fees continue to be sluggish, and the activity level of decentralized applications has decreased, indicating reduced speculative enthusiasm in the short term.
Technical Analysis
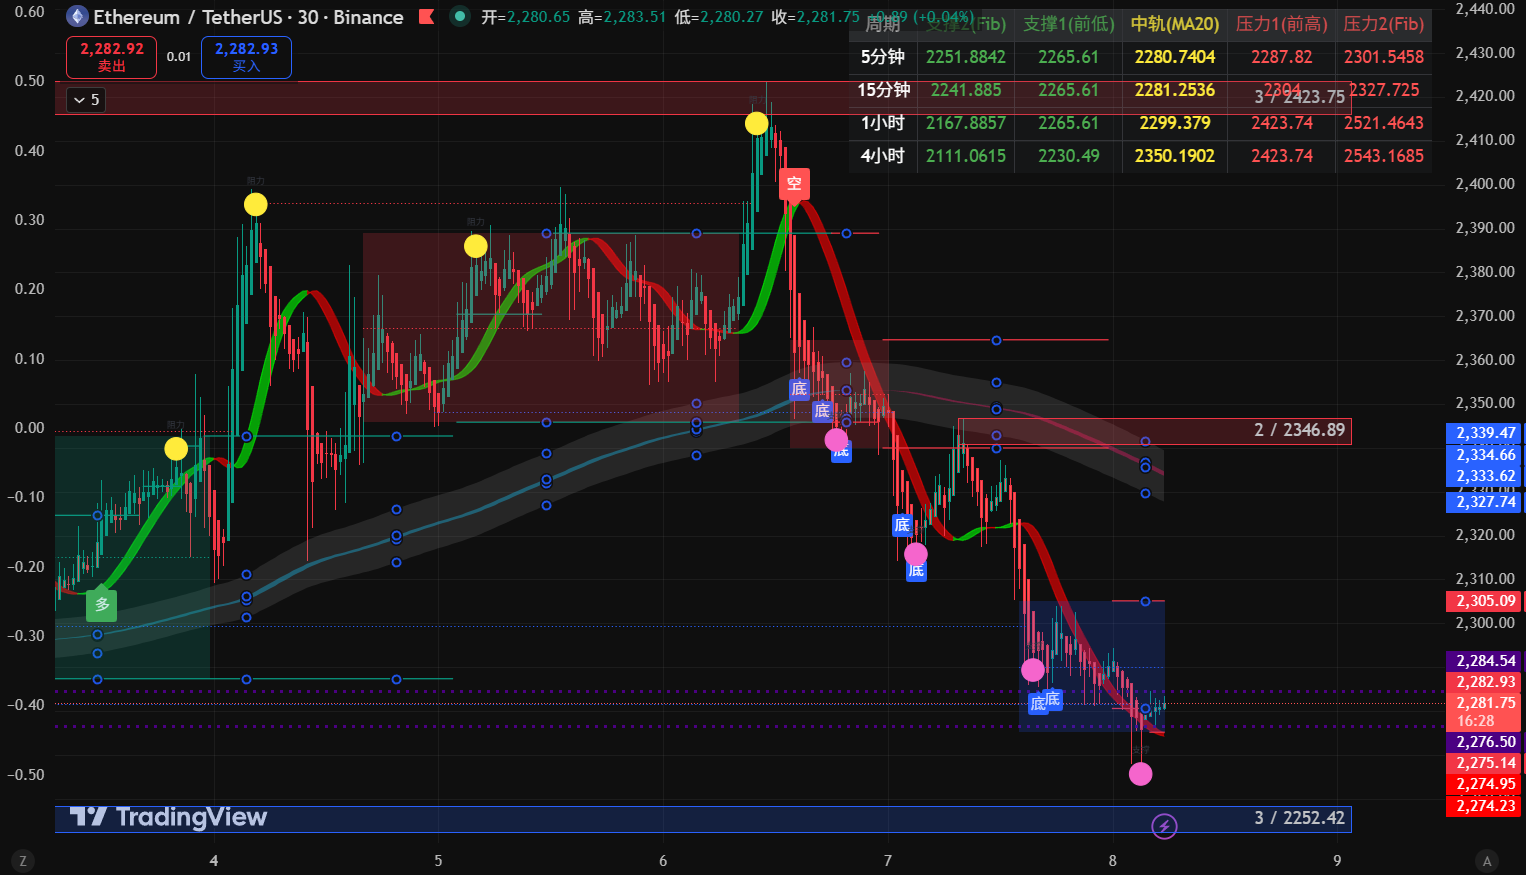
Current Price: 2280 (Slightly rose by 0.08%).
Moving Average System (MA): The 30-minute level MA5 (2279) and MA10 (2279) are basically flat, showing a Sideways Trend.
The price remains far below MA5 2230, indicating that the Medium-term Bearish Trend is not yet reversed, with significant pressure from above.
Shape Indicators:
Support Level: Strong support at today's low of 2265; if it breaks, it will test 2230.
Resistance Level: Short-term resistance at 2300 (round number and MA52 pressure), strong resistance at 2350.
TD Indicator: The chart shows a "TD 9" bottom signal triggered around 2263; currently in a rebound repair phase, but trading volume has not increased, limiting the height of the rebound.
3. Operational Direction
Aggressive Strategy (Buy Low, Sell High):
Entry: Light position in the 2265 - 2275 range to try long.
Take Profit: Reduce position near 2300; if stable, look at 2325.
Stop Loss: Below 2255.
Conservative Strategy (Right Side Trading):
Wait for the price to effectively break and stabilize above 2310 (that is, break the MA52 pressure level) before entering a long position, targeting a return to 2350.
Position Management: In a volatile market, it is recommended to keep positions controlled at 7%-15%, focusing on very short-term quick in and out.
4. Risk Warning
Downside Break Risk: Frequent testing of 2263 without rebounding is a dangerous signal. If it falls below this level with increased volume, it could lead to panic selling.
False Bullish Risk: Watch for false breaks near 2300. If the price touches 2300 and quickly retraces with reduced volume, it indicates heavy selling pressure from above.
Response Plan: If it falls below 2260, all long positions must immediately exit to stop losses and switch to a defensive wait-and-see mode.

免责声明:本文章仅代表作者个人观点,不代表本平台的立场和观点。本文章仅供信息分享,不构成对任何人的任何投资建议。用户与作者之间的任何争议,与本平台无关。如网页中刊载的文章或图片涉及侵权,请提供相关的权利证明和身份证明发送邮件到support@aicoin.com,本平台相关工作人员将会进行核查。