In technical analysis, the bearish engulfing is a highly recognizable and practical classictop reversal pattern, serving as a core reference signal for short-term swings and medium to long-term turning points. Many novice traders frequently incur losses, as they only mechanically compare patterns, failing to understand the underlying capital and emotional games, blindly operating based on surface signals. This article combines practical experience to simplify and break down the formation logic, core characteristics, and usage of the bearish engulfing, helping everyone avoid common trading pitfalls.
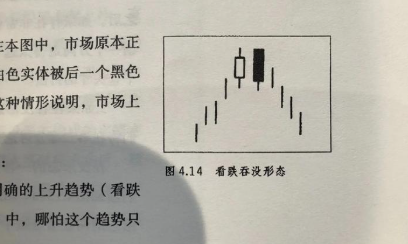
To effectively utilize this pattern, one must first comprehend its formation logic. In a rising market, bullish sentiment is high, with capital continuously entering the market, causing prices to steadily rise. However, when the market reaches thekey resistance level, bullish momentum gradually exhausts, and the buying pressure diminishes, leading to an inability to push prices higher. At this moment, bearish capital concentrates its efforts, driving prices down and producing a large, full-bodied bearish candle that completely covers the range of several small bullish candles from earlier, thus forming the bearish engulfing pattern.
In simple terms, this large bearish candle engulfs all previous bullish gains, indicating that the bullish advance has completely failed, with bears taking control of the market. This is a key turning point signal for a market reversal from bullish to bearish.
An effective bearish engulfing must meet two core conditions, both of which are essential. First is the location; the pattern must appear at the end of an uptrend or a key resistance level. An engulfing pattern formed during a downtrend is merely a signal of consolidation and holds no reversal value, which is a common mistake among novices. Second is the structure; the previous candle must be a small-bodied bullish candle, indicating waning bullish strength, while the subsequent bearish candle must have a full body, opening above the previous bullish candle's closing price and closing below the previous bullish candle's opening price, completely engulfing the previous bullish candle's body.
In practical scenarios, there is no need to fixate on the length of shadows; the core focus is whether the bullish candle's body is completely engulfed. The fuller the bearish candle's body and the more bullish candles it engulfs, the heavier the bearish selling pressure, and the higher the validity of the pattern, leading to stronger continuity in the subsequent decline.
Most people fail to utilize this pattern correctly, primarily due to blindly trading based on a single signal, while a single candle inevitably presents false signals. It is necessary to integrate location and trading volume for a comprehensive judgment. An engulfing pattern formed at previous highs,trend resistance lines, and other key resistance levels significantly increases the win rate. If the pattern forms with a concomitant increase in trading volume, it indicates that bearish selling pressure is concentrated and released, enhancing the reliability of the signal.
The time frame directly determines the signal's value. A bearish engulfing on daily or four-hour charts represents a high-level reversal signal and often initiates sustained downward swings, making it suitable for medium to long-term strategies. Patterns on smaller time frames like hourly or fifteen-minute charts can only predict minor short-term pullbacks and are only applicable for ultra-short-term trading; they cannot serve as a basis for trend reversals.
There are two major misconceptions in practice that must be avoided. First, never chase trades on seeing a pattern; after the pattern forms, it is often followed by small rebounds, and chasing trades can lead to pullbacks and passive positions. The optimal approach is to wait for confirmation of selling pressure after a rebound before entering to optimize therisk-reward ratio. Second, ignoring the overall trend: engulfing patterns appearing during a downtrend are often just short-termconsolidation repairs, and entering blindly will only lead to frequent stop losses.
The core of trading is to follow the market rhythm, not subjective predictions. The essence of the bearish engulfing is to capture the turning points of bullish and bearish forces. It is not an omnipotent signal, but by combining location, volume, and time frame for comprehensive filtering, one can eliminate ineffective noise and accurately capture downward swings, avoiding market pullbacks. Traders who master this pattern, discard subjective conjectures, and adhere to trend-following strategies can maintain a stable trading rhythm in a volatile market.
For more valuable content, please follow the public account: Big Bull Talks Market
This content is solely for exchanging views on market conditions and sharing personal review insights and does not constitute any investment advice.
免责声明:本文章仅代表作者个人观点,不代表本平台的立场和观点。本文章仅供信息分享,不构成对任何人的任何投资建议。用户与作者之间的任何争议,与本平台无关。如网页中刊载的文章或图片涉及侵权,请提供相关的权利证明和身份证明发送邮件到support@aicoin.com,本平台相关工作人员将会进行核查。