Dear friends, I am Sister Qinglan. Today, the news in the market is very lively, with two major events worth highlighting. First, the United States announced the end of its offensive against Iran, and Trump halted the "freedom plan" in the Strait of Hormuz, cooling geopolitical risks and easing risk-averse sentiments, which is clearly positive for risk assets like BTC. The other news is that a whale closed its BTC long position at $81,300, realizing a profit of over $5.21 million. Such large profit-taking often indicates short-term top pressure, increasing the risk of correction. With one bullish and one bearish factor, market sentiment is in a tug-of-war, and we must let the data speak for itself.
Current Price and Time
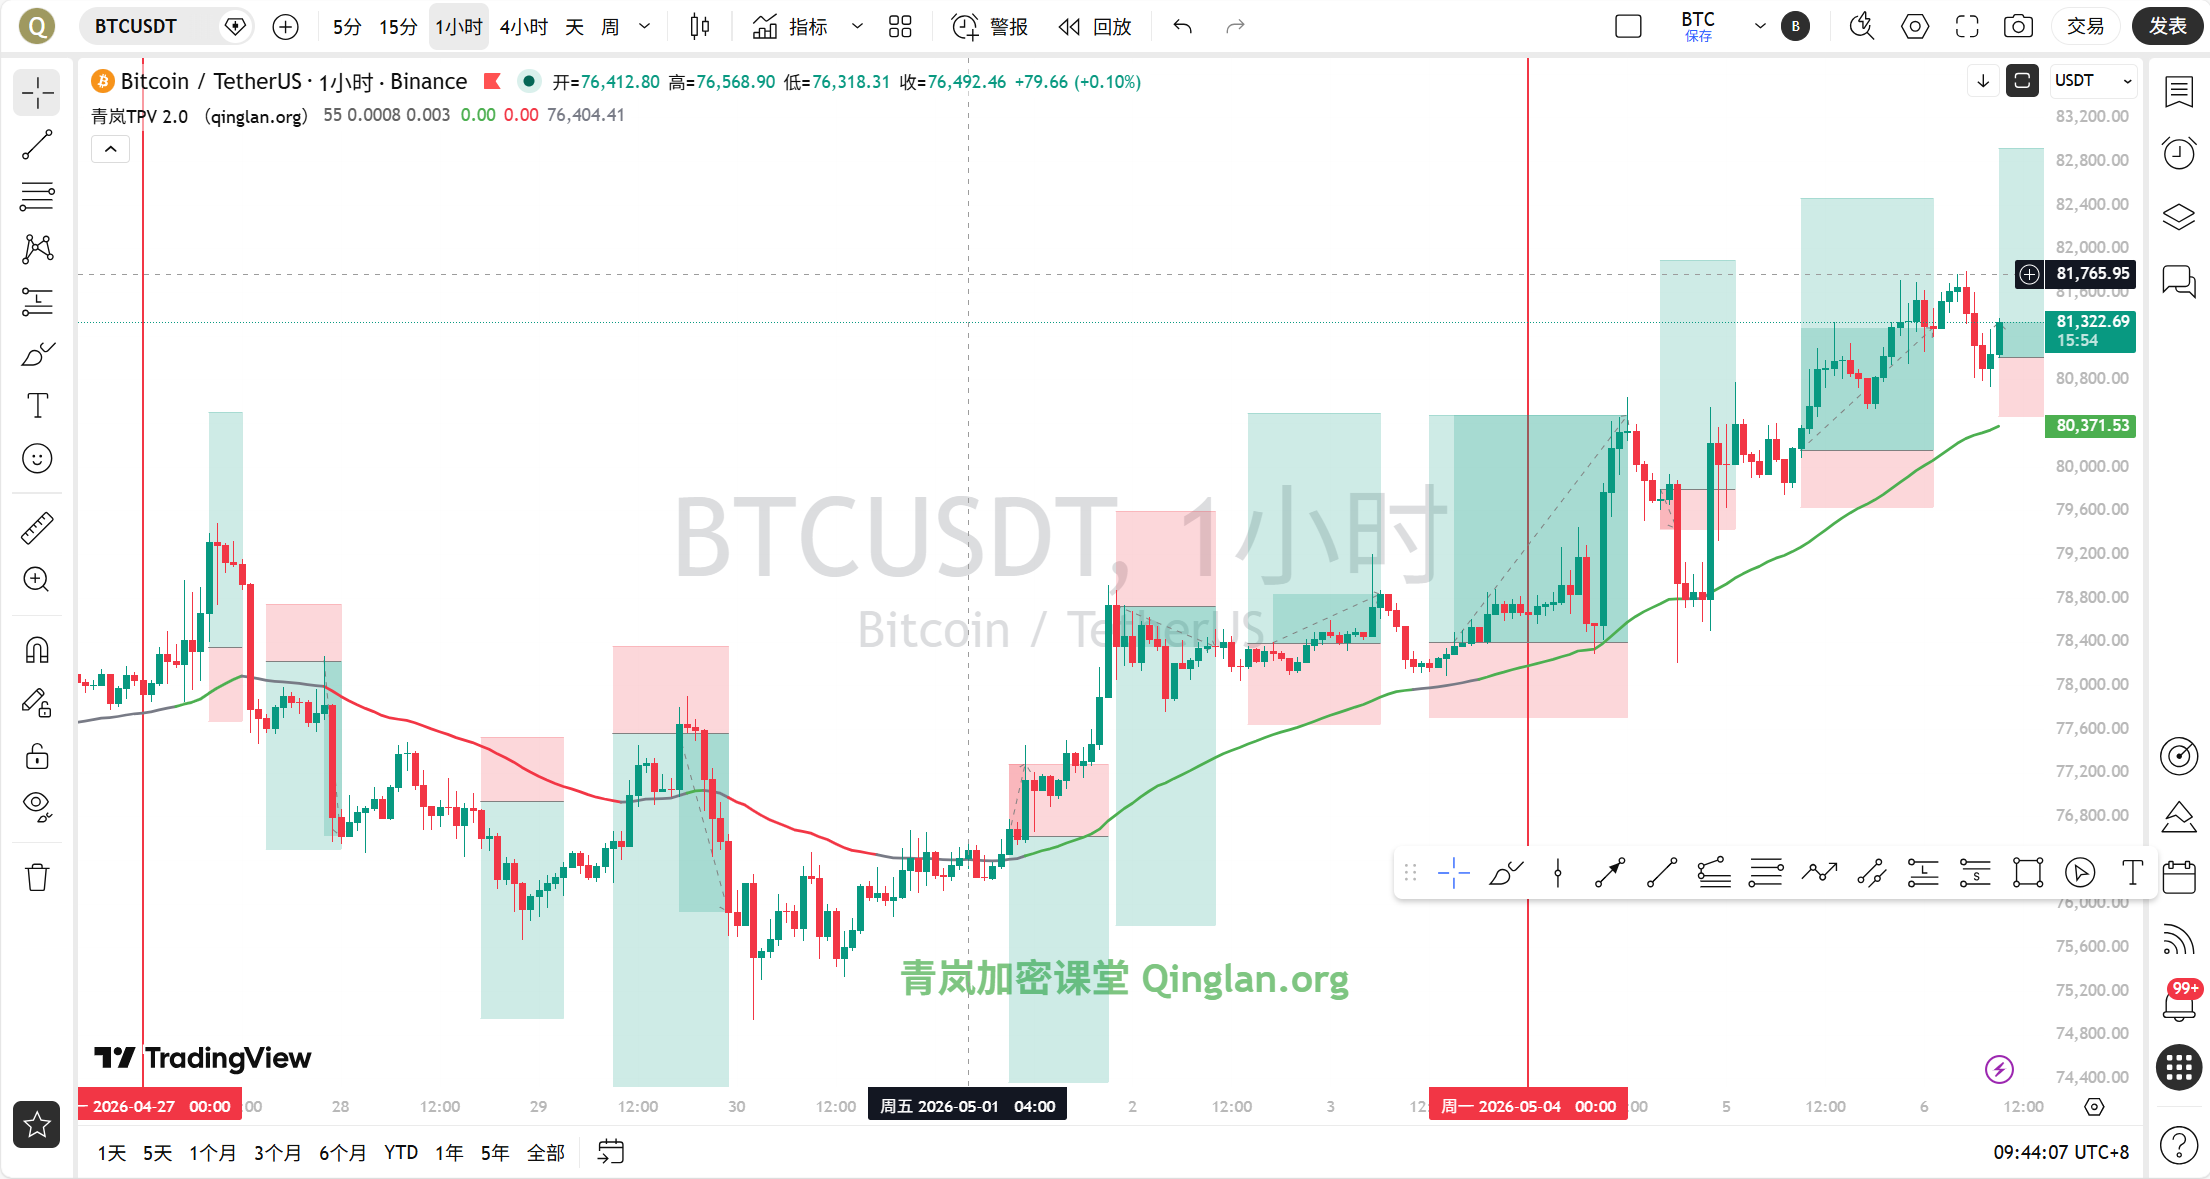
It is now May 6, 2026, 09:43, and the current price of BTC is 81,318 USDT. The 24-hour increase is 1.31%, and the fear and greed index is 50, indicating a neutral range. The market does not show extreme emotions, but the direction choice is imminent.
Overview of Multi-Cycle Status
First, looking at the daily chart, MA5=79,868, MA10=78,341, MA30=76,078, the price firmly stands above all moving averages, with a MACD histogram of 182.93, DIF above DEA, RSI=64.57, indicating a clear bullish trend, but RSI has not yet reached the overbought area, leaving room for upward movement.
At the 4-hour level, MA5=81,273, MA10=80,806, MA30=79,271, and the price is moving above the moving averages, with a MACD histogram of 99.52, DIF above DEA, RSI=66.30, indicating sustained bullish momentum. However, be cautious as RSI is nearing 70, and there may be short-term pressure.
At the 1-hour level, MA5=81,154, MA10=81,309, MA30=80,920, the price is below MA10 but above MA30, with a MACD histogram of -80.16, DIF below DEA, RSI=56.63, indicating short-term signs of a correction. However, EMA55=80,410, and the price is significantly above this, maintaining the support for bulls.
At the 15-minute level, MA5=81,133, MA10=81,046, MA30=81,326, the price is below MA30, with a MACD histogram of 20.67, DIF above DEA, RSI=48.38, indicating a weak short-term trend, but the MACD histogram has turned from negative to positive, showing signs of stabilization.
TPV Signal Verification
According to the Qinglan TPV system, we use the 1-hour EMA55=80,410 as the boundary line between long and short positions. The current price is 81,318, which is well above EMA55, indicating a bullish trend.
First, look at the supporting data for oscillation judgment. In the past 8 1-hour candlesticks, the closing price was above EMA55 in 8/8 occurrences, with 0 crossings, and the price is 1.13% away from EMA55, not meeting the oscillation threshold and is in a unidirectional trend, allowing for proactive long positions.
Long Position Condition Verification: First, the price stabilizes above the 1-hour EMA55; the closing price of 2 consecutive 1-hour candlesticks is above EMA55, and the current 8 candlesticks meet this, condition established. Second, support stabilizes; the current price oscillates in the 81,000-81,300 range, and there are signs of a bottom formation in the 15-minute level, but clearer rebound signals are needed, such as long lower shadows or increased volume on dips. Third, downward momentum diminishes; the 1-hour MACD histogram is negative, but have consecutive cycles shortened? From the data, the 1-hour MACD histogram is -80.16, what was the previous one? We cannot see historical data, but RSI=56.63, did it rebound from below 30? No, RSI is in a neutral zone, so the signal for diminishing momentum is unclear. Overall, some conditions for going long are met, but we need to wait for clearer stabilization signals.
Short Position Condition Verification: First, the price is under pressure below the 1-hour EMA55, and the current price is significantly above EMA55, so the condition is not established. Second, encountering resistance; the current price has significant whale pressure near 81,300, but no top formation has formed. Third, the rebound is weak, MACD histogram and RSI do not meet conditions. Therefore, the conditions for going short are not met.
The current TPV system indicates a bullish trend, but entry requires waiting for stabilization support and momentum exhaustion signals. If the price retests near EMA55 and shows a bottom formation, it is a good opportunity to go long.
Onchain/Funding Aspect
In terms of on-chain data, the fear and greed index is 50, neutral, showing the market sentiment is not extreme. BTC market share is 58.66%, showing that Bitcoin still holds a dominant position. In key news, whales took profits by closing BTC long positions at 81,300, a short-term pressure signal, but another whale added 307 BTC with 5x leverage after profiting from long positions 12 days ago, indicating that large funds are still bullish. Binance’s SAFU fund has an unrealized profit of $177 million in BTC holdings, boosting market confidence. Strategy's Q1 earnings report shows 818,000 BTC held but a net loss of $12.54 billion, with large unrealized losses potentially raising concerns about institutional holding risks. Overall, funding is intertwined with both long and short, but bullish factors are more prominent.
Key Offensive and Defensive Levels
Upper resistance level: 81,500-82,000, which is the whale closing area and near the 4-hour MA5; a breakthrough would look towards 83,000. Lower support level: 81,000, which is near the 15-minute MA10 and 1-hour MA5; if it falls below, watch for 80,400-80,500, which is in the 1-hour EMA55 area and the lifeline for bulls. If EMA55 is breached, the trend may turn bearish.
Trading Ideas
Direction: Cautiously go long, waiting for a stabilization after a pullback.
Entry Conditions: Price pulls back to the 81,000-81,100 range, showing a bottom formation at the 15-minute or 1-hour level, or a long lower shadow, and the MACD histogram shortens for 2 consecutive periods, with RSI recovering from a low. If the price directly breaks through 81,500 and stabilizes, one can also chase long, but the risk is higher.
Stop Loss Level: Falling below 80,800, which is below the 1-hour MA10, or more conservatively 80,400, which is below EMA55. It is recommended to choose based on personal risk preference.
Target Levels: First target 82,000, second target 83,000, third target 84,000. If the price is blocked near 81,500 and retreats, consider partial profit-taking.
If the price falls below 80,400, the trend turns bearish; one can consider shorting, with entry conditions being price under pressure below EMA55 and a top formation, aiming for 80,000-79,500.
Risk Warning
Geopolitical risks have eased, but whale profit-taking and institutional losses may trigger short-term corrections; pay attention to position management.
Follow Qinglan Crypto Classroom to seize more trading opportunities together! Welcome to visit the official website www.qinglan.org
📊 Qinglan TPV Trading Strategy Backtest Reference
🕒 Last Backtest Time 05-06 07:00:01
Total Analysis: 1330 Backtests: 1324 Accuracy Rate: 67.2% (890/1324)
免责声明:本文章仅代表作者个人观点,不代表本平台的立场和观点。本文章仅供信息分享,不构成对任何人的任何投资建议。用户与作者之间的任何争议,与本平台无关。如网页中刊载的文章或图片涉及侵权,请提供相关的权利证明和身份证明发送邮件到support@aicoin.com,本平台相关工作人员将会进行核查。