Tonight in the cryptocurrency market, there are two matters worthy of everyone’s attention. The first is that the U.S. Treasury Secretary announced the seizure of nearly $500 million in Iranian cryptocurrency assets, which has directly triggered market concerns over regulatory compliance risks, spreading short-term bearish sentiment. The second is that PayPal has upgraded its cryptocurrency business to one of its three core sectors, indicating that traditional financial giants are increasing their investments in cryptocurrency, which is a long-term positive signal. With one bearish and one bullish factor, market sentiment is swaying between the two, with BTC currently priced at 76571 USDT, and both bulls and bears are waiting for direction. As an analyst in the Qinglan cryptocurrency classroom, I suggest that in such a complex news environment, one should rely more on data and technical signals rather than emotional trading.
Current Price and Time
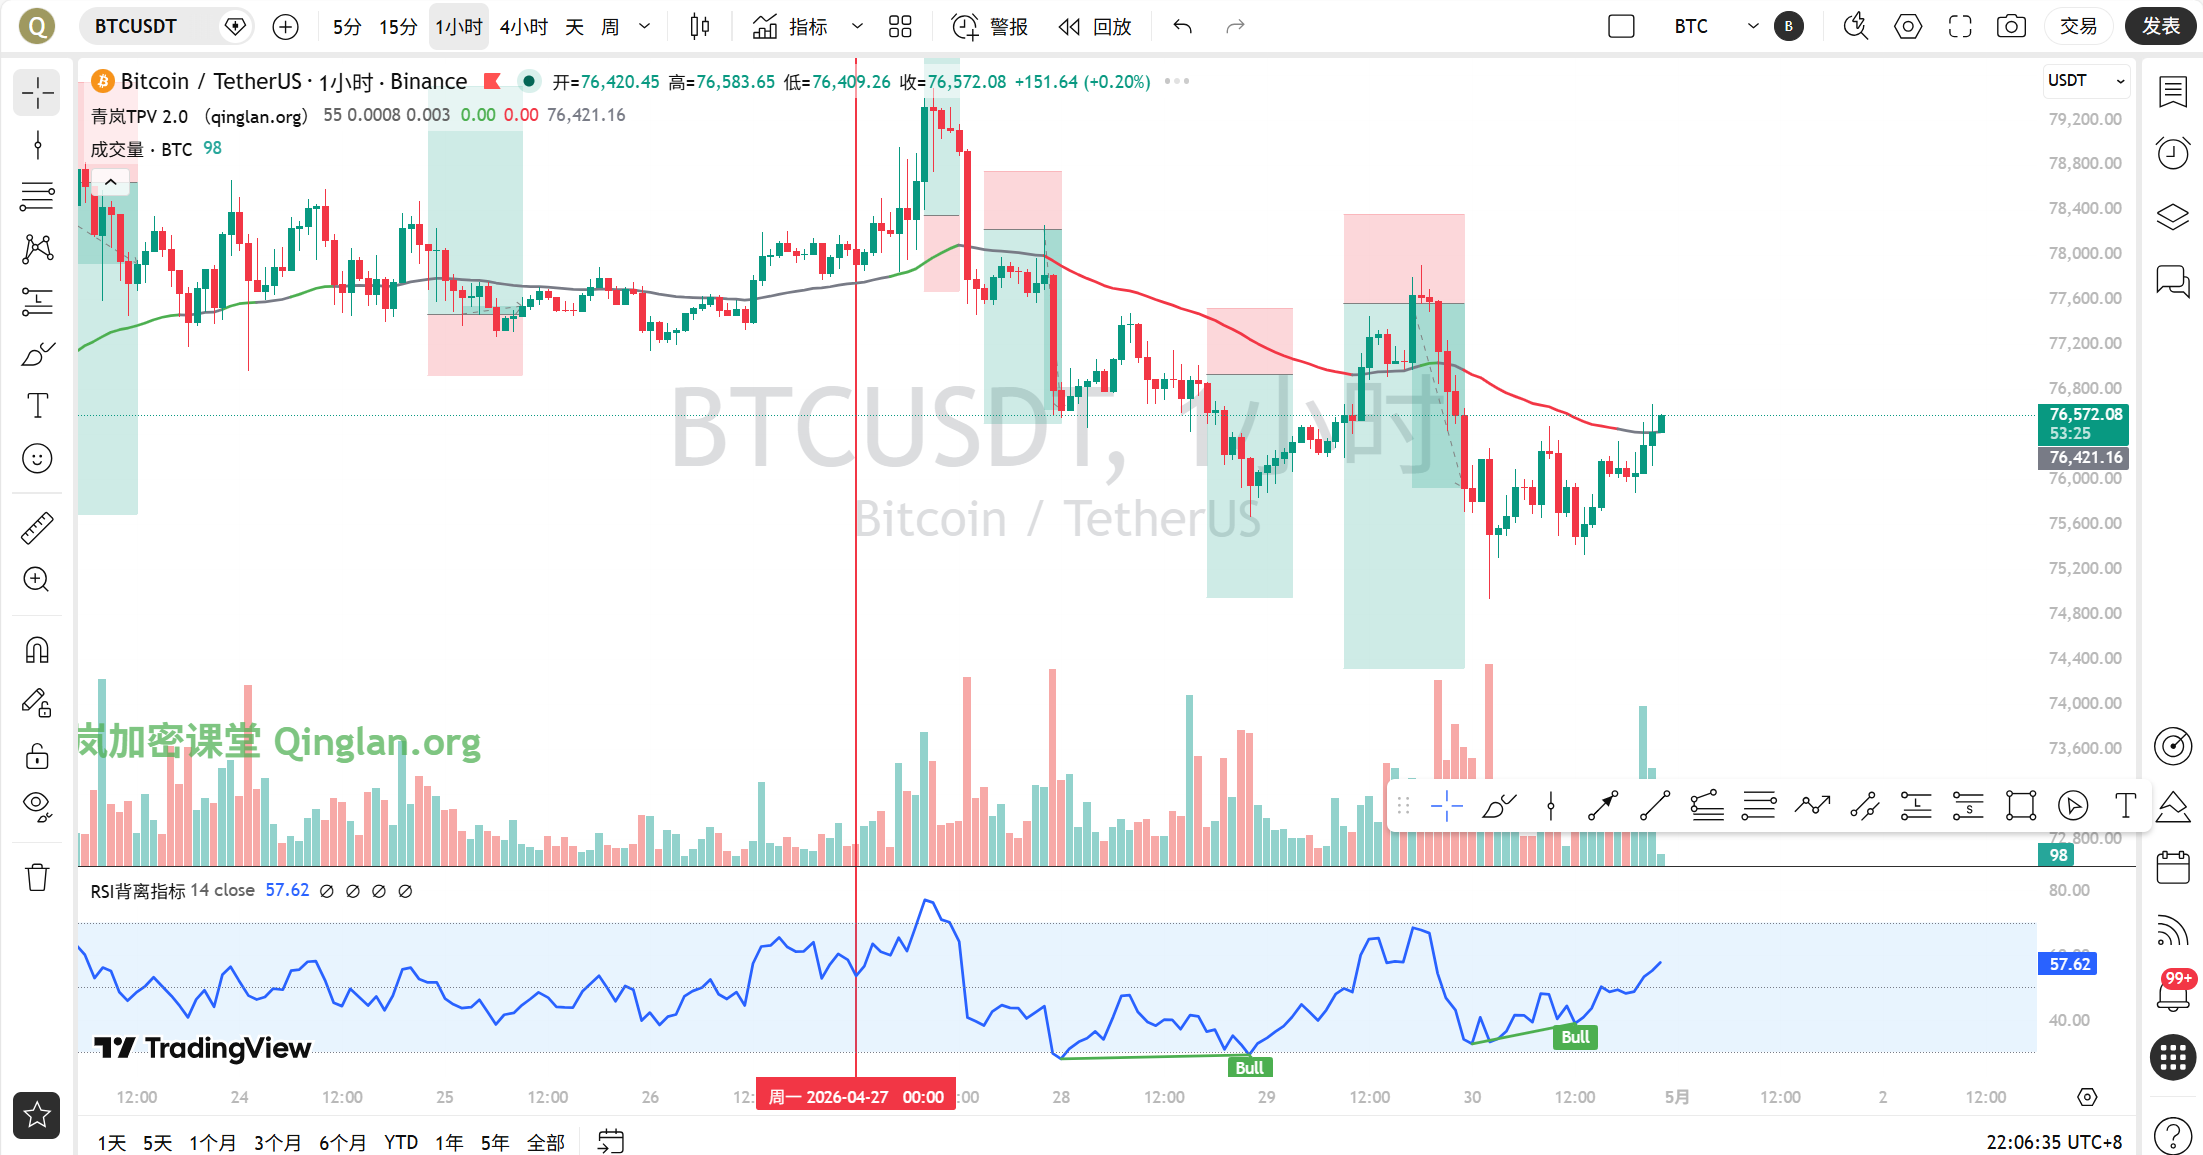
The current time is April 30th at 22:02, with the latest BTC price at 76571 USDT. The 24-hour decline is 0.15%, showing overall minor fluctuations, but the details of the market are worth deep analysis. The Fear and Greed Index is at 29, which is in the fear zone, indicating that retail investor sentiment is somewhat pessimistic, but often in such situations, major funds are more likely to accumulate at lower levels.
Multi-Period State Overview
First, looking at the daily chart. Daily MA5 = 76944.51, MA10 = 77255.66, MA30 = 73739.14, the price is currently below MA5 and MA10 but above MA30. The MACD histogram is -234.84, DIF = 1558.91, DEA = 1793.75, with DIF below DEA, indicating continuous bearish momentum. RSI = 54.61, in a neutral but weak zone. The daily chart presents a pullback pattern after high-level fluctuations, the bullish trend remains intact, but is under short-term pressure.
4-hour period. MA5 = 76100.03, MA10 = 76362.67, MA30 = 77045.87, the price is hovering between MA5 and MA10, below MA30. The MACD histogram is -12.17, DIF = -343.11, DEA = -330.95, with DIF below DEA, bearish momentum is weak but persists. RSI = 47.23, approaching the neutral line of 50, indicating a balance between bullish and bearish forces. The 4-hour period is in a sideways consolidation following a decline, with an unclear direction.
1-hour period. MA5 = 76277.59, MA10 = 76105.86, MA30 = 76210.88, the price is above MA5 but below MA30. EMA55 = 76396.42, the current price of 76571 is above EMA55, but the margin is only 0.23%, indicating line-bound fluctuations. MACD histogram is 104.03, DIF = -13.25, DEA = -117.28, with DIF above DEA, bullish momentum is starting to accumulate. RSI = 56.16, leaning towards bullish. The 1-hour period shows signs of a rebound, but the strength is limited.
15-minute period. MA5 = 76426.37, MA10 = 76324.56, MA30 = 76134.37, the price is above all three moving averages, indicating short-term strength. MACD histogram is 34.90, DIF = 138.66, DEA = 103.76, with DIF above DEA, bullish momentum continues. RSI = 64.11, approaching the overbought zone. The 15-minute period indicates short-term rebound momentum is decent, but caution is needed regarding a pullback after overbought conditions.
TPV Signal Verification
According to the Qinglan TPV system, we use the 1-hour EMA55 = 76396.42 as the dividing line between bullish and bearish. The current price of 76571 is above EMA55, but in the past 8 1-hour K-lines, the closing price was above EMA55 only 2 times, crossing it only once, and the absolute margin from EMA55 is 0.23%, less than 0.3%. This does not meet the fluctuation threshold, but belongs to line-bound fluctuations, increasing the probability of oscillation. Therefore, the current market is in the bullish trend zone, but the signal is weak, and a shift to oscillation cannot be ruled out.
Long Conditions Verification. First, the price stabilizes above the 1H EMA55, with two consecutive 1-hour K-lines closing above EMA55. Although the current price is above EMA55, the most recent K-line’s closing price has not yet been confirmed, and of the past 8 K-lines, only 2 closed above EMA55, so conditions are not fully met. Second, support stabilization, with a bottom formation indicated in the 15-minute period, but the 1-hour period has not shown a significant long lower shadow or strong volume decline. Third, bearish momentum is weakening, with the 1-hour MACD histogram shortening for 2 consecutive periods, and DIF crossing above DEA, with RSI rebounding from a low point, meeting the momentum condition. Overall, long conditions are partially met, but the first condition is not stable, and further confirmation is needed.
Short Conditions Verification. First, the price is under pressure below the 1H EMA55, and the current price is above EMA55, so the condition is not met. Second, the pressure has encountered resistance, with the 1-hour period not showing a top formation or long upper shadow. Third, the rebound is weak, with the MACD histogram expanding, and RSI rising, showing that rebound momentum has not weakened. Short conditions are completely unmet.
In summary, the current market is in the bullish trend zone, but the signal is weak, and line-bound fluctuations increase the probability of oscillation. The Qinglan TPV system recommends not to actively go long or short, but to wait for clearer signals.
On-Chain / Capital Analysis
In terms of on-chain data, the Fear and Greed Index is at 29, which is in the fear zone. Historical data shows that when the index is below 30, it often signifies a mid-term bottom zone, but it may continue to drop in the short term. BTC market share is 58.16%, which is at a high level, indicating that funds are still seeking refuge in BTC, while altcoin funds are flowing out. The number of first-time jobless claims in the U.S. hit a low of 189,000, a larger than expected decline, and strong employment data reduces the expectation of interest rate cuts, putting pressure on risky assets like BTC. Meanwhile, the Federal Reserve is divided, with Powell remaining as a board member, increasing policy uncertainty. These macro factors suppress the cryptocurrency market, but PayPal's positive news provides some support. The capital environment is generally bearish, but panic selling has not yet occurred.
Key Offensive and Defensive Levels
The first resistance level is near 1-hour EMA55 at 76396; if the price stabilizes and breaks through with volume, the next resistance level is at 4-hour MA30 = 77045. The first support level below is at 1-hour MA5 = 76277; if it breaks, the next support level is at 4-hour MA5 = 76100. If the price falls below 76000, it may test the daily MA30 = 73739. The current price is at 76571, positioned between support and resistance, making a direction choice imminent.
Trading Thoughts
Based on the Qinglan TPV system, the current market signals are weak, and line-bound fluctuations increase the probability of oscillation; it is recommended to adopt a wait-and-see approach awaiting clear signals. If trading must occur, please refer to the following thoughts.
Direction: Cautiously bullish, but confirmation is needed.
Entry Conditions: If the price retraces to around 1-hour EMA55 at 76396 and forms a bottom formation or a long lower shadow, while the 1-hour MACD histogram continues to shorten, a small position can be tried for going long. If the price directly increases in volume and breaks through 77000, it can be pursued long.
Stop Loss: The stop loss for long positions should be set below 76000; if the price drops below this level, the bullish trend will be invalidated.
Target Levels: First target is 77000, second target is 78000.
If the price falls below 76000 and increases in volume, consider trying a small short position, with a stop loss set above 76500, and a target level of 75000.
Risk Warning
The current market is in a period of contention between news and data, and line-bound fluctuations increase the risk of false breakouts; it is advisable to strictly control positions to avoid heavy trading.
To obtain accurate TPV entry points, follow the Qinglan cryptocurrency classroom at www.qinglan.org
📊 Qinglan TPV trading strategy backtest reference
🕒 Last backtest time 04-30 07:00:02
Total analysis: 1193 Backtests: 1187 Accuracy: 70.6% (838/1187)
免责声明:本文章仅代表作者个人观点,不代表本平台的立场和观点。本文章仅供信息分享,不构成对任何人的任何投资建议。用户与作者之间的任何争议,与本平台无关。如网页中刊载的文章或图片涉及侵权,请提供相关的权利证明和身份证明发送邮件到support@aicoin.com,本平台相关工作人员将会进行核查。