Key Comparison Table of the Last Three FOMC Meetings by the Federal Reserve
Comparison Dimension | February 2026 Meeting | March 2026 Meeting | April 2026 Meeting (Latest) |
|---|---|---|---|
Benchmark Interest Rate | Maintain 3.50%-3.75% | Maintain 3.50%-3.75% | Maintain 3.50%-3.75% |
Policy Tone | Neutral and Dovish | Neutral and Watchful | Clearly Turned Hawkish |
Inflation Statement | Inflation Slightly Above Target | Inflation Remains Sticky | Inflation at High Levels , Oil Prices Driving Inflation Pressure |
Economic Assessment | Economic Modest Expansion | Strong Economic Resilience | Robust Economic Expansion, High Uncertainty in Geopolitical Situations |
Employment Statement | Job Growth Slowing | Employment Stable | Job Growth Slower, Unemployment Rate Steady |
Rate Cut Signals | Retain Expectations for Rate Cuts This Year | Slightly Cooling Rate Cut Expectations | Significantly Cooling , No Clear Rate Cut Schedule |
Internal Disagreements | Minor Disagreements | Increasing Disagreements | Significantly Increased Disagreements , 8:4 Vote Split |
Core Attitude | Wait for Inflation to Recede | Wait for Data, Hold Steady | Cautious of Inflation Rebound, More Cautious Easing |
Market Pricing | Rate Cuts Expected 2-3 Times This Year | Rate Cuts Expected 1-2 Times This Year | Market Bets Only 1 Time or Even Postponed to Year End |
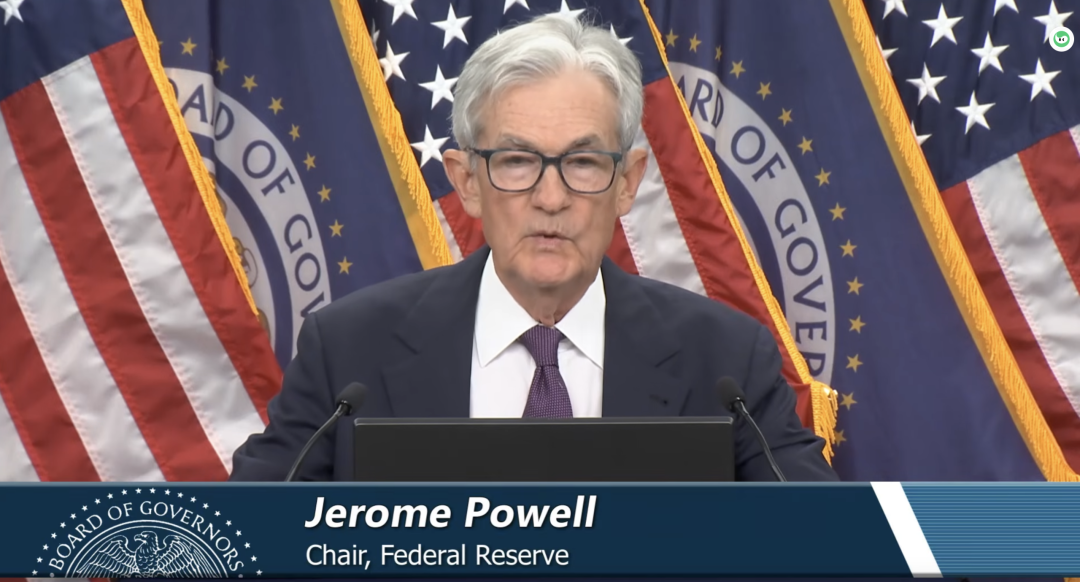
From Dovish in February with Rate Cut Expectations → Neutral and Watchful in March → Turned Hawkish in April, Inflation Concerns Rising, Internal Divisions Increasing, Rate Cut Expectations Delayed Directly. Now entering the "Fed's Hawkish Watchful Period," do not chase highs in the short term; overall it is showing a weak fluctuation trend.
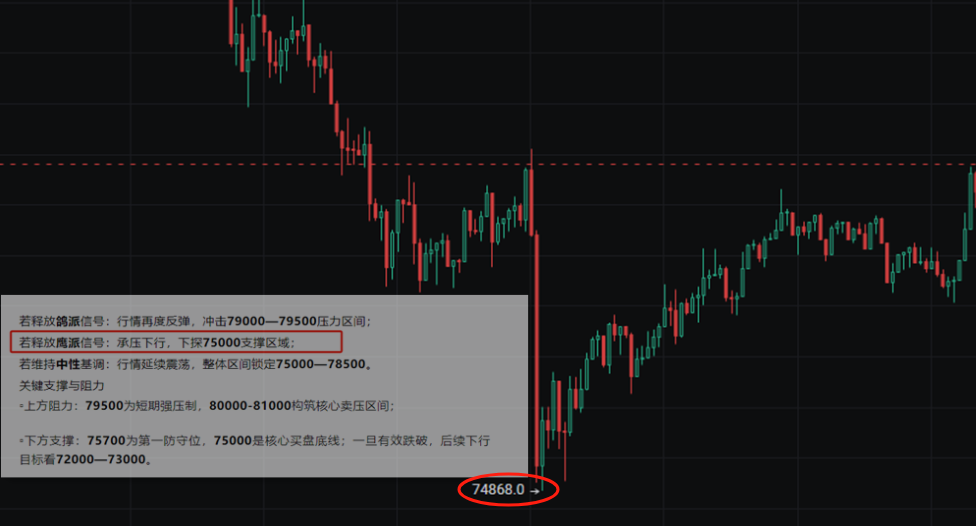
The short-term market is just as predicted yesterday; the Federal Reserve released clear hawkish signals, Bitcoin responded by breaking down to the critical support level of 75000, and the overall trend aligns perfectly with our prior analysis.
I. Today's Core Viewpoints First
Personal Core Judgment: It is Extremely Difficult for Bitcoin to Rebound and Stay Above 79500 Again; the market is likely to rebound only to around 78000 before facing pressure and weakening, followed by a direct break below; this has a probability of 40%-45%; if it effectively breaks below the support at 75700, it will trigger an accelerated downward trend.
II. Current Situation of the Market
The market shows a clear weak structure: prices have faced resistance and fallen at 79500 three times, with high points gradually moving lower (79388→79500→78200); daily trading volume continues to shrink, and bullish momentum is exhausted; the 4-hour level has officially broken below the upward trend line, ending the bullish trend.
This round of rebound was entirely driven by futures funds, while spot buying demand remains weak, making the market structure very fragile; at the same time, there is a heavy selling pressure wall of approximately 90 million dollars in the 80000-81000 range, creating significant selling pressure above.
III. Core Probability Predictions for the Market
The probability of the market reaching a new high of 79500 is only 35%-40%; even if it briefly touches this level, it would be considered the final price rise of the 4th wave, and will ultimately result in a pullback;
A greater probability (40%-45%) is that it will repeatedly fluctuate in the 76000-79000 range, struggling to break through the 80000 level, followed by a direct downward trend.
IV. Three Possible Market Path Probability Derivations
Path One: Secondary High at 79500 Followed by a Pullback (Probability 35%-40%) After consolidating in the 76000-78000 range, it tests an upward attack in the 79000-79500 area, meeting strong resistance and retreating.
Path Two: No High Breakout, Direct Downward Break (Probability 40%-45%) Unable to mount a counteroffensive to touch 79500, it will directly break below the key support at 75700 after horizontal fluctuations, initiating an accelerated downward trend.
Path Three: Volume Breakthrough Above 80000 (Probability 15%-20%) Requires a confluence of favorable fundamentals to trigger; even if there is a short-term breakout, it is more likely to be a false breakout, followed by a rapid spike and pullback, strongly inducing buying.
The latest BTC mid-term layered short strategy for May has been fully updated and is available for your reference; please check it against the market.
V. Core Trading Principles
Strictly follow the rules: Do not enter the market unless the price reaches the layout range; if the range is reached without clear bearish signals, do not blindly increase positions; once the unified stop-loss level is touched, decisively exit all positions.
Focus on the key turning window time confirmed for May 12 - 16, and maintain a primarily cautious wait-and-see approach before the window arrives.
To obtain more timely market interpretations and exchange of practical ideas, or to inquire about super member services, please like and follow, or apply to join the free group: 74619116
免责声明:本文章仅代表作者个人观点,不代表本平台的立场和观点。本文章仅供信息分享,不构成对任何人的任何投资建议。用户与作者之间的任何争议,与本平台无关。如网页中刊载的文章或图片涉及侵权,请提供相关的权利证明和身份证明发送邮件到support@aicoin.com,本平台相关工作人员将会进行核查。