Hello everyone, I am Sister Qinglan! Welcome to the Qinglan Crypto Classroom. Today, we will use the TPV three-point verification trading system that I have polished for a long time to break down the current Bitcoin market situation, providing practical insights!
Step 1: Look at the big picture (Overview of trends across multiple timeframes)
Let's gather the key information from four timeframes:
Daily timeframe (1d):
Trend: Bullish arrangement, price above the moving average. The latest closing price is 76308.53.
Key level: Price is fluctuating near recent highs.
Market sentiment: The on-chain fear and greed index is 32, in a “fear” state, but better than the “extreme fear” levels of 8-14 seen a few days ago, indicating a gradual recovery of market sentiment while still being cautious overall. Total market cap is 2.65 trillion USD, with a slight increase of 0.72% in the last 24 hours, and no obvious capital inflow. News includes both the positive “breakthrough of 76000 USD” and the negative “drop below 75000 USD,” indicating mixed signals.
4-hour timeframe (4h):
Trend: Bullish arrangement, price above the moving average. The latest closing price is 76308.54.
Key level: Price is approaching a recent high area.
Market sentiment: Resonates with the daily timeframe and similarly affected by overall market sentiment. The news “Whale returns! Over 700 million USD large orders to buy Bitcoin” may support this timeframe's capital sentiment.
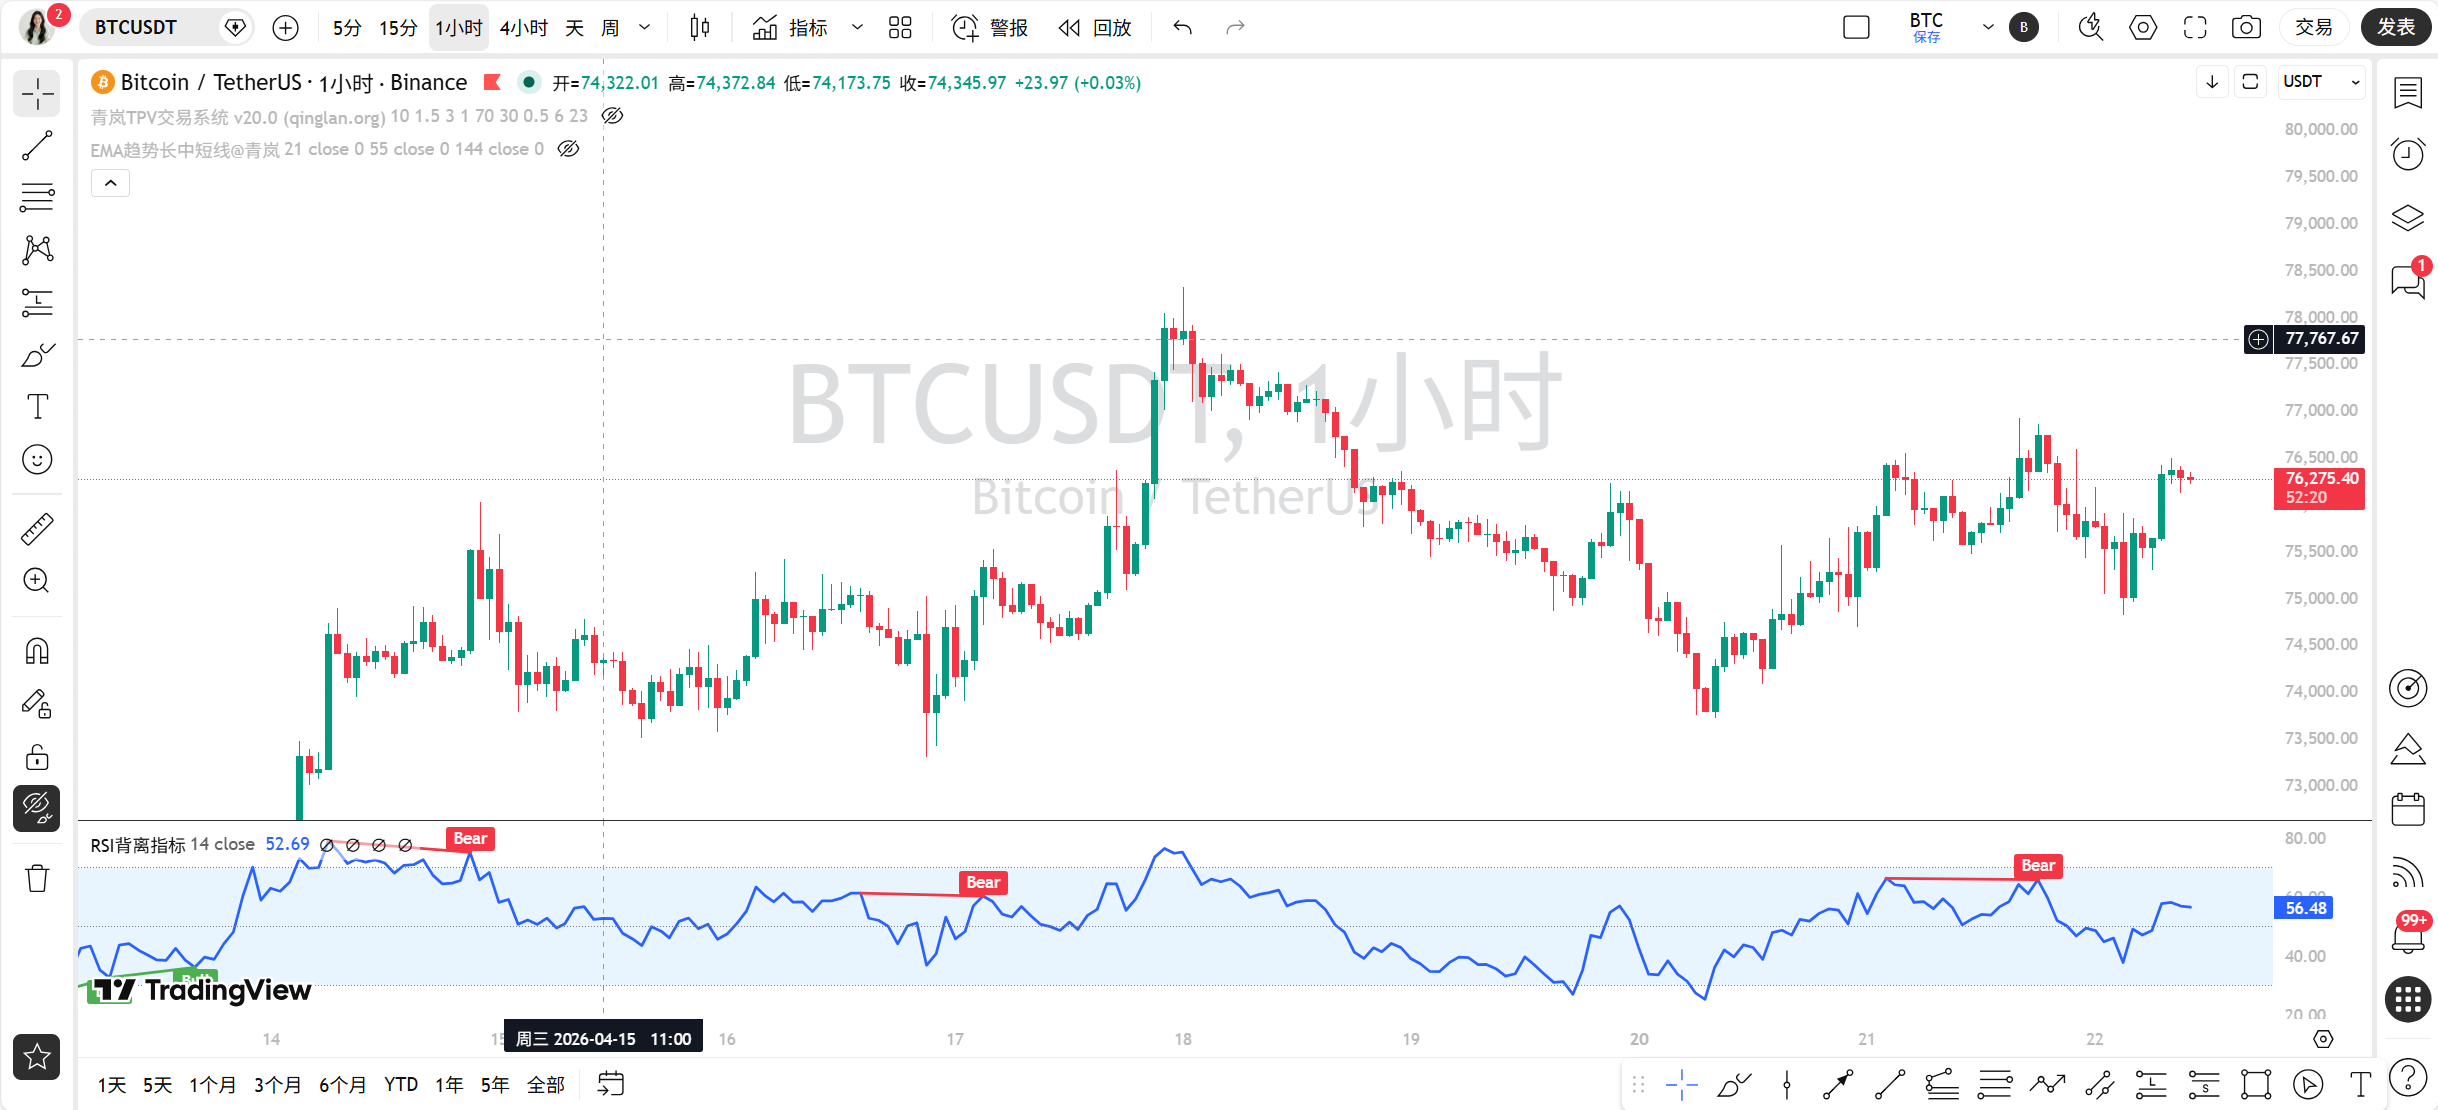
1-hour timeframe (1h):
Trend: Moving averages are intertwined, and there is a fluctuating pattern. The latest closing price is 76308.54.
Key level: Price is hovering near the moving average, direction unclear.
Market sentiment: This timeframe is more sensitive, with news “2.6 billion USD liquidation across the network in 24 hours” showing sharp short-term fluctuations and contention, indicating market sentiment is unstable.
15-minute timeframe (15m):
Trend: Moving averages are intertwined, narrow fluctuations. The latest closing price is 76308.54.
Key level: Price is operating within a small range.
Market sentiment: Ultra-short-term is greatly affected by immediate news and order flow, such as headlines like “BTC drops below 75000 USD” and “breakthrough of 76000 USD” that trigger quick reactions.
Step 2: Find pivot points, draw key lines (valid highs and lows + trend lines)
Let's identify the key turning points for each timeframe:
Daily (1d):
Valid high (Pivot High): The recent highest price in the data is 76927.57 (from the 4h highest price sequence, corresponding to the daily high).
Valid low (Pivot Low): The recent lowest price in the data is 73724.31 (from the 1h lowest price sequence, corresponding to the daily low).
Trend line: Connect from the low of 73724.31 upwards, forming an ascending trend support line, with the current price above it.
4-hour (4h):
Valid high (Pivot High): 76927.57 (provided by the 4h highest price sequence in the data).
Valid low (Pivot Low): 74821.57 (provided by the 4h lowest price sequence in the data).
Trend line: Connect the low of 74821.57 and the high of 76927.57, with the current price fluctuating near the upper bound of the range.
1-hour (1h):
Valid high (Pivot High): 76927.57 (similarly taken from the data).
Valid low (Pivot Low): 76132.95 (latest value from the 1h lowest price sequence in the data).
Trend line: Recently formed a small fluctuating range with a high of 76927.57 and a low of 76132.95.
15-minute (15m):
Valid high (Pivot High): 76746.41 (recent high point from the 15m closing price sequence in the data).
Valid low (Pivot Low): 75834.65 (recent low point from the 15m closing price sequence in the data).
Trend line: Fluctuating within a very narrow range, the effectiveness of the pivot point needs more candlestick confirmations.
The news events “BTC drops below 75000 USD” and “Bitcoin breaks through 76000 USD” happened just around the upper and lower bounds of this fluctuating range, indicating that the news amplified the price volatility near critical pivot points.
Step 3: Indicators to assist (Technical indicator verification)
Let's see what the indicators say:
Daily (1d): MACD's DIF is 1808.51, DEA is 1529.25, histogram is 279.26, with no crossover, indicating bullish momentum is still present. RSI is 65.40, in a neutral strong area, not overbought. Indicators confirm a bullish trend.
4-hour (4h): MACD's DIF is 231.44, DEA is 203.79, histogram is 27.65, with no crossover. RSI is 58.66, neutral. Indicators show a healthy trend, but momentum is not strong.
1-hour (1h): MACD's DIF is 104.44, DEA is 53.76, histogram is 50.68, with no crossover. RSI is 54.73, neutral. Indicators confirm the fluctuating pattern, with no clear direction.
15-minute (15m): MACD's DIF is 177.76, DEA is 149.07, histogram is 28.68, with no crossover. RSI is 75.31, already in the overbought area! This is a warning signal, indicating that the ultra-short-term rise may be weak, with the risk of a pullback.
No significant top or bottom divergence phenomena are observed at the moment.
Step 4: Bull-bear arm wrestling (News + On-chain)
News:
Bullish factors: “Bitcoin breaks through the 76000 USD barrier,” “Whale returns! Over 700 million USD large orders to buy Bitcoin, target price 75731 USD,” “US-Iran ceasefire extension impacts oil prices, Bitcoin breaks through 76,000 USD against the trend,” “The probability of the Fed keeping the April interest rate decision unchanged is as high as 99.5%” (stability in policy expectations).
Bearish factors: “BTC drops below the 75000 USD mark, with a 24-hour drop of 1.67%,” “Bitcoin fluctuates, mainstream CEX and DEX funding rates reveal a full bearish market,” “2.6 billion USD wiped out across the network in 24 hours, shorts suffered heavy losses of 171 million” (indicating sharp volatility with mutual destruction), “KelpDAO stolen funds washing accelerates,” “Scammers impersonating Iranian authorities demand Bitcoin.”
Core factors: The two most important are “Fed interest rate decision expectations stable” (bullish) and “whale large orders to buy” (bullish), but “high liquidation across the network” and “funding rates indicating a bearish outlook” show strong bull-bear contention. Currently, both technical and news aspects are in a state of “resonant fluctuation,” with no overwhelming single-sided advantage.On-chain data:
The fear and greed index is at 32 (fear), but has risen from extreme fear, indicating that market sentiment is in a recovery phase but still fragile, which matches with the high price fluctuations.
BTC dominance is at 57.69%, still holding absolute advantage.
Total market cap is 2.65 trillion USD, with a 24-hour change of +0.72%, and very gentle capital inflow.
The on-chain data (fear sentiment, slow capital inflow) shows a certain “divergence” from the technical patterns of prices at high levels, with strong price momentum but the sentiment and funds not synchronously enthusiastic, suggesting that the basis for the rise is not solid, and caution towards pullbacks is warranted.
Step 5: The path of least resistance (Trading strategy)
Comprehensive TPV three-point verification:
Trend (T): Daily and 4-hour are in a bullish trend, but 1-hour and 15-minute are in fluctuation.
Pivot (P): Key support is near the 4-hour low of 74821.57 and the daily low of 73724.31; key resistance is near the recent high of 76927.57.
Verification (V): Indicators on the daily are healthy, but the 15-minute RSI is already overbought. News is mixed, and on-chain sentiment is cautious.
Current trading suggestion: Near the key resistance level (close to 76927.57), it is not advisable to chase long; one should wait for a pullback. A more prudent strategy is to wait for the price to revisit the key support area (such as near 74821.57), assess whether the indicators of smaller timeframes are oversold, and then look for long opportunities.
Key entry area: 74800 - 75200 region (close to the 4-hour pivot support).
Stop loss basis: Valid breakdown below the last low of 73724.31 (daily pivot).
Target area: Test the previous high of 76927.57 again, or even break through.
Step 6: How will it go today (Market prediction)
Current (within a few hours): Expected to continue fluctuating between 76132.95 (recent low on the 1-hour) and 76927.57 (recent high). Due to the 15-minute RSI reaching 75.31, there is pressure for a short-term pullback.
Today and recently critical: The most important support level today is 76132.95 (1-hour low); breaking below it may test 74821.57 (4-hour low). The most important resistance level is 76927.57 (recent high), breaking it would open upward space.
Trading idea: The most suitable strategy now is to “watch” or “wait to go long on pullbacks.” It is not advisable to chase highs near the resistance level of 76927.57. Reason: Although the larger trend is upward, the small timeframe is overbought, and sentiment is cautious; there is insufficient momentum for a direct upward attack, and the probability of a pullback is higher.
Summary: The core contradiction in the current market is the “pull between the long-term bullish trend and short-term cautious sentiment with technical overbought conditions.”
Trading maxims: Combining the themes of “whales” and “liquidations” from the news: Whales can create waves, but when the tide goes out, we see who is swimming naked; to avoid becoming just another number in the liquidation data, one must remain “fearful” when others are greedy.
[Qinglan TPV Trading System Backtest Data]
Based on nearly 1003 historical backtests (sample size 1009), the accuracy rate is 71.7% (last backtest time 04-22 07:00:02). Backtest results are for strategy confidence reference only, and past performance does not guarantee future returns.
[Qinglan's Personal Opinion]
Oh, looking at the market, Sister Qinglan feels that the market is like a hesitant person, wanting to go up but afraid of heights, wanting to go down but unwilling. My insight is that in such a situation where bull and bear news clash and the indicators of small timeframes are overbought, we must control our hands and not rush in just because the price has risen a bit. Good things take time; wait for it to pull back to the critical support line we have drawn, and when the indicators are also repaired, that’s when we should enter the market and sleep soundly. Remember, there are always opportunities in the market; what is lacking is patience.
This TPV system has been honed by me through years of monitoring, reviewing, and practical experience. I can't say it's 100% accurate, but at least it helps us have more confidence at critical levels. If you want to get the latest entry opportunities captured according to the TPV system in real time, welcome to visit the Qinglan Crypto Classroom official website www.qinglan.org
免责声明:本文章仅代表作者个人观点,不代表本平台的立场和观点。本文章仅供信息分享,不构成对任何人的任何投资建议。用户与作者之间的任何争议,与本平台无关。如网页中刊载的文章或图片涉及侵权,请提供相关的权利证明和身份证明发送邮件到support@aicoin.com,本平台相关工作人员将会进行核查。