
Author: Kunal Doshi, Blockworks Research
Translation: Felix, PANews
Prediction markets have rapidly evolved from niche products into significant foundational financial instruments. While their early large-scale adoption was propelled by the 2024 US elections, these markets have since expanded into new categories, with sports events becoming one of the largest and fastest-growing segments. This shift comes against the backdrop of a continually growing US sports betting market, currently valued at $167 billion, though its structure remains unfavorable to participants due to built-in vigorish and bookmaker-controlled pricing.
Kalshi's Growth and Market Composition
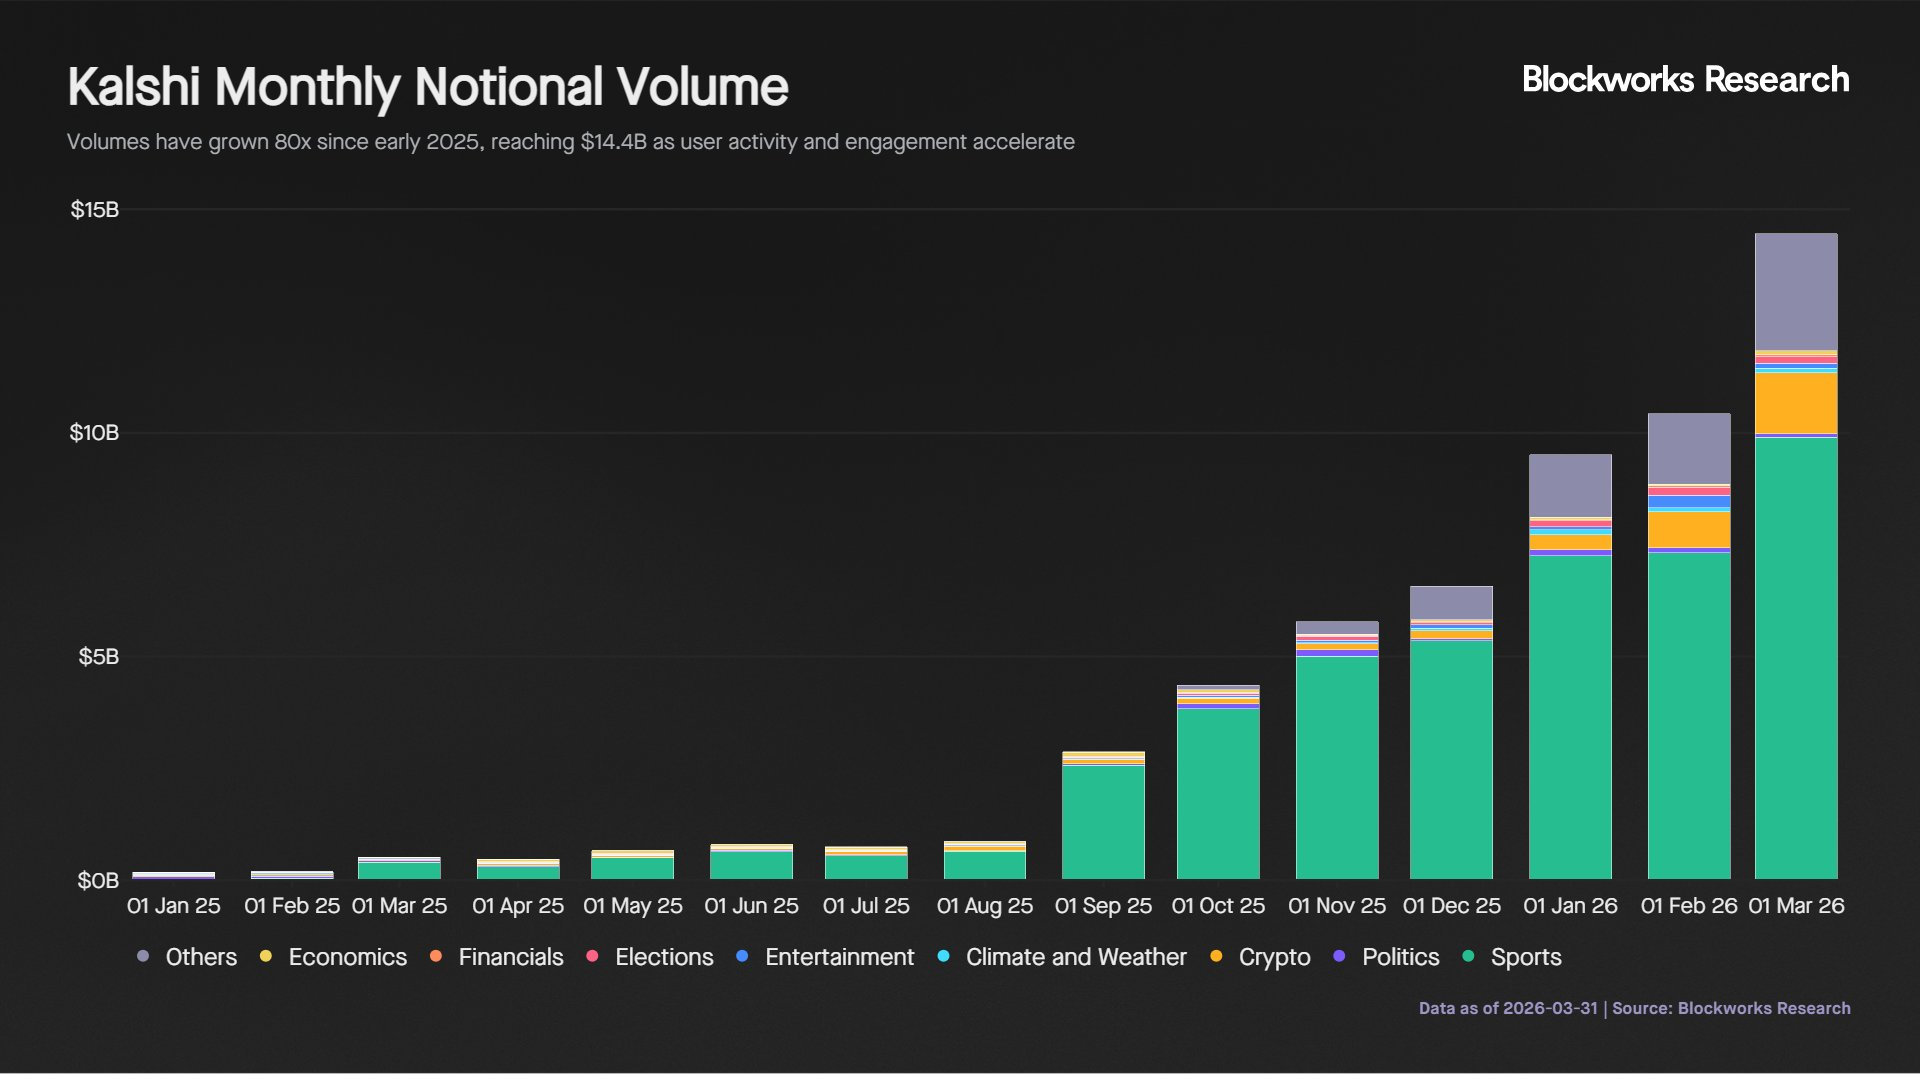
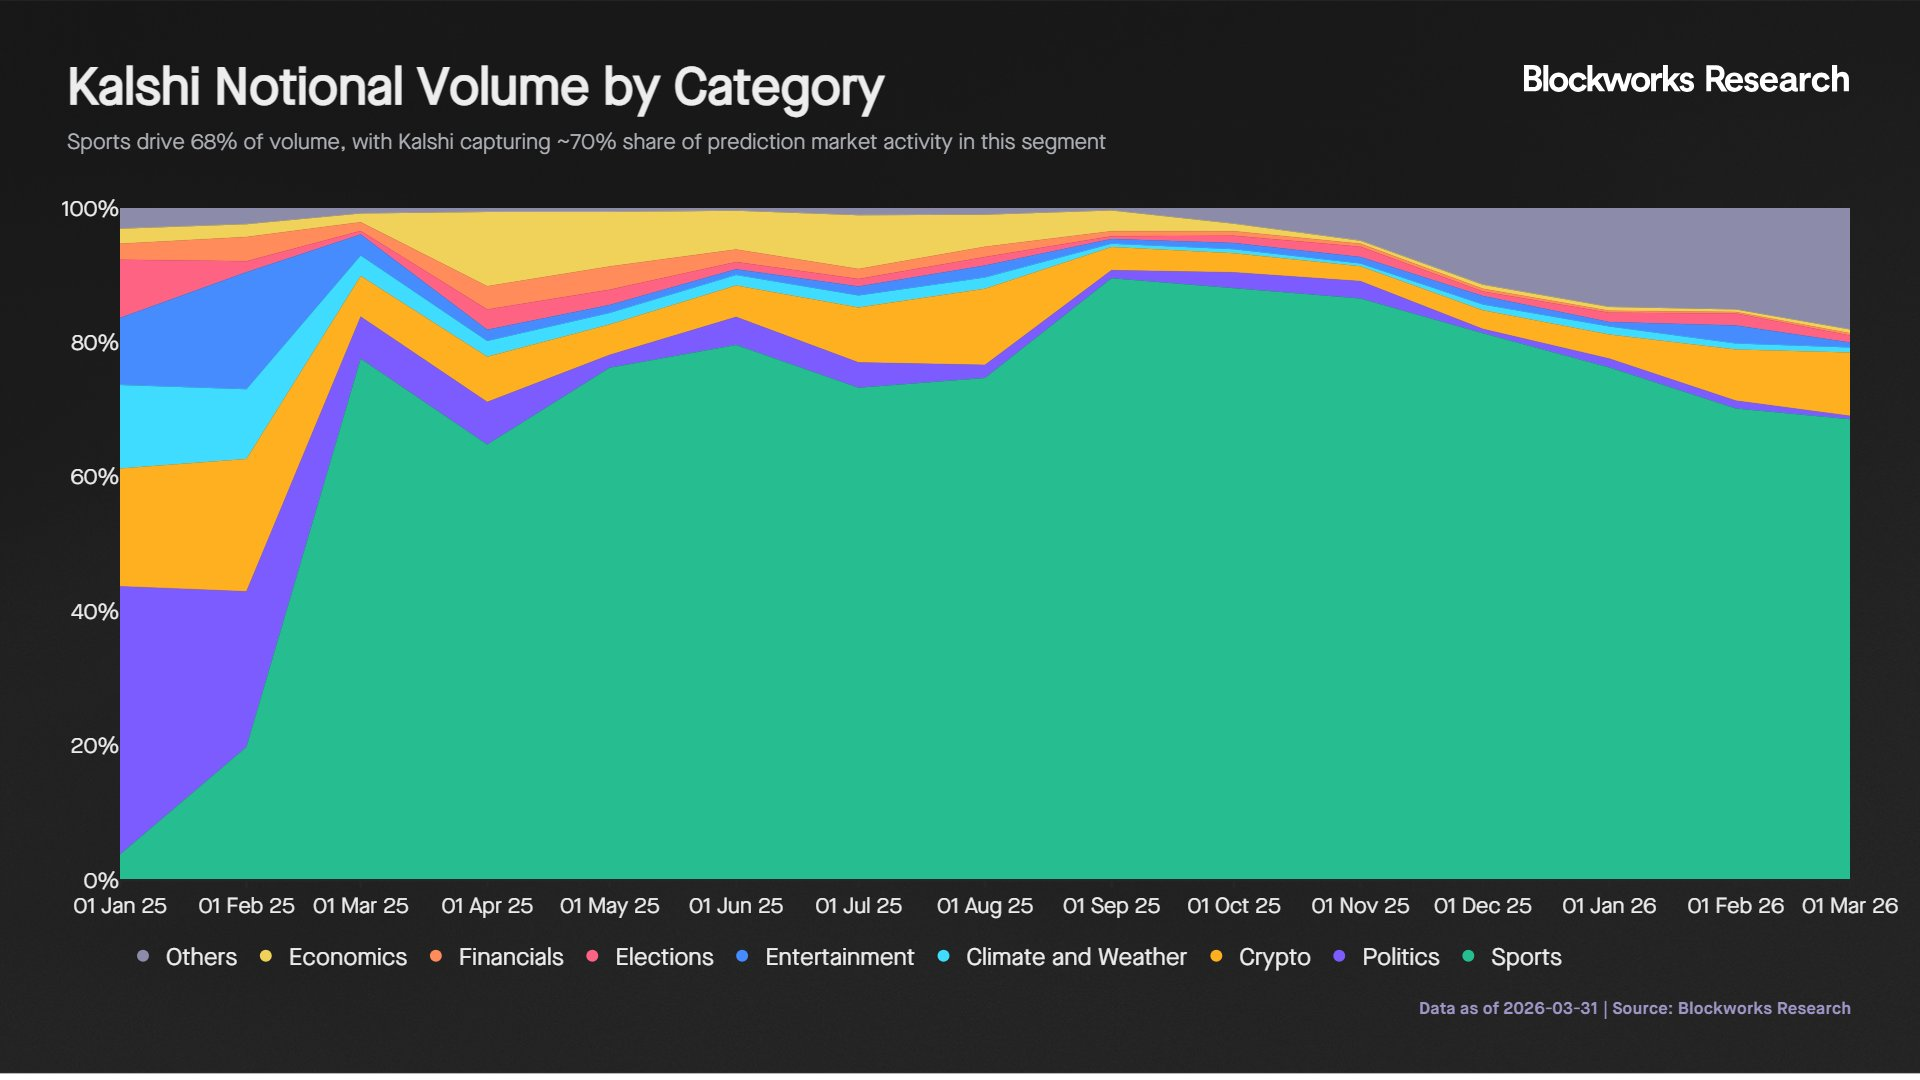
The sports market has been the main driver of this growth, currently accounting for 68% of total trading volume. The trading volume in the sports category increased from $540 million in July 2025 to $9.9 billion in March 2026, achieving an 18-fold increase over three quarters. Kalshi holds a strong position in this sector, accounting for about 70% of the sports prediction market's trading volume.
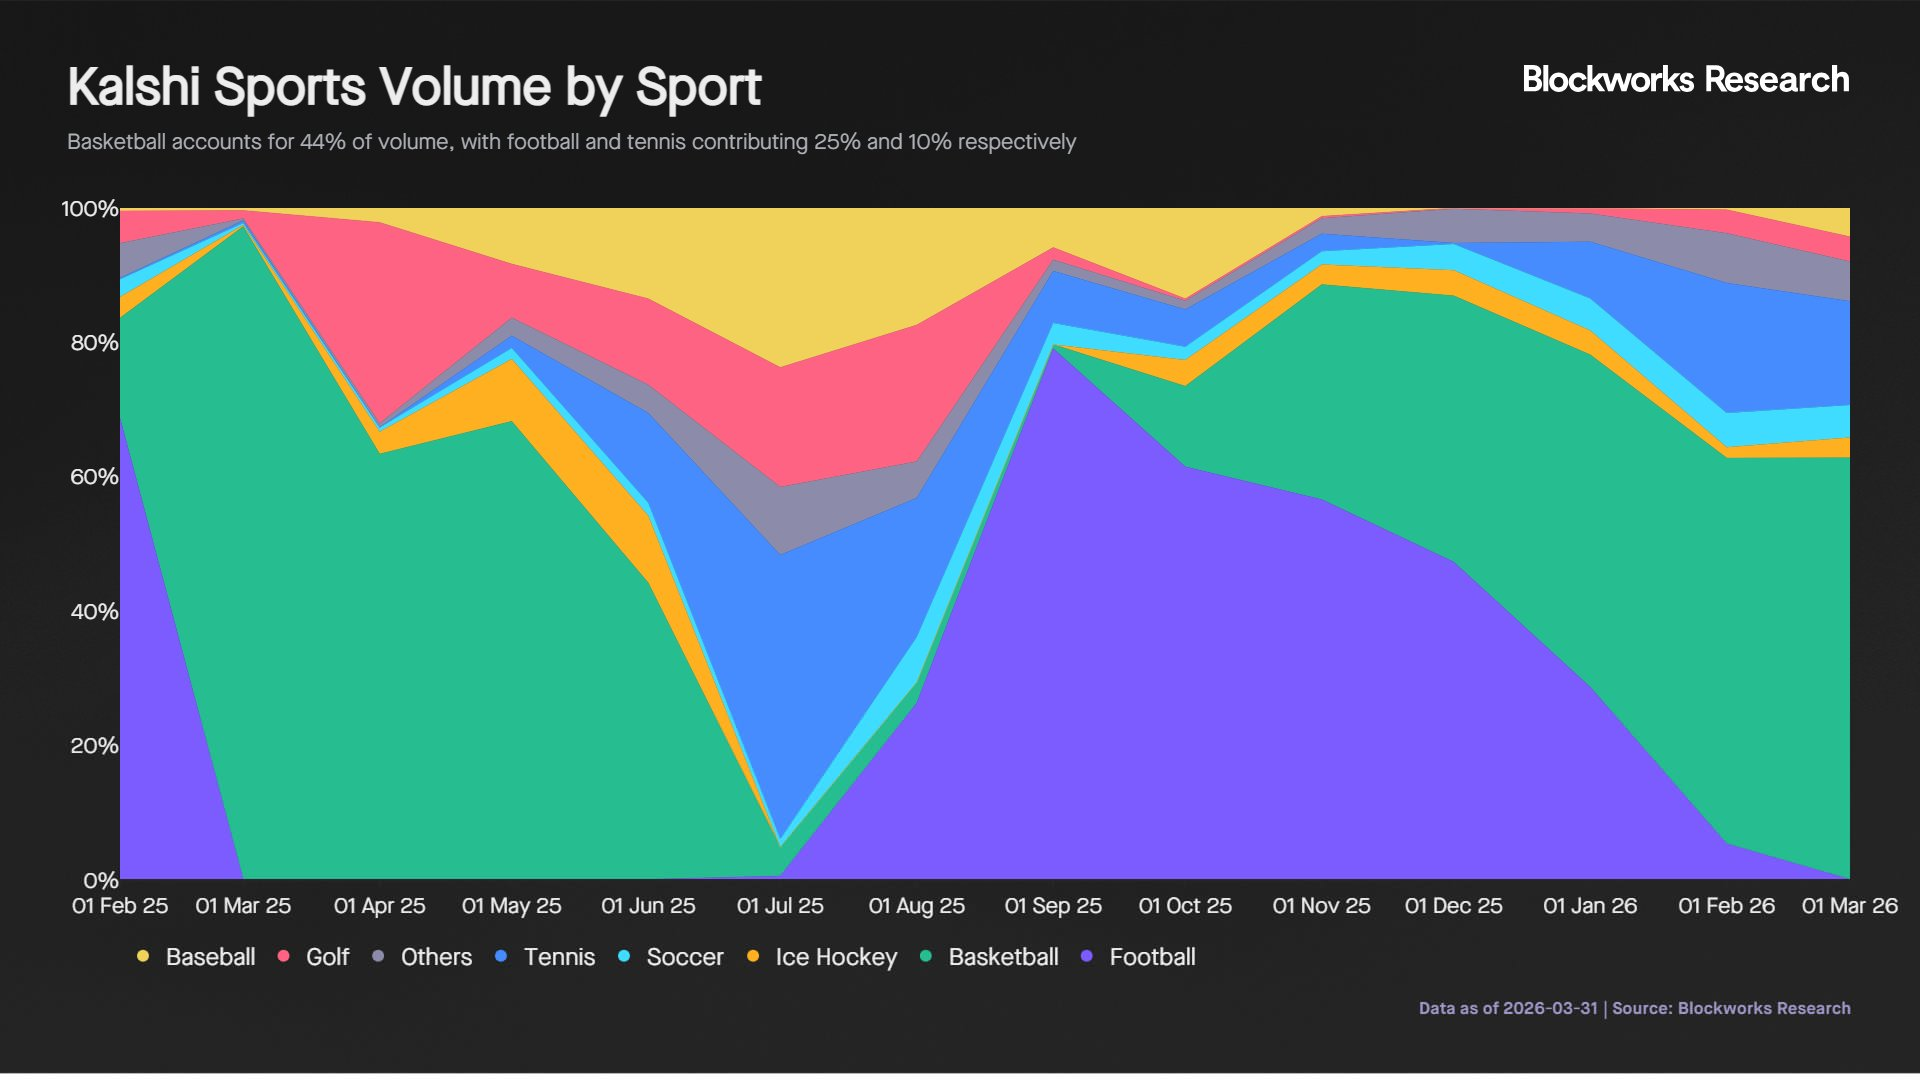
In sports trades, trading volume is significantly affected by seasonality and driven by major events. Basketball accounts for 44% of sports trading volume, followed by football (28%) and tennis (10%). Football drove a sharp increase in trading volume from $640 million to $2.6 billion between August and September 2025, but fell back after the Super Bowl.
Pricing Accuracy and Information Efficiency
Focusing on the basketball and NFL (National Football League) markets, which together account for 72% of Kalshi's sports trading volume, this analysis is based on 3,100 games involving $8.5 billion in nominal trading volume.
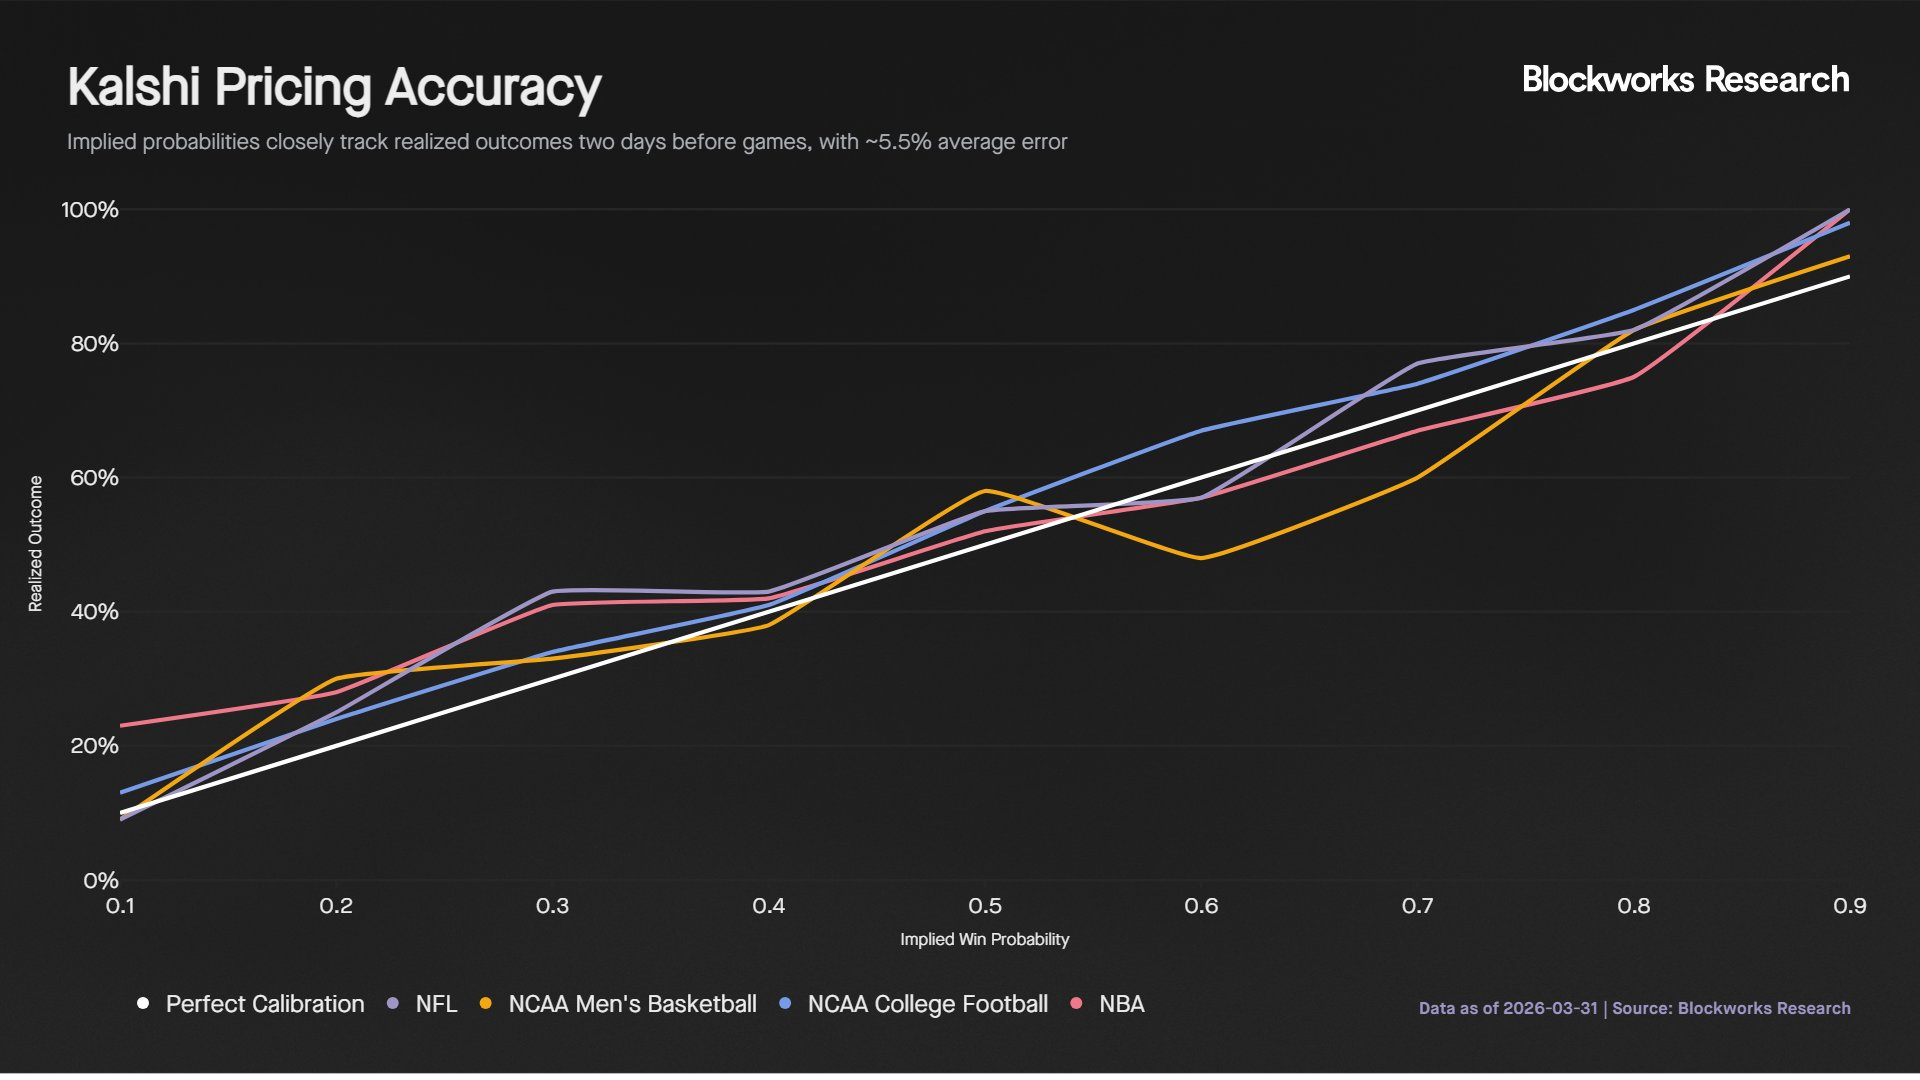
This indicates that pre-game odds are strong indicators of final results. Kalshi prices are not only reactive but also incorporate significant pre-game information. This accuracy may reflect the presence of informed traders and model-driven traders who actively price probabilities based on existing data. As a result, market prices begin to converge toward true outcomes long before the game starts, reinforcing the role of prediction markets as effective information aggregation mechanisms.
Liquidity, Trading Volume Distribution, and Market Maker Behavior
As expected, trading volume during games accounts for about 85% of total trading volume, as real-time events continuously update the probabilities of each team winning. Approximately 3% of trading volume occurs in the last 30 minutes, while trading volume in the last 10 minutes is nearly zero, as the outcome of the game is virtually determined by that point. The absence of a surge in trading volume in the final stages indicates that most participants choose to hold their positions until the game ends rather than actively close them.
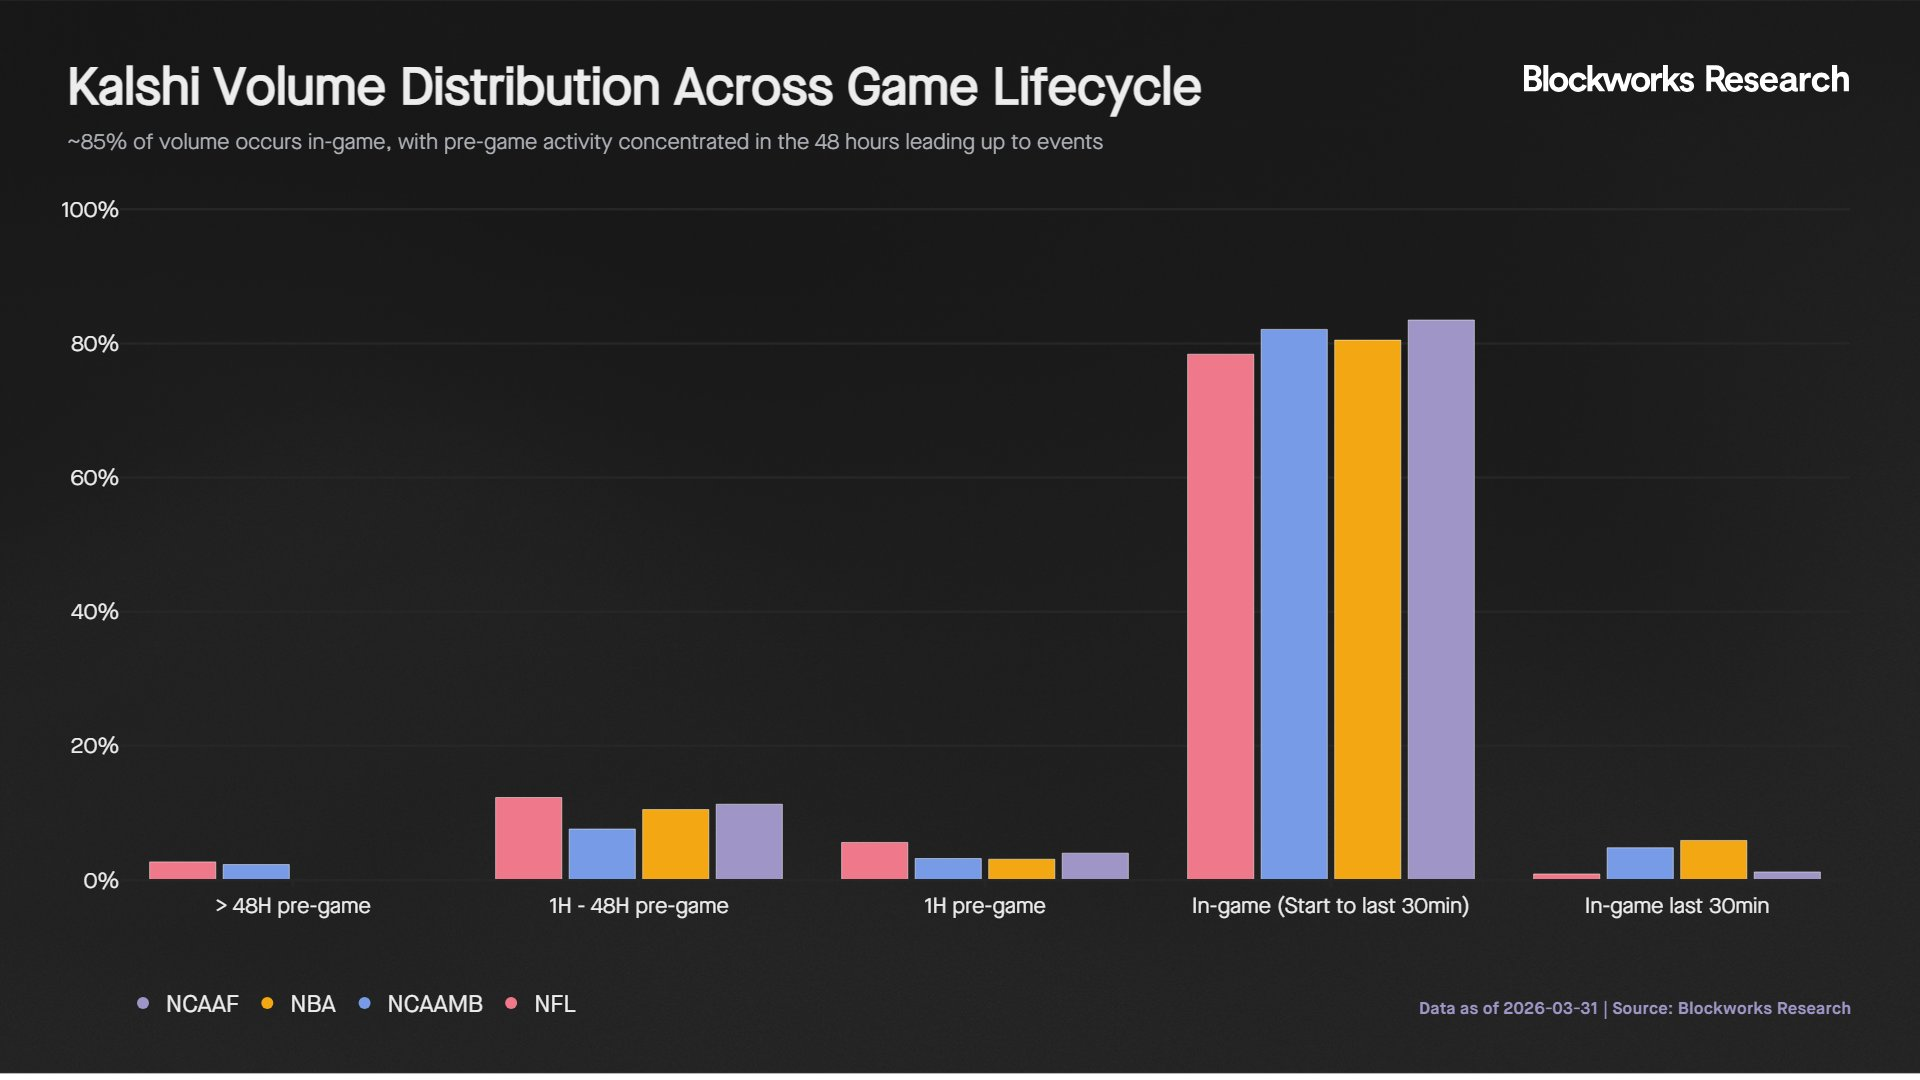
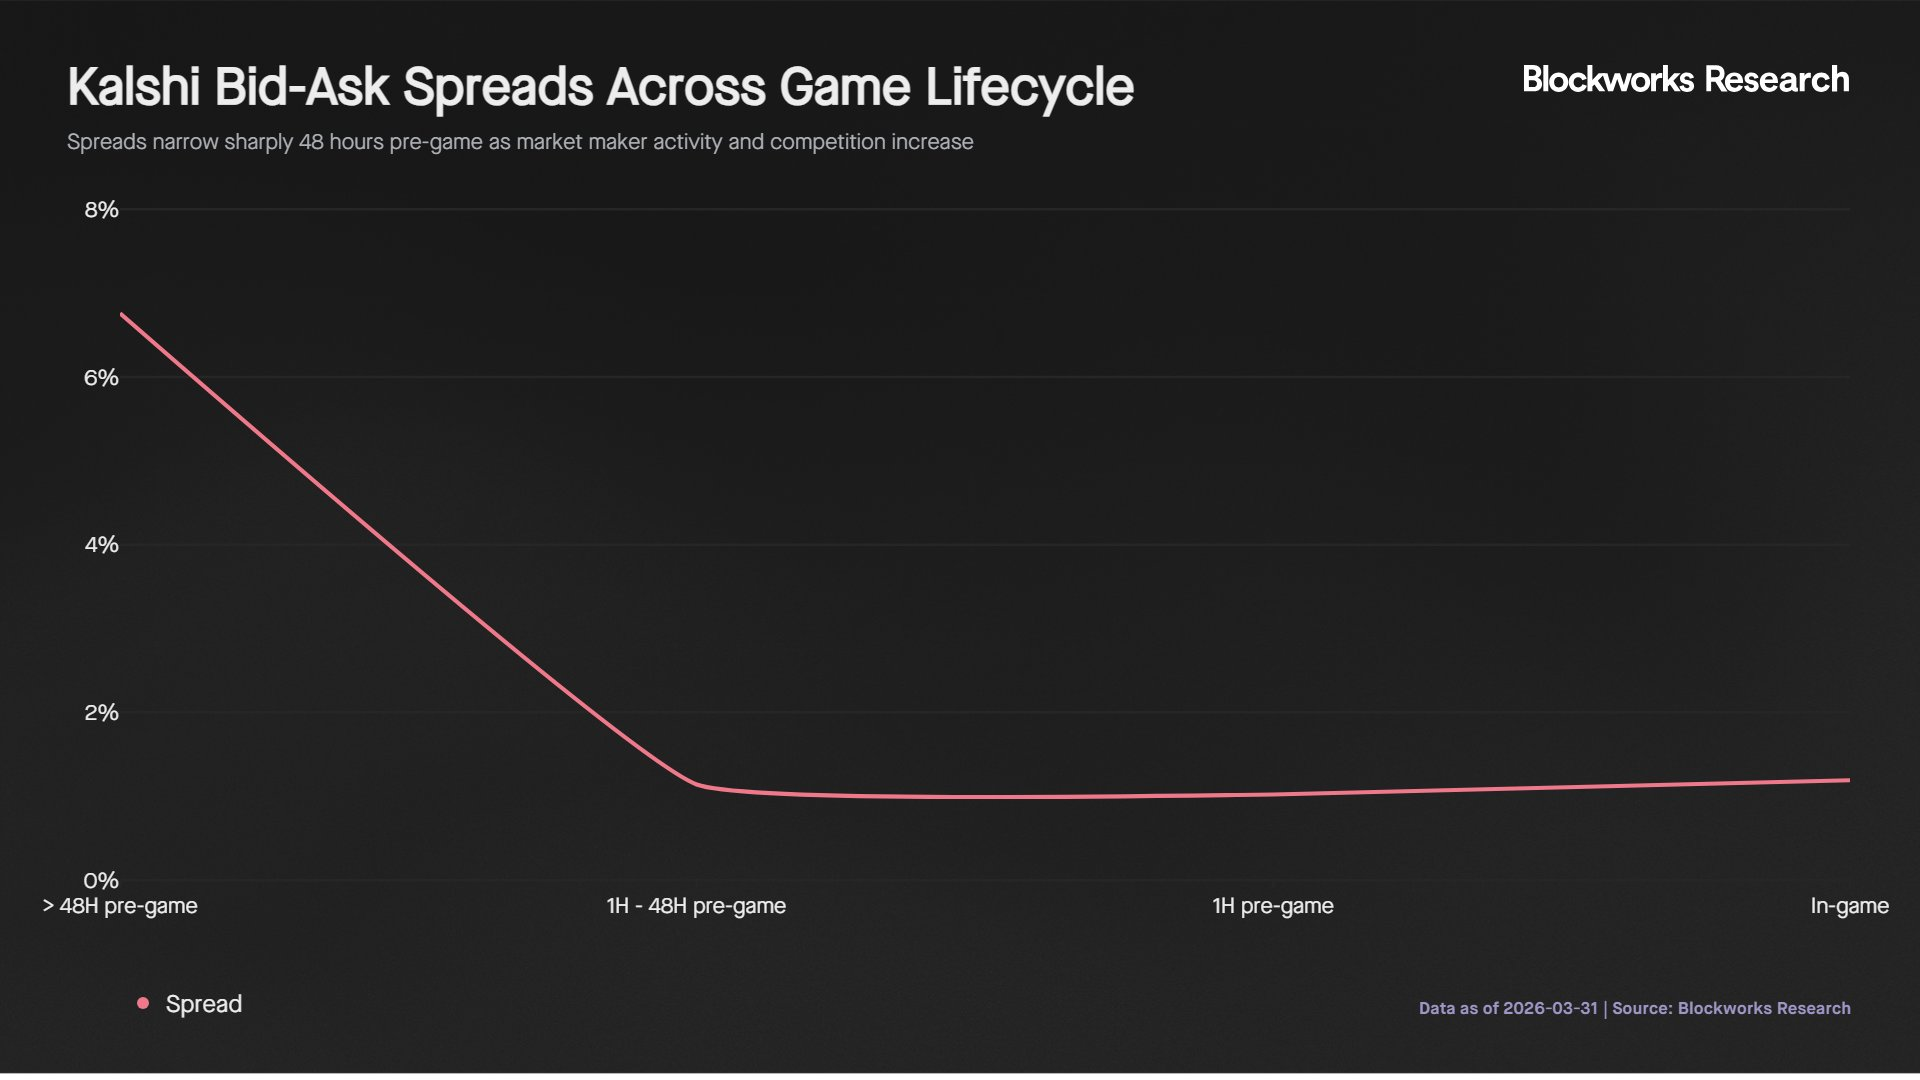
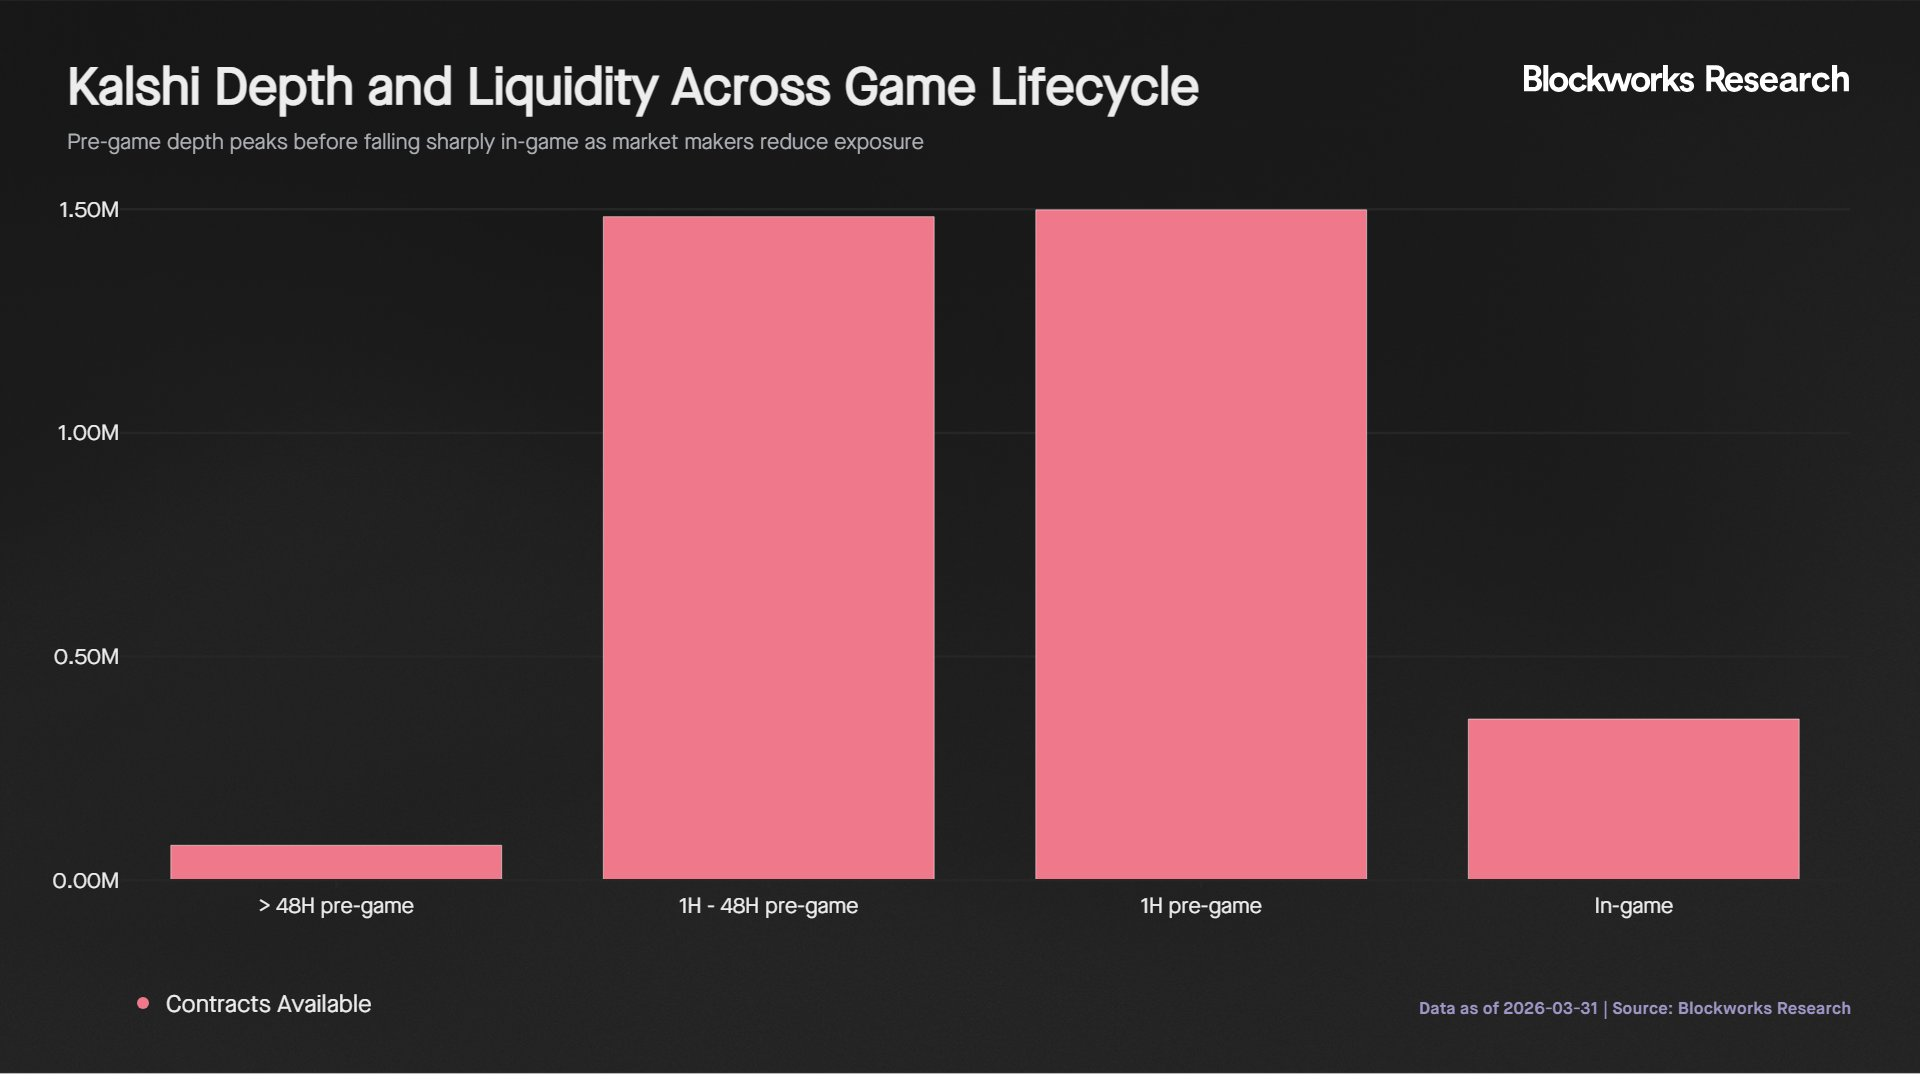
For institutional participants placing $5,000 or more per position, execution during the game is limited, as orders either impact prices or must be spread across multiple markets. Thus, for larger traders, the optimal execution window is from 48 hours to 1 hour before the game, during which contract depth is more than four times that of game time and spreads remain small.
Comparison with Traditional Sports Betting and Arbitrage Dynamics
University of Michigan vs. University of Arizona, NCAA Championship
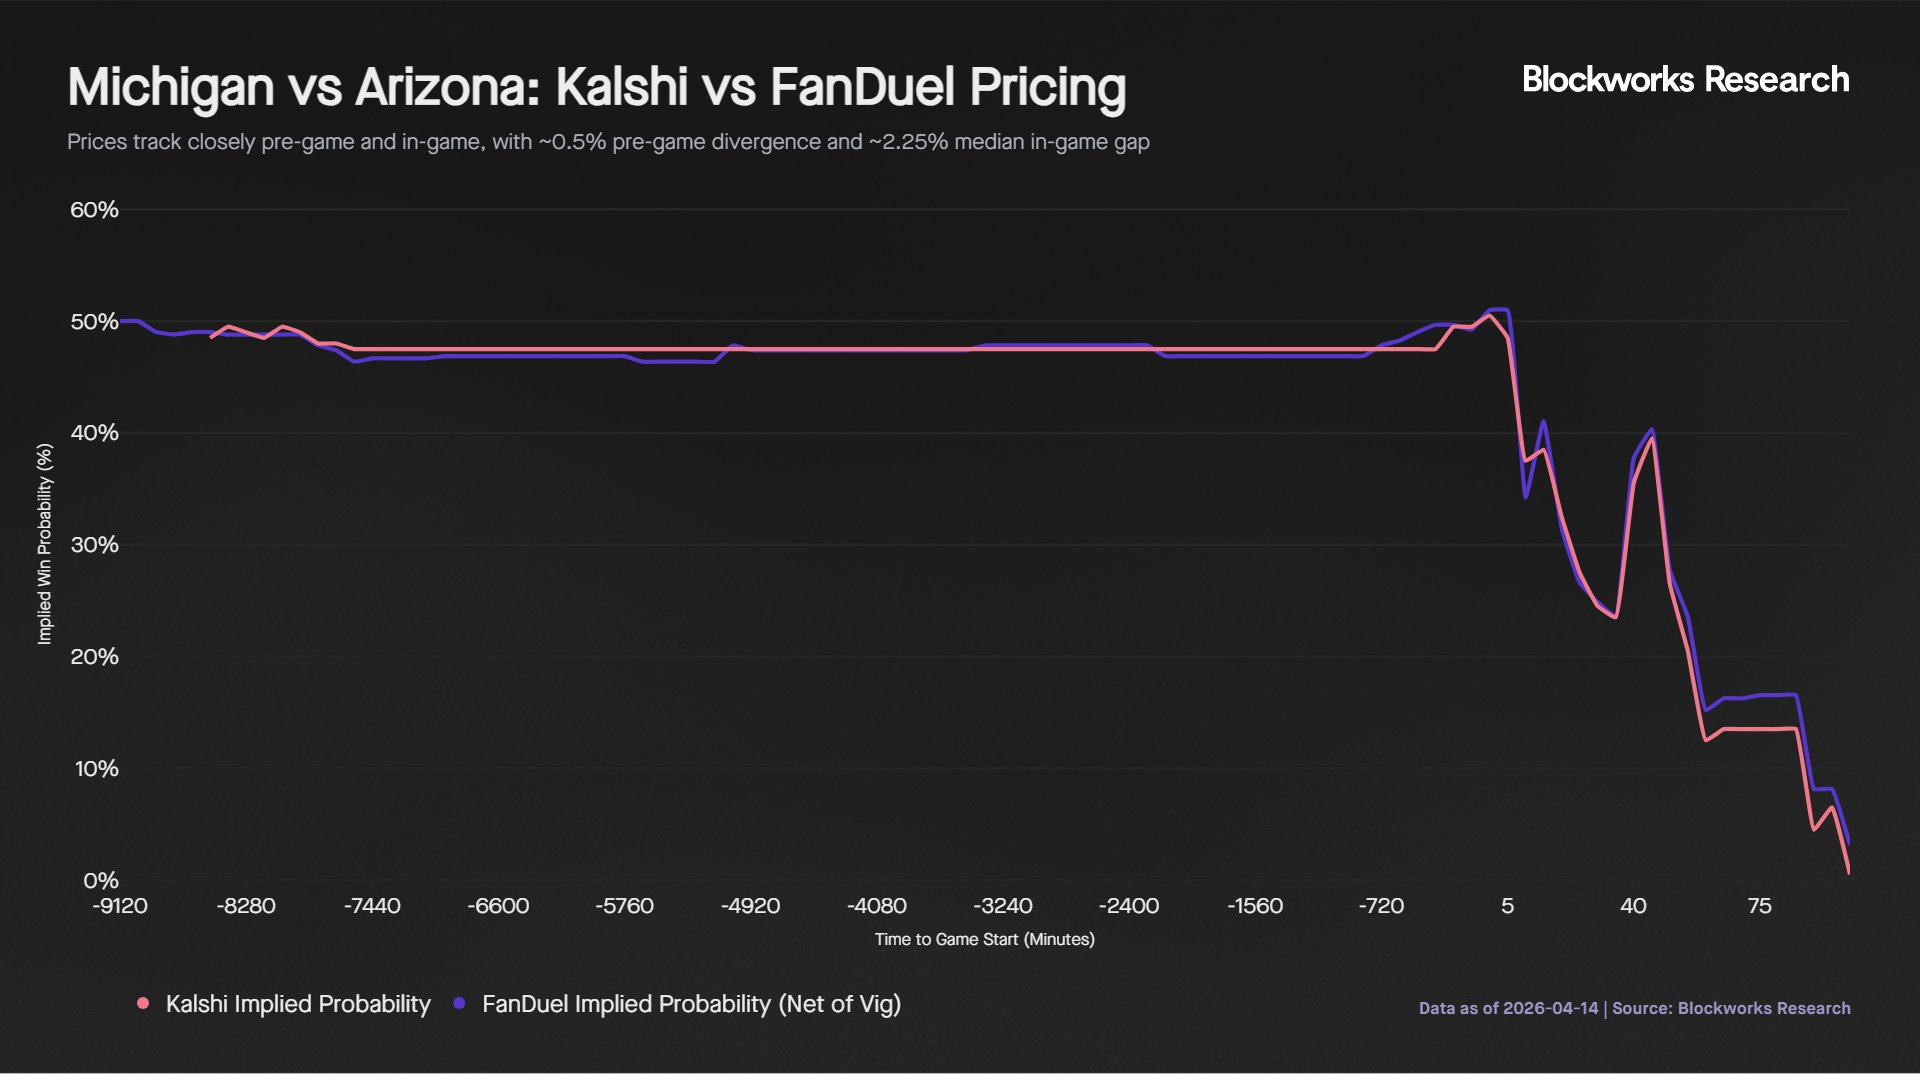
This difference primarily stems from the structural differences between the platforms. FanDuel incorporates about 4.5% in vig (or built-in margin), equivalent to about 2.25% on each side. On Kalshi, contracts are traded in increments of 1% with a minimum spread of 1%. For the taker in arbitrage trades, the actual cost of crossing the spread is approximately 0.5%, leading to a total trading friction of around 2.75%. Therefore, traders must overcome these cumulative costs to make arbitrage opportunities profitable.
Notably, the price differences in the second half displayed a directional tendency, with FanDuel consistently pricing Arizona higher than Kalshi as Michigan extended its lead. This suggests that during strong momentum phases of the game, Kalshi is quicker to integrate in-game information.
Pre-game pricing did not immediately converge. Five days before the game, the predicted results differed by 5.7%, with FanDuel estimating Buffalo’s win probability at 53.7% and Kalshi estimating it at 48%. In the following week, both platforms gradually adjusted their predictions, with neither consistently leading. By game time, both platforms' win probability estimates for Buffalo were close to 48%. The average pre-game difference was 1.40%, more than double that of the NCAAB case, indicating weaker early consensus.
The median price difference during the game was 1.61%, with an average of 2.40%. Unlike the NCAAB case, there was no clear pattern to the direction of the differences in this game, with both platforms alternating leads.
What This Means for Market Participants
The odds on FanDuel have commission deducted, which is roughly equivalent to about 2% entry cost on each side. On the Kalshi platform, fees vary according to contract probabilities, peaking at around 50% probability; for takers, fees are around 3.50%, and for makers, around 0.88%. As most in-game trades occur within the probability range of 40% to 60%, the actual trading cost on the Kalshi platform ranges from 2.8% to 4.2%, comparable to traditional sports betting platforms and even higher in some cases, particularly for takers.
However, these limitations may improve over time. Increased competition from platforms like Polymarket should drive changes in fee structures and liquidity incentives. In the sports betting market, Polymarket's fees for takers are 0.03, lower than Kalshi's 0.07, while Polymarket also offers zero fees for makers and a 25% fee rebate. Additionally, Polymarket announced a $5 million sports liquidity incentive program set to launch in April 2026, aimed at encouraging tighter quoting and deeper order books.
In turn, this will create a positive feedback loop. Improved liquidity attracts more traders, increased trading volume attracts more market makers, and the increase in market-making activity further deepens liquidity and enhances execution quality.
Besides trading, the probability data on the Kalshi platform is also beginning to demonstrate informational value. In the sports market, clubs, agents, or reinsurance companies can utilize the market's implied probabilities to hedge contract risks, such as performance bonuses tied to player or team performance.
Despite a pricing mechanism similar to traditional sports bookmakers and occasionally higher trading costs, Kalshi has achieved rapid expansion due to several structural advantages relative to traditional sports betting companies.
Secondly, traditional sports bookmakers suppress the funding of winning users by limiting bet amounts, thus reducing the scale of funds from consistently profitable bettors. These limits are usually dynamic, with profitable users facing reduced betting amounts or account restrictions. This creates a structural cap on revenue. Kalshi does not impose such limitations and instead benefits from the participation of more sophisticated traders, who contribute to improved price accuracy and overall market efficiency.
Nevertheless, Kalshi's liquidity does not remain consistently stable throughout the game. According to communications with market makers, liquidity may decline at key moments (such as shots or critical actions), with some liquidity providers temporarily withdrawing quotes during settlement waits. However, users can still close positions during these periods, although execution may experience some slippage.
Given the above circumstances, the key question is how Kalshi's valuation compares to traditional sports betting operators.
Based on this, Kalshi's revenue last year was about $263 million, and is expected to reach $1.3 billion by 2026, with a monthly growth rate of 24%. Approximately 80% to 90% of its revenue comes from the sports betting market. Based on its previous financing valuation of $22 billion, this implies an expected sales multiple of about 16.9 times for 2026.
Nonetheless, their market capitalizations are $11 billion and $17.9 billion, respectively, indicating significantly lower valuation multiples. Historically, these companies' sales multiples usually fluctuate between 2x and 4x.
Kalshi's growth outlook further supports its premium valuation. While DraftKings and Flutter's revenues continue to grow, their growth rates have significantly slowed in recent years. In contrast, Kalshi's growth rate is astonishing, with monthly growth outpacing the annual growth rates of those traditional operators.
This market positioning aligns with its market structure, where participants trade with each other rather than betting against a bookmaker. However, there are risks involved. Traditional sports bookmakers are actively exploring entry into prediction markets, which could undermine Kalshi's early advantages. The recent regulatory pushback these operators have faced may reflect their attempts to delay competition while building their own products.
Conclusion
While currently high fees and limited in-game liquidity limit trade execution, especially regarding large transactions, these issues are expected to improve as competition drives down fees and enhances liquidity incentives. With increased market depth, higher trading volumes, tighter spreads, and more active market-making activity will create a positive feedback loop, further enhancing market quality.
Related Reading: Polymarket vs Kalshi: Who is the King of Prediction Markets?
免责声明:本文章仅代表作者个人观点,不代表本平台的立场和观点。本文章仅供信息分享,不构成对任何人的任何投资建议。用户与作者之间的任何争议,与本平台无关。如网页中刊载的文章或图片涉及侵权,请提供相关的权利证明和身份证明发送邮件到support@aicoin.com,本平台相关工作人员将会进行核查。


