Author: au_call
Translation: Deep Tide TechFlow
Deep Tide Guide: Recently, coins like RAVE and SIREN have appeared repeatedly, often bringing single-round profits of over 30 million USD to market makers. The author dissects the entire chain from the perspective of the operators: how project teams find market makers, how to control chips, how spot and contracts cooperate to harvest, and the tricks behind open interest (OI) and funding rates. This is the first article in the author's TG channel @au_call series, focusing on mechanism breakdown, which can help you see why you always get liquidated on such coins.
This article discusses how crime coins are manufactured, how operations are conducted on both the spot and contract ends, how to identify and trade them, and the secrets and common traps behind open interest (OI) and funding rates. Due to space limitations, many details are simplified at first. If the interaction is good, it can continue to expand later.
How crime coins are made
In the past year, in cases like MYX, COAI, AIA, and SIREN, it is common for market makers to earn over 30 million USD in a single round, specifically looking at the market. The revenue sharing structure usually has market makers taking over 70%, with project teams taking around 30%, and some projects even giving a higher ratio to market makers. Therefore, project teams that want to make money will actively seek experienced crime coin market makers, and some market makers will seek projects that have already concentrated sufficient chips.
Crime coins are not driven by fundamentals. The initial pricing considers two aspects: chip control degree and shell value.
Shell value is similar to the logic of backdoor listings in A-shares; this kind of shell is also needed to go on Binance. Once the project team and market makers agree on profit sharing and financing conditions, they can start working.
The market makers mentioned here are "active market makers," not traditional passive ones. Active market makers are bound to the interests of the project team, and their cooperation methods include token lending profit sharing, funding support, API-level execution, etc. They have greater control and sometimes can operate independently without the project team's knowledge. If the project team wants to pump the price but lacks enough funds and bears are pressing really hard, they will bring in external funds through the market makers. The core goal is price guidance and manipulation with added profit sharing.
Sources of funds can be divided into three types: self-funded, project tokens, and external financing. Typical operations include proactive pumping and dumping, unilateral liquidity, and the linkage between spot and derivatives. Profits come from the trading price difference and liquidation gains.
First step of operation: Control chips
Before starting work, the project team usually stockpiles over 90% of the circulating volume on-chain. These chips are controlled by multi-signature wallets and given to the market makers for execution. On-chain chips are the foundation but are not decisive, and they cannot directly indicate chip distribution.
How to identify a potential crime coin? Look for three signals.
1.: Multiple related addresses control over 90% collectively, with many being multi-signature wallets.
2: There are traces of bots making markets on-chain, which can be identified from trading volume and K-line patterns.
3: Large transfers from exchange cold wallets to on-chain addresses, as such actions are often precursors to manipulation.
Another key point is the distribution of exchange cold and hot wallets. By looking at which exchange has the largest share in the cold and hot wallets, one can judge where the spot control is concentrated. Sometimes, a low balance in hot wallets means that with very little money, they can pump the spot price, thereby influencing contract prices.
The spot operations of crime coins are mostly concentrated on Bitget, Gate, and Aster due to their relatively weak risk control and thin order books. If market makers attempt to operate on Binance, they may be blocked by position limits or withdrawal restrictions.
From an on-chain perspective, the most important thing to watch is the inflow and outflow of exchanges' cold and hot wallets. Exiting funds from cold wallets is often a sign of action. However, when project teams deposit tokens into exchanges, it doesn't necessarily mean distribution; many times, it's just to lure traders into shorting.
Contract Section: The Secrets of Mark Price and OI
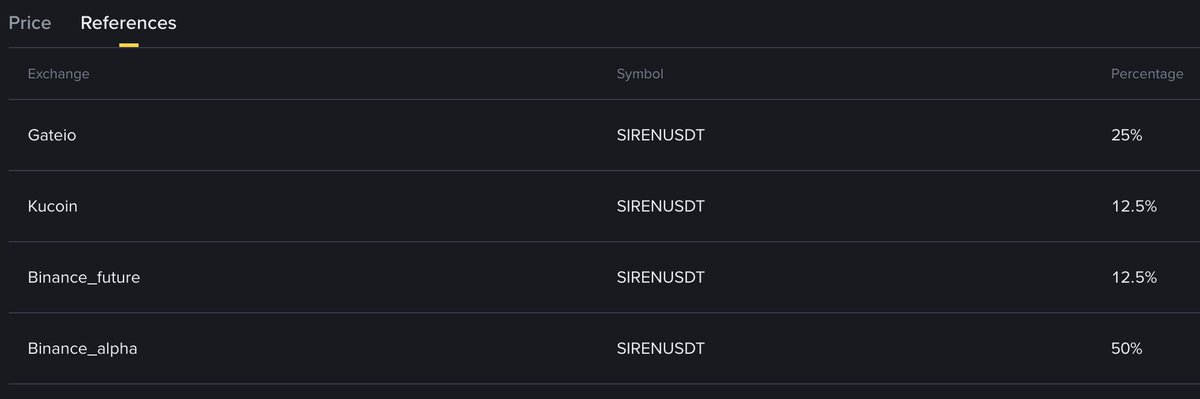
First, let's explain a basic concept. The liquidation price of contracts is calculated based on the mark price, which is an index weighted from the transaction prices of multiple exchanges. To prevent manipulation, exchanges use a weighted average. If Bitget, Gate, and similar exchanges have a significant weight in the index, the entire index becomes easier to influence. Sometimes market makers will have certain exchanges pause deposits and withdrawals, effectively isolating that market and then using the price from this isolated market to leverage Binance's contract quotes.
Next, let's talk about OI. Generally, the higher the proportion of OI to market capitalization, the more likely it is to be a crime coin. Here, OI refers to unilateral open interest. OI can also be enlarged by market makers hedging. When the book OI is high, it can attract more retail investors into the market. But how can we tell if it's fake OI hedged out?
Look at the long-short ratio. If OI significantly increases or decreases while the long-short ratio remains basically unchanged, it can be determined that the volume was hedged out by market makers on both sides. In this case, one cannot simply judge that "OI decrease means they will dump the market."
OI Determines the Lifecycle of Crime Coins
Phase One: OI Rising, Price Increasing
Bulls can easily pull prices up with little resistance. The goal is to attract bears into the market. If there aren’t enough short sellers, the market makers will directly dump the spot to liquidate the bulls.
Phase Two: Four Combinations
Bulls opening positions correspond to OI rising and price increasing.
Bears opening positions correspond to OI rising and price decreasing.
Bears closing positions correspond to OI decreasing and price increasing.
Bulls closing positions correspond to OI decreasing and price decreasing.
The changes in OI behind these scenarios have various possibilities, including market maker hedging. OI must be viewed together with price direction to have meaning.
Phase Three: Inducing Shorts During the Pump
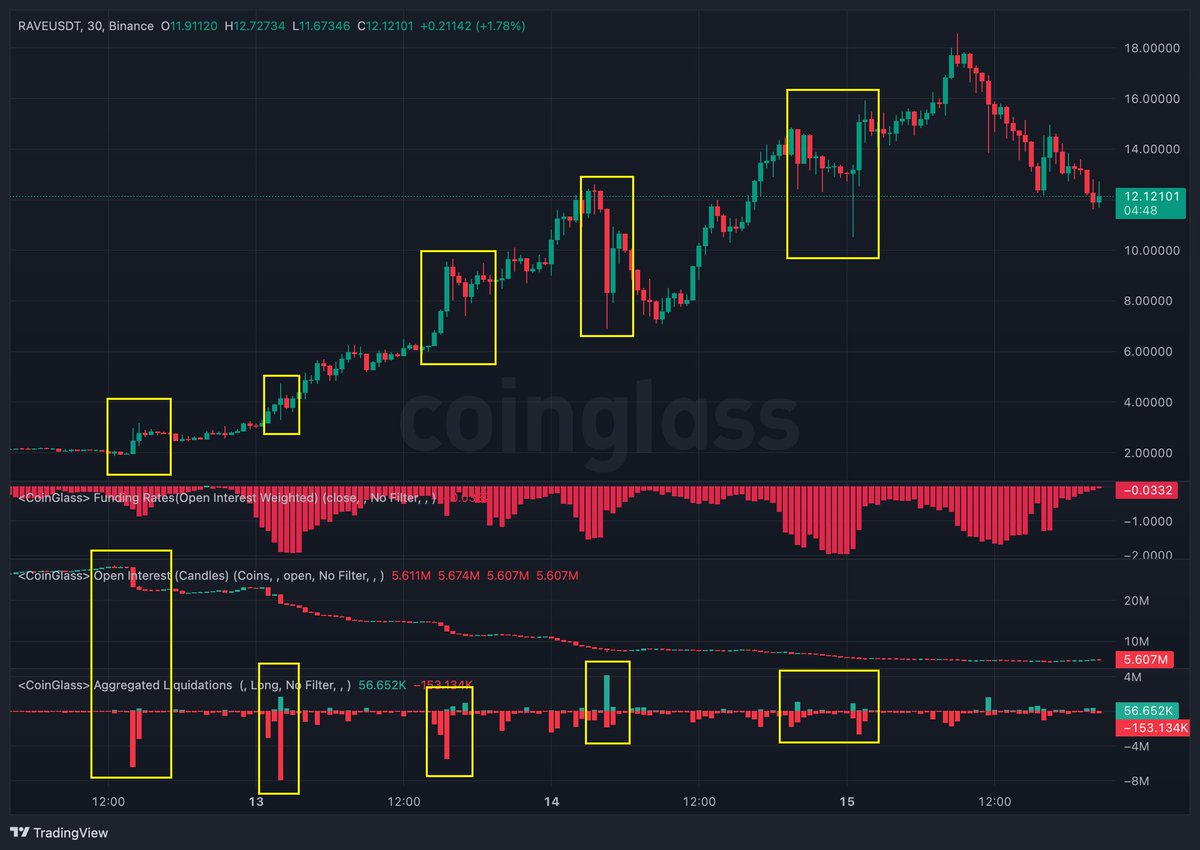
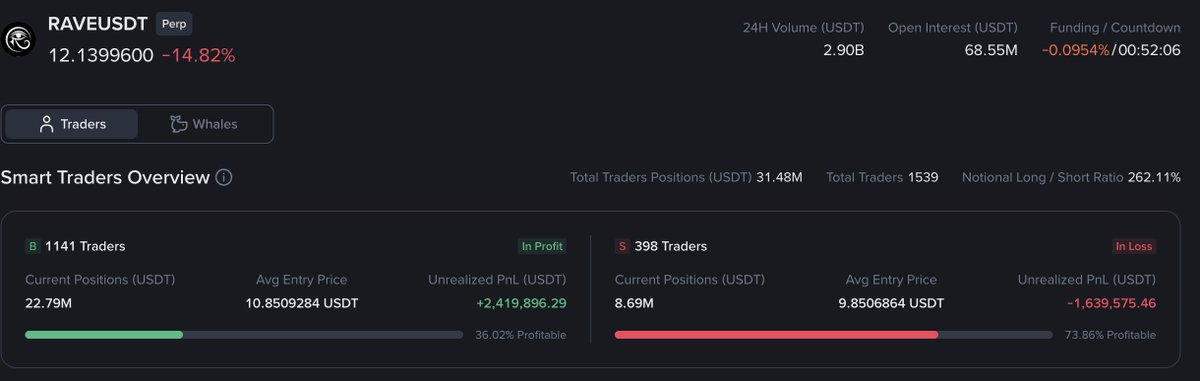
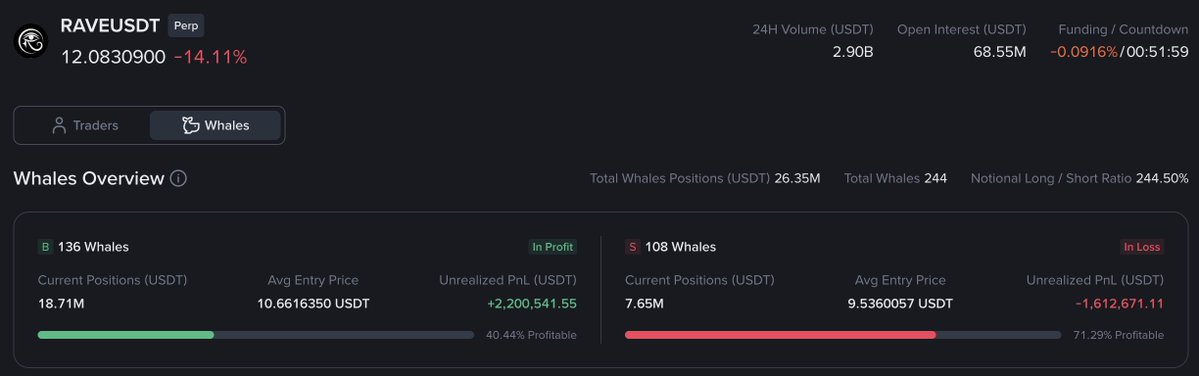
Market makers will use news, price trends, and OI data to bait short sellers. For example, in RAVE, at certain key points, market makers will close their own short positions or lift hedges, creating a false impression of OI decreasing + price decreasing + increasing trading volume, making people think the trend is over. After shorts enter the market, the price quickly reverses and continues to rise, trapping the short sellers.
Phase Four: Building Shorts, Distributing Spot
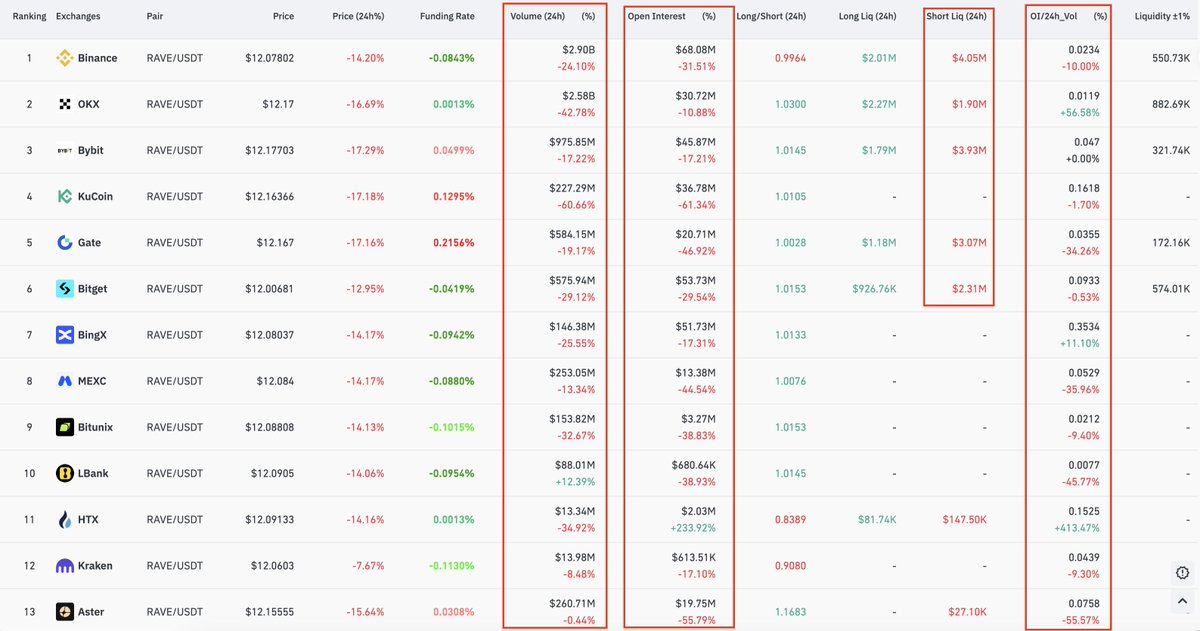
At this stage, market makers start to establish short positions, close their longs, and distribute spot. A typical characteristic is that the funding rate drops to around -2%, OI sharply decreases, and there is an inflow of spot into exchanges on-chain. OI needs to be monitored across multiple exchanges, especially Aster, because it currently has weak risk control and does not freeze market makers' assets, making it a preferred place for market makers.
Q&A: How Market Makers Attract Short Sellers
There are several common methods.
Distributing tokens to KOLs so they can hedge (essentially completing chip distribution at the same time).
Releasing unlocked negative news to encourage market hedging.
Offering high annualized staking pools, allowing people to earn APR while hedging.
Creating price differences between different exchanges to attract arbitrage traders.
Collaborating with KOL communities to spread bearish narratives.
Internal market makers at exchanges may open massive short positions using near unlimited margin.
The Play of Funding Rates
If someone has nearly unlimited margin, how do market makers make money?
They will pull spot on the exchange with the highest index weight, driving the funding rate negative. A negative funding rate means that shorts pay money to longs. With a 4-hour settlement cycle, at a -2% rate, a short seller would pay around 12% in a day.
The sources of negative funding rates can be threefold: retail selling short, market makers selling short while distributing spot, and market makers pulling spot to force short sellers to pay.
Spot and Order Book
When the exchange inventory is limited, the cost of manipulating the spot will be very low. During the pump phase, market makers will actively withdraw liquidity from the order book, making it easier to push up the price.
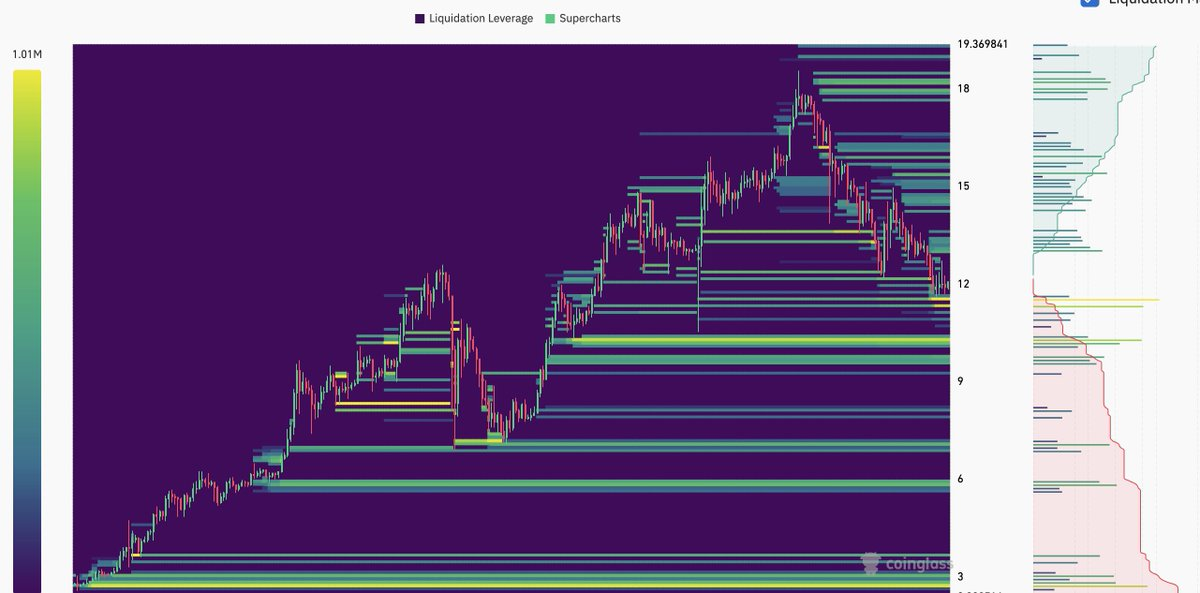
Other Data to Monitor
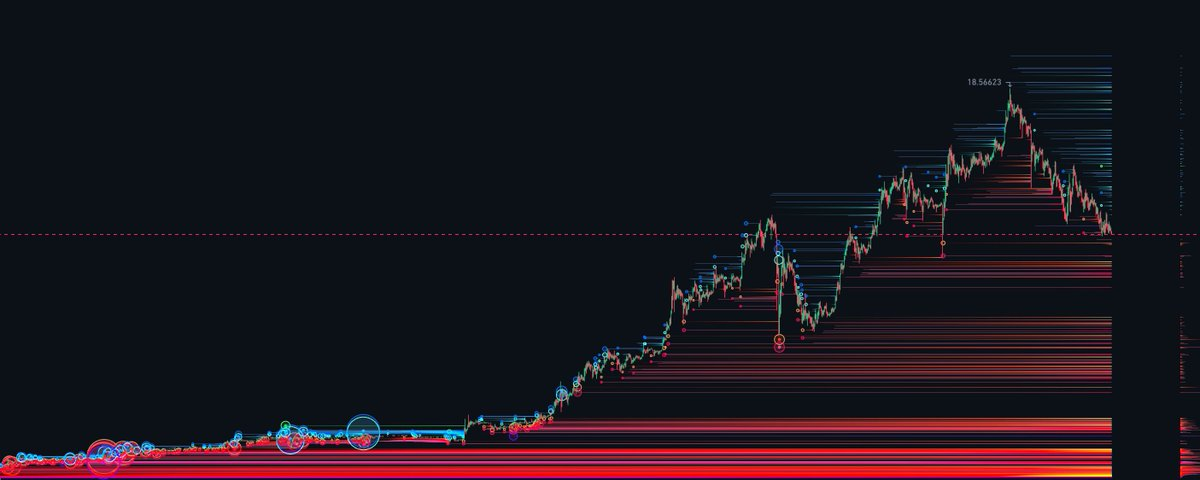
Liquidation heat map.
Order book behavior, including spoof orders.
Liquidation data.
Transaction volume, OI, and price differences between different exchanges.
$SIREN Operational Analysis
The above is just a framework; many details have been omitted due to space, which can be further broken down later.
For more details, see the author's original tweet: Original Tweet Link
免责声明:本文章仅代表作者个人观点,不代表本平台的立场和观点。本文章仅供信息分享,不构成对任何人的任何投资建议。用户与作者之间的任何争议,与本平台无关。如网页中刊载的文章或图片涉及侵权,请提供相关的权利证明和身份证明发送邮件到support@aicoin.com,本平台相关工作人员将会进行核查。


