Welcome to the Qinglan Crypto Classroom, I am Sister Qinglan. Today we will use the TPV three-point verification system to dissect the market trends thoroughly, packed with practical insights!
Step 1: First, look at the big picture (Overview of multi-period trends)
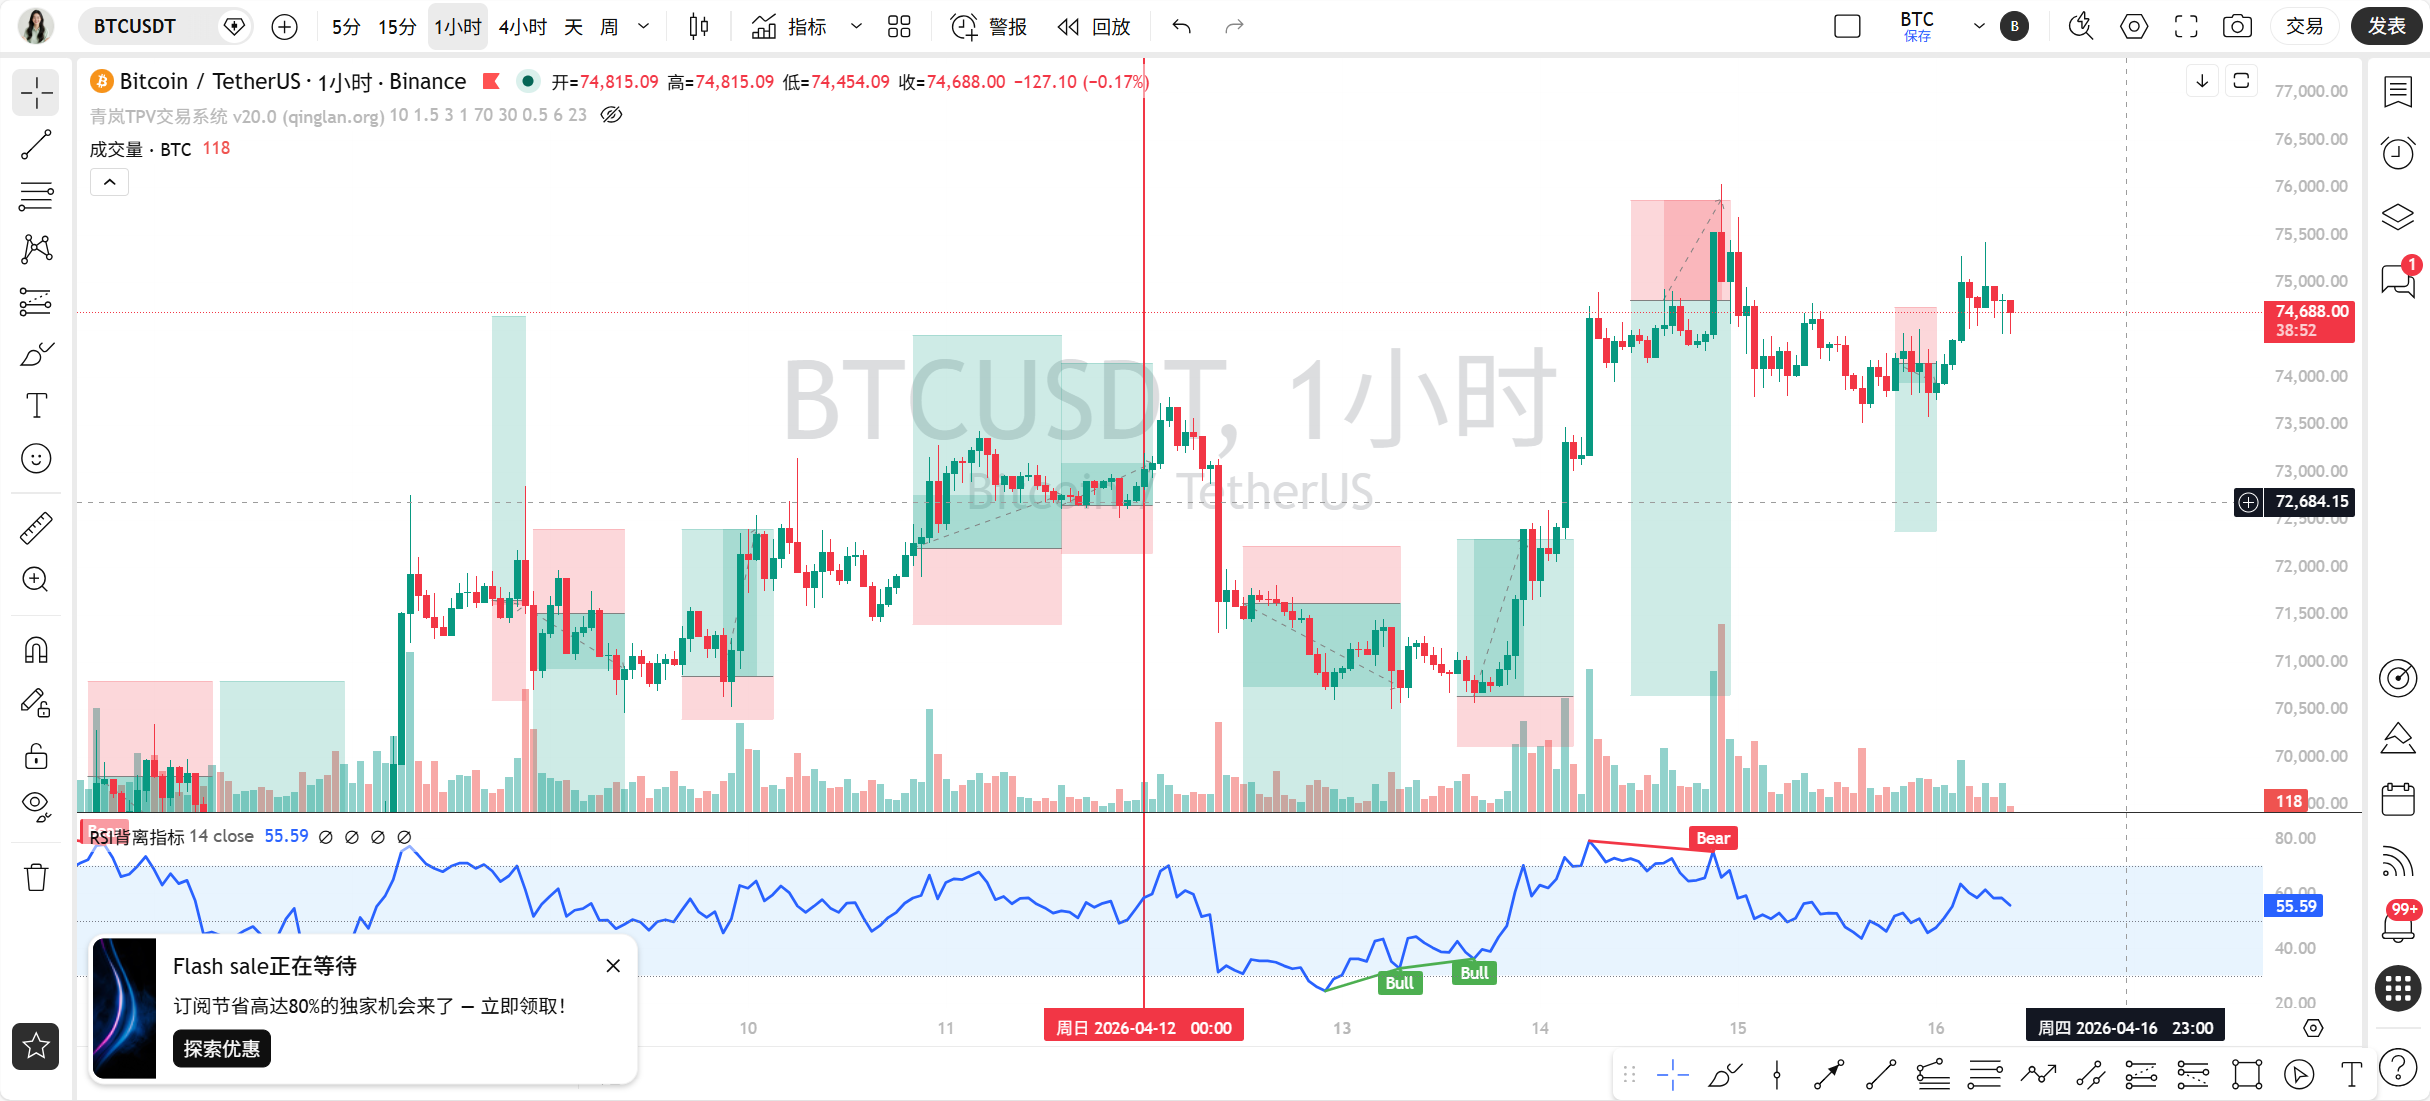
Daily line cycle: Closing price 74546.0. Moving averages are MA5=73729.30, MA10=72943.45, MA30=70018.82, in a bullish arrangement! The price is above the moving averages, the trend is upward. Key resistance is seen at the recent high of 76038.0, support is at the recent low of 73514.0. The on-chain fear and greed index is 23, extreme fear, but the long-term trend is upward, indicating a divergence between market sentiment and price, suggesting long-term funds may still be positioned.
4-hour cycle: Closing price 74546.0. Moving averages are MA5=74480.89, MA10=74415.26, MA30=73084.38, also in a bullish arrangement. The price is fluctuating around the moving averages. Key resistance is at 75281.0, support at 73514.0. The extreme fear sentiment in the market may make the upward movement in the 4-hour level seem hesitant.
1-hour cycle: Closing price 74546.0. Moving averages are MA5=74775.64, MA10=74618.88, MA30=74302.63, in a bullish arrangement. The price is slightly below MA5, indicating short-term pullback pressure. Resistance is at 76038.0, support at 73514.0.
15-minute cycle: Closing price 74546.0. Moving averages are MA5=74666.88, MA10=74725.14, MA30=74698.25, intertwining moving averages indicate that this cycle is oscillating to choose a direction. The price is below the moving averages, weak in the short term. The oscillation range can refer to recent highs and lows.
News correlation: The news mentioned “Bitcoin breaks $75,000”, which aligns with our data showing the 1-hour cycle's highest price of 76038.0 and the 4-hour highest price of 75281.0, indicating that the news drove the price to test key resistance.
Step 2: Find pivot points, draw key lines (Valid highs and lows + Trend lines)
Daily line:
Valid high (Pivot High): 76038.0 (confirmed by subsequent prices that it could not break through).
Valid low (Pivot Low): 73514.0 (recent pullback low, confirmed by rebound).
Trend line: Connects the low point of 73514.0 and the previous low point, forming an ascending trend support line, the current price is above it.
4-hour line:
Valid high (Pivot High): 75281.0 (recent high point, forming resistance).
Valid low (Pivot Low): 73514.0 (recent strong support).
Trend line: An ascending trend line drawn from the low of 73514.0, which has been tested multiple times and is effective.
1-hour line:
Valid high (Pivot High): 76038.0 (absolute high point).
Valid low (Pivot Low): 73514.0 (recent low point).
Trend line: Also focuses on the 73514.0 support line.
15-minute line:
Valid high (Pivot High): recent local high around 74815.09.
Valid low (Pivot Low): recent local low around 74454.09.
Trend line: Oscillating within a short-term converging range.
News impact: The news “Bitcoin breaks $75,000” corresponds exactly with the price testing the 76038.0 high point area, indicating that the news catalyzed the formation of the pivot high.
Step 3: Use indicators for support (Technical indicators verification)
Daily MACD: DIF=1417.09, DEA=847.33, Histogram=569.76, no cross, strong momentum, validating the bullish trend.
RSI=74.79, approaching the overbought zone, indicating that the daily level rise may be nearing its end or needs consolidation.
4-hour MACD: DIF=716.08, DEA=703.88, Histogram=12.20, no cross, weak momentum, potential top divergence (price hitting new highs but momentum weakening).
RSI=59.00, neutral to strong.
1-hour MACD: DIF=178.06, DEA=135.55, Histogram=42.51, no cross, upward momentum.
RSI=56.27, neutral.
15-minute MACD: DIF=52.81, DEA=99.42, Histogram=-46.60, no cross, downward momentum, below the zero axis.
RSI=44.52, neutral to weak.
Indicator summary: Large cycle indicators are strong, small cycle indicators are weak, indicating a conflict between periods. The high RSI on the daily level warns of risk, and the 4-hour MACD shows potential top divergence signs.
Step 4: Fundamentals of long and short (News and on-chain)
Fundamentals:
Positive: Bitcoin breaks $75,000; MicroStrategy's massive Bitcoin profits; Tether increasing BTC holdings; Federal Reserve maintains interest rates; US stock crypto sector surges; BlackRock's large BTC transfers.
Negative: Fear and greed index shows extreme fear; discussions on quantum computing threats (potentially raising long-term concerns); geopolitical uncertainties (mentioned in Federal Reserve Beige Book).
Core factors: The two most important are the technical bullishness from “Bitcoin breaks $75,000” and the extreme pessimism reflected in “Fear and greed index 23”. These two factors create a clear divergence. Expected fermentation time: The breakout news has an immediate impact, while fear sentiment is a persistent background.
Technical and fundamentals: The technical aspect (price breakout) resonates with some news (bullish), but diverges from on-chain sentiment data.On-chain data:
Fear and greed index: 23, extreme fear. This is a strong bearish sentiment signal.
BTC dominance: 57.24%, data does not show changes, but the high proportion indicates that funds are still focused on Bitcoin.
Total market value: 2.609 trillion, 24-hour change +0.19%, slight increase.
Technical and on-chain data: The price hitting new highs with extreme fear sentiment creates a significant divergence, which is a warning signal.
Step 5: The path of least resistance (Trading strategy)
In summary, the major trend is upward, but small cycles are adjusting, and market sentiment is in extreme fear, diverging from price. It is recommended to be cautious at the moment, not to chase highs.
Key entry area: If there is a pullback, pay attention to whether it stabilizes near the key support of 73514.0.
Stop-loss criteria: If going long, an effective drop below the 73514.0 support should consider a stop-loss.
Target area: Look first at 75281.0 above, then at 76038.0.
Today’s trading idea: Wait for the price to pull back to the key support area, and consider going long when combined with small cycle stabilization signals, or wait for a strong breakout of 76038.0 followed by a pullback confirmation before going long. Currently, directly chasing a surge carries a high risk.
Step 6: How will it perform today (Market forecast)
Currently (within a few hours): Expect continued oscillation at the 15-minute level, roughly between 74454.09 and 74815.09, direction unclear.
Today and recent key: The most important support level today is 73514.0, and the most important resistance level is 76038.0. Close attention is needed to the ascending trend line support drawn from 73514.0.
Trading idea: The only suitable trading direction currently is “waiting”. Reason: Although the large cycle is good, the RSI is high, small cycles are oscillating, and there is a serious divergence between market sentiment and price, requiring waiting for clearer signals, either a proper pullback or a strong breakout confirmation.
Summary: The current market's core conflict is the huge divergence between “technical price hitting new highs” and “on-chain sentiment of extreme fear”.
Trading quotation: In “extreme fear”, see “breakout”; respect both the market's emotions and the trajectory of prices.
[Qinglan TPV Trading System Backtest Data]
Based on nearly 858 historical backtests (sample size 866), the accuracy rate is 71% (last backtest time 04-16 07:00:02). The backtest results are for strategic confidence reference only, past performance does not represent future returns.
[Qinglan's Personal Opinion]
Oh, seeing such fearful sentiment in the data, yet the price is so strong, Sister Qinglan also feels a bit anxious. This indicates either smart money is quietly accumulating, while retail investors are panic selling; or this surge is a bit hollow, and a pullback could happen at any time. My takeaway is, in such a diverging market, it’s better to miss out than make a wrong move. One must wait for the market to clearly choose a direction before we follow the trend. This way, one feels more secure. Remember, the market is never short of opportunities, what’s missing is patience.
This TPV system has been honed through years of monitoring, reviewing, and practical experience. I can’t say it is 100% accurate, but it can at least provide us with more confidence at critical levels. If you want to be the first to access my latest entry opportunities captured by the TPV system, feel free to visit the Qinglan Crypto Classroom official website www.qinglan.org
免责声明:本文章仅代表作者个人观点,不代表本平台的立场和观点。本文章仅供信息分享,不构成对任何人的任何投资建议。用户与作者之间的任何争议,与本平台无关。如网页中刊载的文章或图片涉及侵权,请提供相关的权利证明和身份证明发送邮件到support@aicoin.com,本平台相关工作人员将会进行核查。