Hello everyone, I'm Sister Qinglan, welcome to the Qinglan Crypto Classroom! Today, we will use my TPV three-point verification system to thoroughly analyze the latest market data and see what kind of calculations the market is making!
Step 1: First, look at the big direction (multi-cycle trend overview)
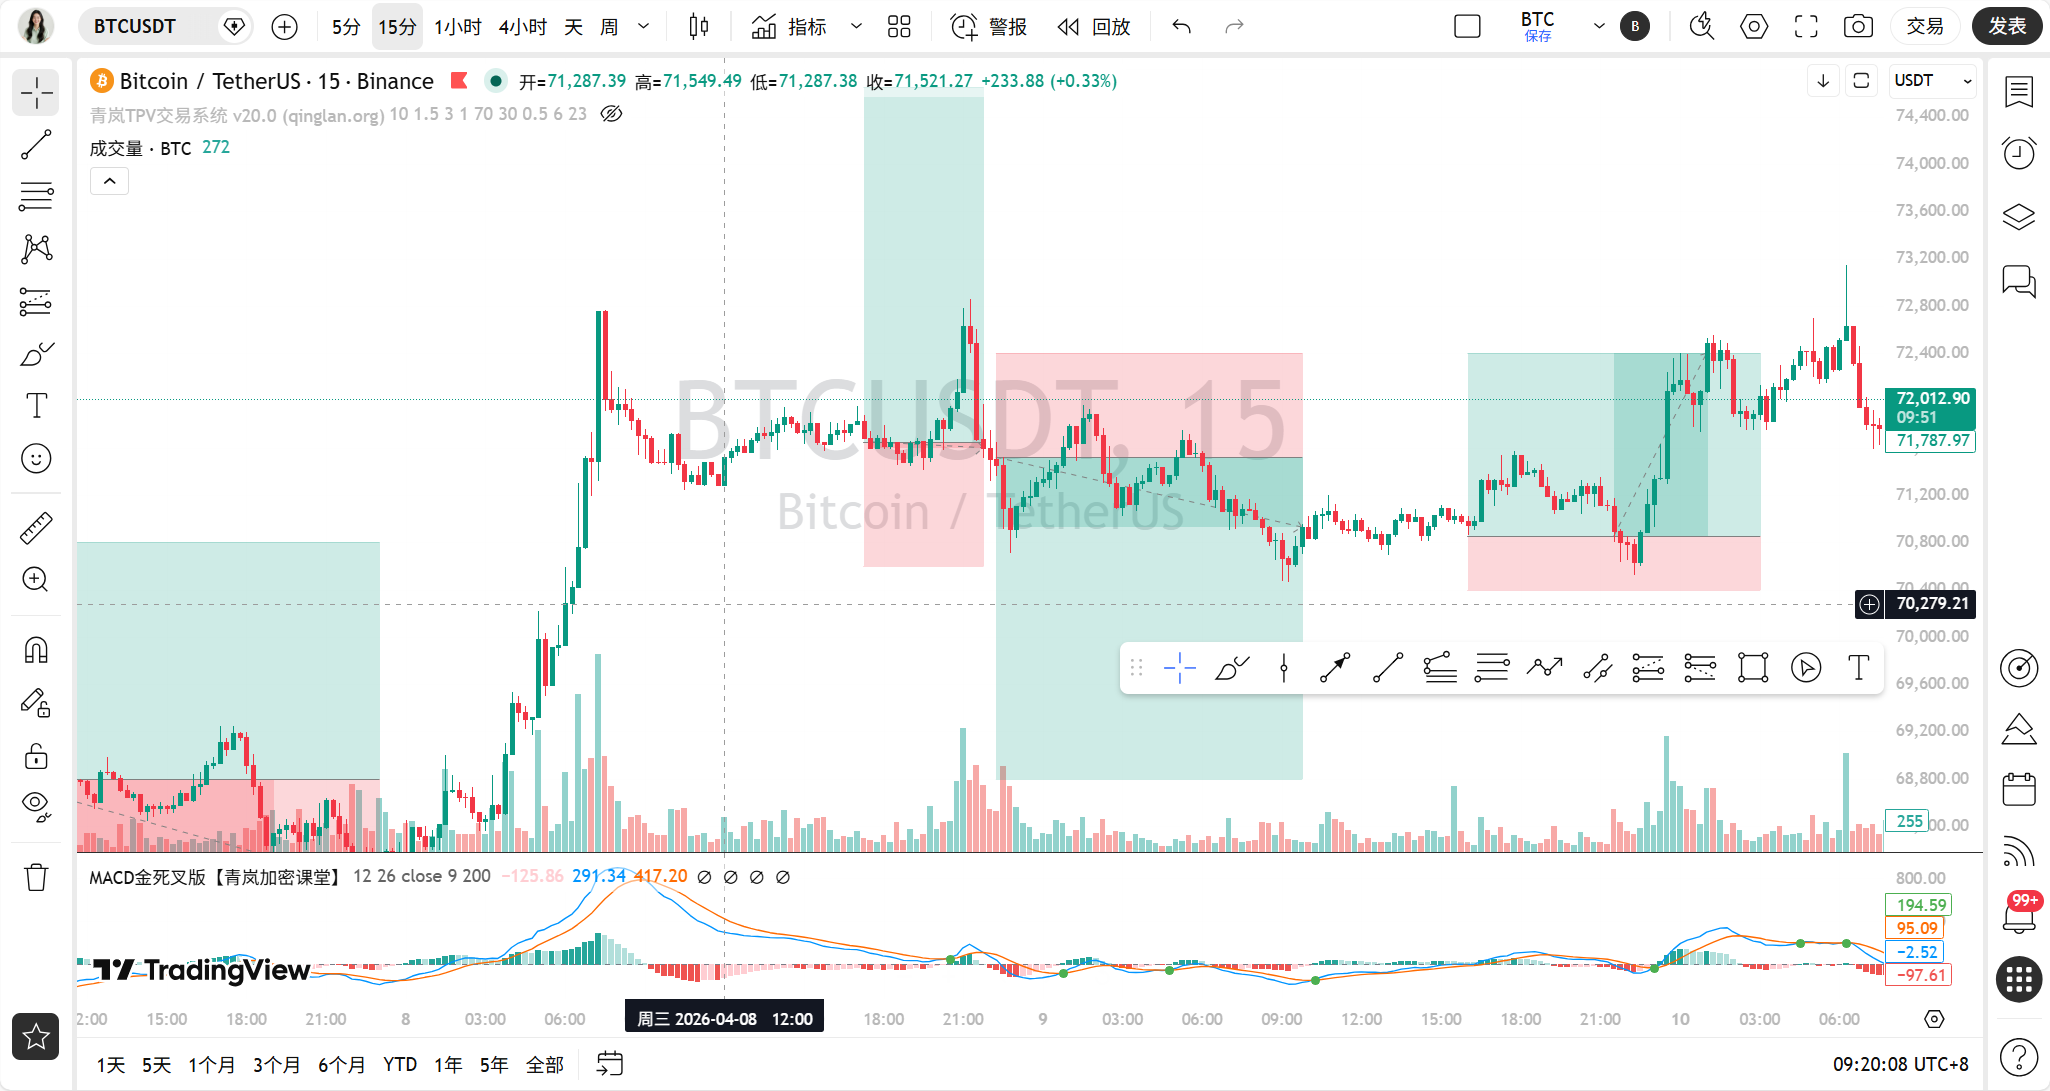
Let's look at the charts from four cycles:
Daily line cycle: closing price 72006.0. The moving average status is "moving averages intertwined," MA5 is 71128.36, MA10 is 69395.66, MA30 is 69740.36. The price is near the short-term moving average MA5, overall hovering in a large oscillation range. On-chain sentiment is "extreme fear," with an index of only 16, indicating that market sentiment is very panicked on a large scale, but the price has not fallen, which is quite interesting.
4-hour cycle: closing price 72006.0. The moving average is "bullish arrangement," MA5 is 71836.49, MA10 is 71485.53, MA30 is 69941.22. The price is above MA5, and the intermediate trend structure is slightly bullish. But it also has to face daily-level fear sentiment.
1-hour cycle: closing price 72006.0. The moving average status is "moving averages intertwined," MA5 is 71993.59, MA10 is 72079.53, MA30 is 71466.33. The price is oscillating narrowly between MA5 and MA10, with an unclear short-term direction.
15-minute cycle: closing price 72006.0. The moving average status is "moving averages intertwined," MA5 is 71910.96, MA10 is 71865.40, MA30 is 72087.48. The price is among the moving averages, which is a typical short-term oscillation pattern.
In summary: the large cycle (daily) has panic sentiment but the price resists falling, the medium cycle (4H) structure is slightly bullish, and the small cycles (1H, 15m) are caught in oscillation. The recent news of "Bitcoin breaking through $72,000" and "Middle East ceasefire expectations" are catalysts, but the market seems a bit hesitant at this position.
Step 2: Finding pivot points, drawing key lines (valid highs and lows + trend lines)
Let's find the key turning points for each cycle:
Daily line: the valid high point (Pivot High) is 73145.0 (from the highest price sequence in 1 hour), which is a strong resistance recently. The valid low point (Pivot Low) is 70466.0 (from the lowest price sequence in 4 hours), which is a key support recently. The price is currently between these two points.
4 hours: the valid high point (Pivot High) is 73145.0 (also from the highest price sequence in 1 hour). The valid low point (Pivot Low) is 71573.35 (from the lowest price sequence in 1 hour). We can draw an ascending trend line connecting the lows to observe support.
1 hour: the valid high point (Pivot High) is 73145.0. The valid low point (Pivot Low) is 71573.35. Recently, a fluctuation platform has formed from 71946.01 to 72006.0.
15 minutes: the valid high point (Pivot High) is 72783.52 (from the highest price sequence in 15 minutes). The valid low point (Pivot Low) is 70629.3 (from the lowest price sequence in 1 hour). In the short term, it is oscillating back and forth in the range of 71000 to 72500.
The news "Bitcoin breaks through $72,000" correspondingly aligns with the price hitting near the high point of 72783.52, indicating that the news has indeed pushed the price to test resistance.
Step 3: Indicators to assist (technical indicators verification)
Let's see what the indicators say:
Daily line: MACD's DIF is 491.22, DEA is -25.11, the histogram is 516.34, there is no crossover, but the bars are long above the zero axis, indicating there is upward momentum. RSI is 74.94, close to the overbought area, so be aware of potential pullback pressure.
4 hours: MACD's DIF is 910.27, DEA is 887.94, the histogram is 22.32, no crossover, the momentum is slightly bullish but the bars are very short. RSI is 73.47, also at a high level.
1 hour: MACD's DIF is 250.83, DEA is 248.57, the histogram is 2.26, almost adhesive, with no direction. RSI is 60.43, neutral to strong.
15 minutes: MACD's DIF is -25.39, DEA is 12.17, the histogram is -37.55, below the zero axis, short-term is weak. RSI is 36.47, close to the oversold area.
To verify: the large cycle indicators are bullish but RSI is high, while small cycle indicators are weak, showing potential divergence of "strong large cycle, weak small cycle," indicating that the upward momentum may not keep up at smaller levels.
Step 4: Bulls and bears wrestle (news + on-chain)
News:
Factors bullish: Bitcoin breaks through $72,000; Middle East ceasefire expectations (may alleviate risk aversion); US SEC statement on the "Clarity Act" (long-term bullish); US Treasury promotes cybersecurity sharing mechanism (favorable for compliance).
Factors bearish: fear and greed index at only 16 (extreme fear); funding rates of CEX and DEX indicate a growing bearish sentiment in the market; CME BTC futures activity hits a 14-month low, institutional funds retreat; the entire network had $101 million in liquidations in 1 hour (both bullish and bearish but leaning bearish).
The core contradiction is: positive news (breakthrough, ceasefire) has pushed prices up, but on-chain and derivatives data show that the market internally is very fearful and cautious. Technical aspects and news are somewhat "divergent," as the price has risen, but sentiment has not followed.On-chain data:
The fear and greed index is only 16, in the "extreme fear" level, which stands in stark contrast to the price hovering around $72,000, a typical "divergence." BTC's dominance is 57.15%, the data shows no change, indicating that funds have not notably flowed back from altcoins to Bitcoin. The total market value is $2.52 trillion, with a 24-hour change of 1.15%, a slight increase. On-chain data (extreme fear) and technical elements (price high level oscillation) show an obvious "divergence," which is a signal to be cautious.
Step 5: The path of least resistance (trading strategy)
Overall, the market is in a contradictory state: the medium-cycle structure is slightly bullish, but the large-cycle sentiment is extremely fearful, and the small cycles are beginning to oscillate weaker. The price is hovering below the key resistance of 73145.0. The path of least resistance may not be a direct upward breakthrough, but rather a pullback to release pressure first.
Current suggestion: Given the weakness of the small cycle and the sentiment divergence, it is not suitable to chase highs. A more prudent approach is to wait for the price to pull back to the key support area and observe for stabilization signals.
Key entry region: paying attention to the 71500-71800 area (approaching 4-hour MA10 of 71485.53 and recent low of 71573.35).
Stop-loss basis: If the price falls below the key support of 70466.0 (the daily-level low), the bullish structure may be destroyed.
Target area: First look towards the recent high near 72783.52, after breaking through then looking towards 73145.0 or even higher.
Step 6: How will it go today (market prediction)
Currently (within a few hours): It is highly likely to continue oscillating between 71500 and 72500, with a weak direction, because the 15-minute indicators are still submerged.
Today's and recent key: Today's most important support level is 71573.35 (recent valid low), followed by 70466.0 (daily-level support). The most important resistance level is 72783.52 (recent high), then 73145.0 (strong resistance). It is necessary to closely monitor the market's reaction near 71573.35.
Trade thinking: The most appropriate approach now is to "wait for a pullback to go long," rather than chase up. Reason: the medium cycle trend is still upward, but the short-term sentiment and indicators show a need for a pullback to digest. We should wait near the key support levels for a bullish defense signal.
Summary: The current market's core contradiction lies between "price resisting falling at a high level" and "market sentiment being extremely fearful."
Trading phrase: When the news is filled with "breakthrough" and "fear," the market appears to be dancing on a "ceasefire agreement," seemingly calm, but the ground underfoot may be a deep abyss; real opportunities are often hidden in the quiet stabilization at the emotional freezing point.
[Qinglan's personal view]
Oh, looking at the data, Sister Qinglan feels that the market is quite tangled right now. There are loud voices shouting "breakthrough," but the on-chain data is as cold as ice, which indicates that many people are secretly scared. My experience is that in such times, one should not rush, better to miss the 72000 than to jump in blindly during emotional divergence and get beaten up. Let's be patient and wait for the market to come to a position comfortable for both bulls and bears, such as around 71500, then see who has more strength. Remember, when others are fearful, we must remain calm, but calm does not mean diving in immediately, it means waiting for signals!
This TPV system has been honed by me through years of watching, reviewing, and practical experience, I dare not say it is 100% accurate, but at least it can give us more confidence at critical positions. If you want to be the first to get the latest entry opportunities captured by me based on the TPV system, welcome to the Qinglan Crypto Classroom official website www.qinglan.org
免责声明:本文章仅代表作者个人观点,不代表本平台的立场和观点。本文章仅供信息分享,不构成对任何人的任何投资建议。用户与作者之间的任何争议,与本平台无关。如网页中刊载的文章或图片涉及侵权,请提供相关的权利证明和身份证明发送邮件到support@aicoin.com,本平台相关工作人员将会进行核查。