Hello everyone, I am Sister Qinglan, and welcome to the Qinglan Crypto Classroom! Today we are going to use my TPV three-point verification trading system to dissect and analyze the latest market data. Without further ado, let's get started!
Step 1: First, look at the big picture (multi-cycle trend overview)
Let’s organize the key information from four cycles:
1-day cycle:
Trend: Fluctuating. The moving averages are “interlaced”, with MA5 at 69694.84, MA10 at 68553.63, and MA30 at 69628.30. The current latest closing price is 71370.19, and the price is above the moving averages.
Key support/resistance: From the data, the recent effective low point is at 67732.01 (from the 1-day lowest price series), and the effective high point is at 72761.0 (from the 1-day highest price series).
Emotional influence: The on-chain fear-greed index is 17, categorized as “extreme fear,” but the total market capitalization has increased by 3.63% in 24 hours. This indicates that in the larger cycle, the price has rebounded but emotions remain fearful, showing divergence.
4-hour cycle:
Trend: Slightly bullish. The moving averages are in a “bullish arrangement”, with MA5 at 69762.22, MA10 at 69477.70, and MA30 at 68167.07. The current latest closing price is 71361.73, and the price is far above the moving averages.
Key support/resistance: The recent effective low point is at 67732.01 (from the 4-hour lowest price series), and the effective high point is at 72761.0 (from the 4-hour highest price series).
Emotional influence: The price is strong, but news mentions “the crypto fear index rises to 17,” indicating that market sentiment is recovering but has not reached greed, resonating with the price increase.
1-hour cycle:
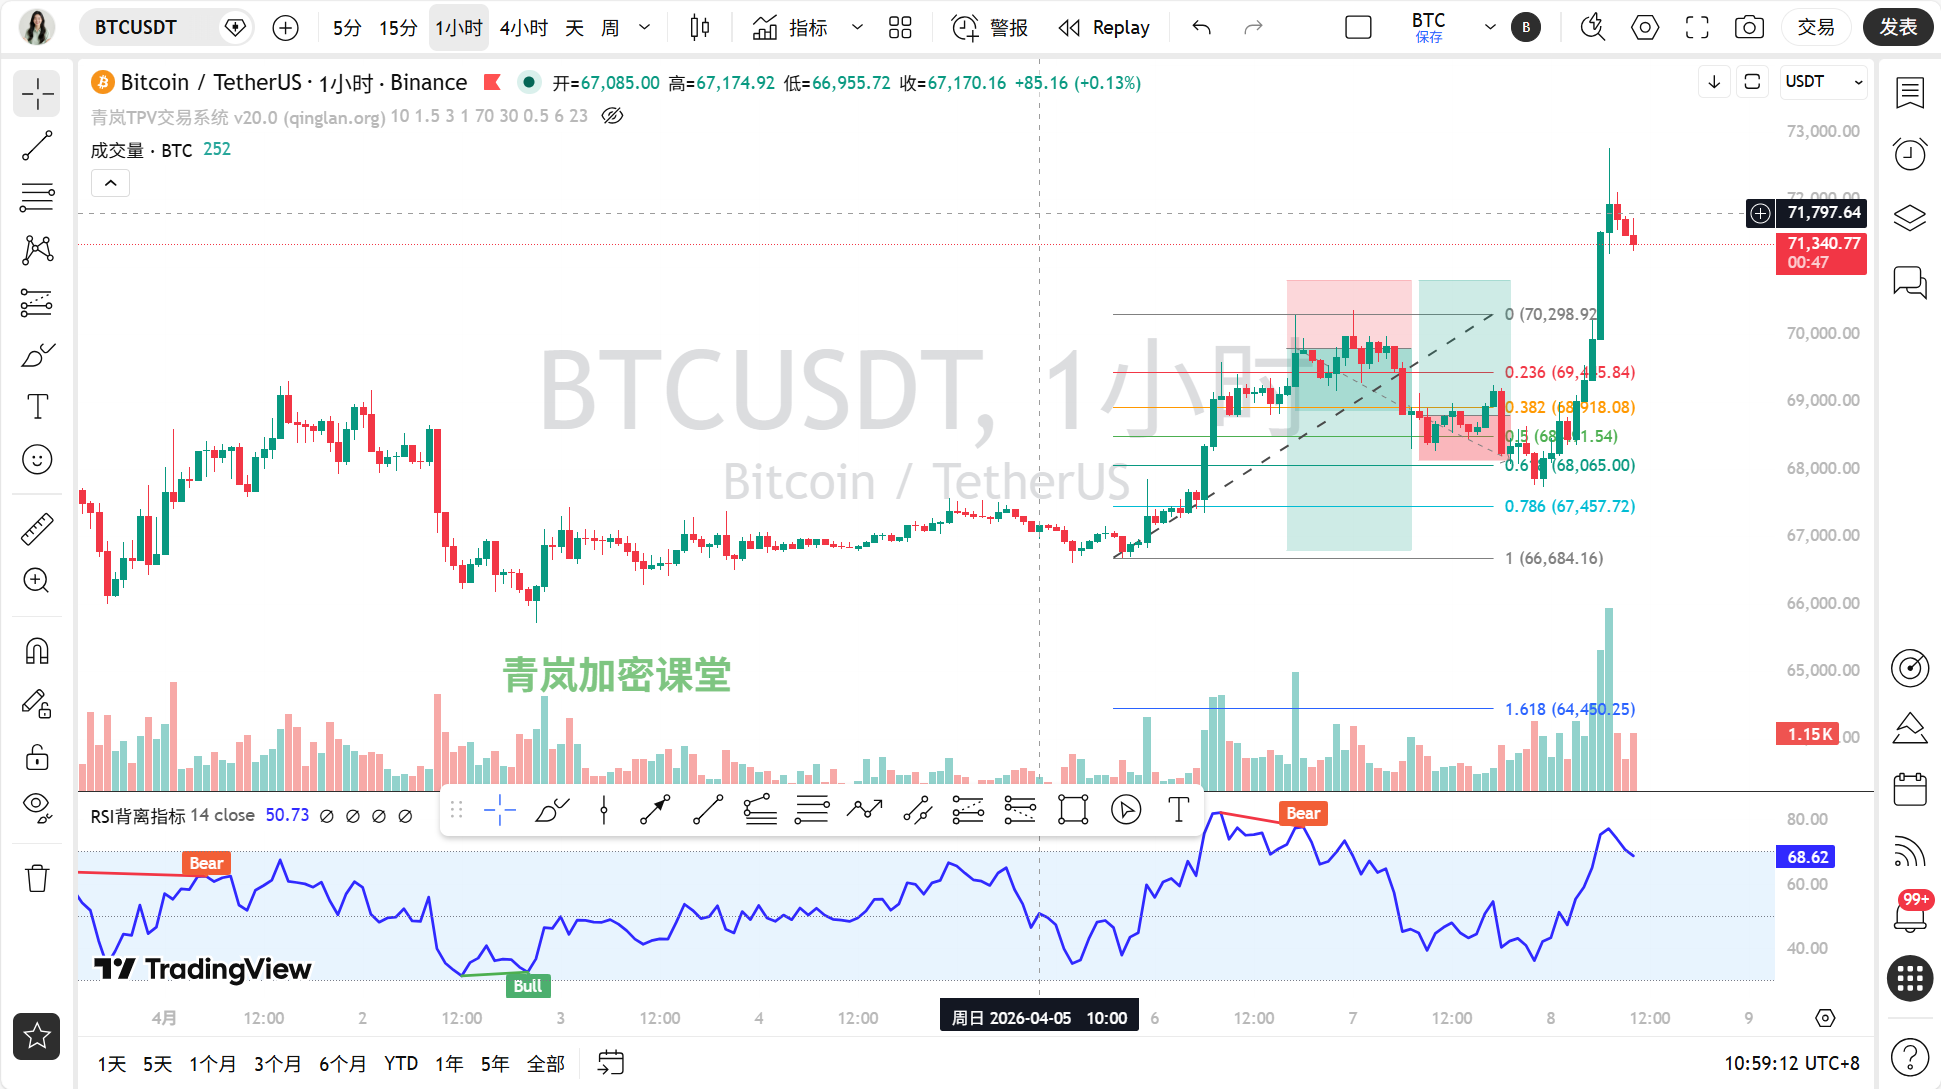
Trend: Strong bullish. The moving averages are in a “bullish arrangement,” with MA5 at 71599.13, MA10 at 70340.23, and MA30 at 69182.36. The current latest closing price is 71370.19, and the price is above the moving averages.
Key support/resistance: The recent effective low point is at 67732.01 (from the 1-hour lowest price series), and the effective high point is at 72761.0 (from the 1-hour highest price series).
Emotional influence: This cycle has the strongest upward momentum, with news headlines such as “Bitcoin breaks $71,000,” showing a clear warming of short-term sentiment, resonating with the price trend.
15-minute cycle:
Trend: Pullback. The moving averages are “interlaced,” with MA5 at 71469.42, MA10 at 71553.81, and MA30 at 70831.62. The current latest closing price is 71370.19, and the price is slightly below the short-term moving averages.
Key support/resistance: The recent effective low point needs to be found from the series, for example, 68811.0 (15-minute closing price series) and effective high point such as 72753.27 (15-minute closing price series).
Emotional influence: The small cycle is adjusting, and the on-chain data has not changed much, indicating a normal technical pullback.
News connection: The news “Temporary ceasefire between the U.S. and Iran causes oil to plummet 15%, Bitcoin breaks $72,000” and “Middle East tensions cooling, Bitcoin breaks $71,000” directly relates the easing geopolitical situation to this wave of Bitcoin's rise, acting as an important catalyst.
Step 2: Find support points, draw key lines (effective high and low points + trend lines)
Let’s find the support points for each cycle:
1-day line:
Effective high point: 72761.0 (from the 1-day highest price series, recent high).
Effective low point: 67732.01 (from the 1-day lowest price series, a significant low point recently).
Trend line: Connect the low point 67732.01 and high point 72761.0 to draw a short-term upward channel. The price is currently within this channel.
4-hour line:
Effective high point: 72761.0 (from the 4-hour highest price series).
Effective low point: 67732.01 (from the 4-hour lowest price series).
Trend line: Similarly, connect 67732.01 and the recent low point, forming an upward support line. The price is currently near the upper rail of the channel.
1-hour line:
Effective high point: 72761.0 (from the 1-hour highest price series).
Effective low point: 67732.01 (from the 1-hour lowest price series).
Trend line: The upward trend is very clear, and the effectiveness of the support points is high.
15-minute line:
Effective high point: 72753.27 (from the 15-minute closing price series, close to the highest).
Effective low point: 68811.0 (from the 15-minute closing price series, a clear pullback low point).
Trend line: The small cycle is pulling back after making a new high; can draw a small-level upward trend line or horizontal support.
News impact: The news about the easing of geopolitical tensions coincidentally appeared when the price began to rebound from the low point of 67732.01 and broke through key pressures, which can be said to have boosted the effectiveness of the support point (low point) and accelerated the rise.
Step 3: Indicators to assist (technical indicators verification)
Let’s see what the indicators say:
1-day line:
MACD: DIF is 114.11, DEA is -291.24, and the histogram is 405.34, with no crossing state. The momentum histogram is positive, but the dual lines remain below the zero axis, indicating that the larger trend is still under repair.
RSI: The value is 50.08, in the neutral range, without overbought or oversold conditions.
Verification: The indicators are basically synchronized with the price rebound but have not entered the strong zone.
4-hour line:
MACD: DIF is 745.34, DEA is 507.82, and the histogram is 237.52, with no crossing state. The dual lines are above the zero axis, and the histogram is positive, indicating bullish momentum.
RSI: The value is 72.88, close to the overbought area, signaling that short-term increases may lack strength.
Verification: The indicators confirmed the upward trend, but the high RSI warns of potential pullback.
1-hour line:
MACD: DIF is 712.02, DEA is 370.15, and the histogram is 341.87, with no crossing state. The dual lines are high above the zero axis, showing strong momentum.
RSI: The value is 76.23, having entered the overbought area.
Verification: The indicators show that short-term bulls are extremely strong, but the seriously overbought RSI suggests immense adjustment pressure. There is potential risk of a top divergence (new price high, but RSI may not sync with the new high or start turning downward).
15-minute line:
MACD: DIF is 447.44, DEA is 595.84, and the histogram is -148.40, with no crossing state. DIF is below DEA, and the histogram is negative, indicating short-term adjustment momentum.
RSI: The value is 16.41, in severe oversold territory.
Verification: The small cycle indicators show that a deep adjustment is underway, and the oversold RSI may trigger a minor rebound.
Divergence situation: There may be a top divergence between the RSI (76.23) of the 1-hour cycle and the new price high (72761.0), and it needs to be observed whether the RSI follows if the price makes a new high.
Step 4: Bull and bear face-off (news + on-chain)
News front:
Positive factors:
“Temporary ceasefire between the U.S. and Iran” and “Middle East tensions cooling” reduce safe-haven demand, benefiting risk assets (including Bitcoin).
Headlines like “Bitcoin breaks $71,000/$72,000” create a strong bullish atmosphere.
The “crypto fear index rises to 17” shows that market sentiment is recovering from extreme fear.
Negative factors:
“Miners sell 265 BTC after two years of silence, cashing out $18.06 million” increases supply pressure.
“Contract whale closes BTC long positions with profits over $12 million, securing gains” indicates some large capital is taking profits.
“Fed interest rate cut expectations rise, with a potential 17 basis point cut this year” is a macro benefit in the medium to long term but does not have a direct short-term impact.
Core factor: The most important is the “U.S.-Iran ceasefire” geopolitical benefit, which has been evolving over the last day or two, directly driving this wave of increase. The strong upward momentum from the technical perspective resonates with this news.On-chain data:
The fear-greed index is at 17 (extreme fear), but the news says “it has risen to 17,” indicating that it has come up from a lower range of 9-12, showing sentiment is improving, but it still resides in the fear zone. This creates a clear divergence with the significant price increase (price rises, but sentiment remains fearful).
Bitcoin's dominance is at 56.72%, with no change reported, indicating that Bitcoin still holds a dominant position in the market.
Total market capitalization is $2.52 trillion, a 3.63% increase in 24 hours, showing that funds are flowing into the market.
Judgment: On-chain data shows that funds are flowing in (market cap up), but sentiment indicators (fear-greed index) lag seriously behind price performance, suggesting a divergence which implies either sentiment will catch up or price may pull back to wait for sentiment to recover.
Step 5: The path of least resistance (trading strategy)
Overall, the medium and long-term trend is improving, but the short term (especially the 1-hour) indicators are seriously overbought, and sentiment is diverging from the price. The path of least resistance may not be to continue chasing higher but to wait for a pullback.
Trade direction suggestion: Temporarily observe, or wait for a pullback to long.
Key entry regions: Focus on the moving average support at the 4-hour and 1-hour levels, for example, around the 1-hour MA30 (69182.36) or the previous low point areas of 68811.0 and 67732.01.
Stop loss basis: If going long, the stop loss should be placed below the key support, such as below 67732.01.
Target region: Preliminary target can be around the previous high of 72761.0, and after breaking through, aim for higher.
Step 6: How will today go (market prediction)
Currently (in a few hours): The ultra-short-term (15-minute) RSI has been oversold, suggesting a small rebound may happen, but overall is expected to fluctuate between 71000-72000, leaning towards downward adjustment.
Key for today and recent future:
The most important support levels: 68811.0 (recent 15-minute low) and 67732.01 (effective low point on the daily level).
The most important resistance level: 72761.0 (recent absolute high).
The trend line to pay attention to is the upward trend line support formed by connecting 67732.01 and the recent low points.Trade thinking: The currently most appropriate single trading direction is “wait for a pullback to go long.” The reason is that the large cycle trend has improved, the news is positive, but the short-term rise has been too fast, the indicators are overbought, and sentiment is diverging, requiring a healthy pullback to release risk and let sentiment catch up.
Summary: The current core contradiction in the market is the “rapid price rise versus overbought technical indicators and lagging market sentiment.”
Trading quote: Geopolitical “ceasefire” ignites market fire, but emotional “fear” warns against chasing highs; the market always moves forward when many hesitate and rests when there is uniform frenzy.
[Qinglan TPV trading system backtesting data]
Based on nearly 672 historical backtests (sample size 680), the accuracy rate is 69.3% (last backtesting time 04-08 07:00:01). Backtesting results are for strategy confidence reference only; past performance does not guarantee future profits.
[Qinglan's Personal Opinion]
Oh, seeing the chart rise so much, I know many friends are itching to chase. But from my experience, such rapid rises, especially with the RSI running to 76, often need a breather. There’s no rush; the market won’t close its doors. Wait for it to retest key support, like around 69000 or 68000, then look for opportunities—this will provide a much better risk-reward ratio. Remember, good things come to those who wait; patience is the best friend of traders.
This TPV system is something I have accumulated through years of observing, reviewing, and practicing; I won’t claim it’s 100% accurate, but it at least gives us extra confidence at critical positions. If you want to be the first to capture the latest entry opportunities based on the TPV system, welcome to visit the Qinglan Crypto Classroom official website www.qinglan.org
免责声明:本文章仅代表作者个人观点,不代表本平台的立场和观点。本文章仅供信息分享,不构成对任何人的任何投资建议。用户与作者之间的任何争议,与本平台无关。如网页中刊载的文章或图片涉及侵权,请提供相关的权利证明和身份证明发送邮件到support@aicoin.com,本平台相关工作人员将会进行核查。