Chasing the Waves of Cryptocurrency: 3.25 Cryptocurrency Bitcoin (BTC), Ethereum (ETH) Latest Evening Market Analysis Reference, News Interpretation
Chasing the Waves of Cryptocurrency: 3.25 Bitcoin (BTC) Market Analysis Reference:
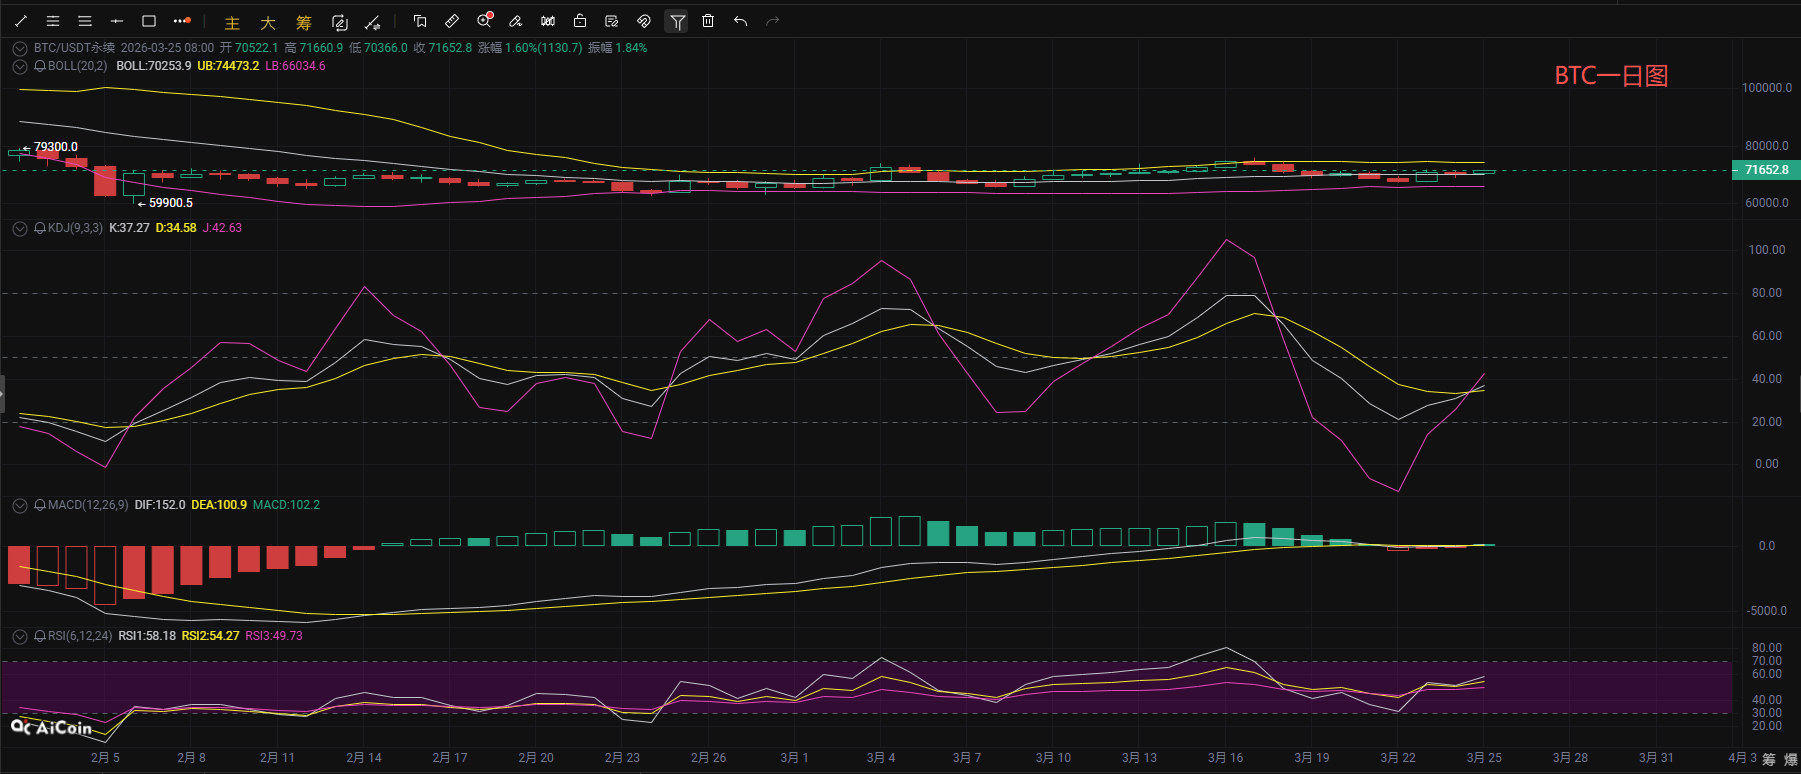
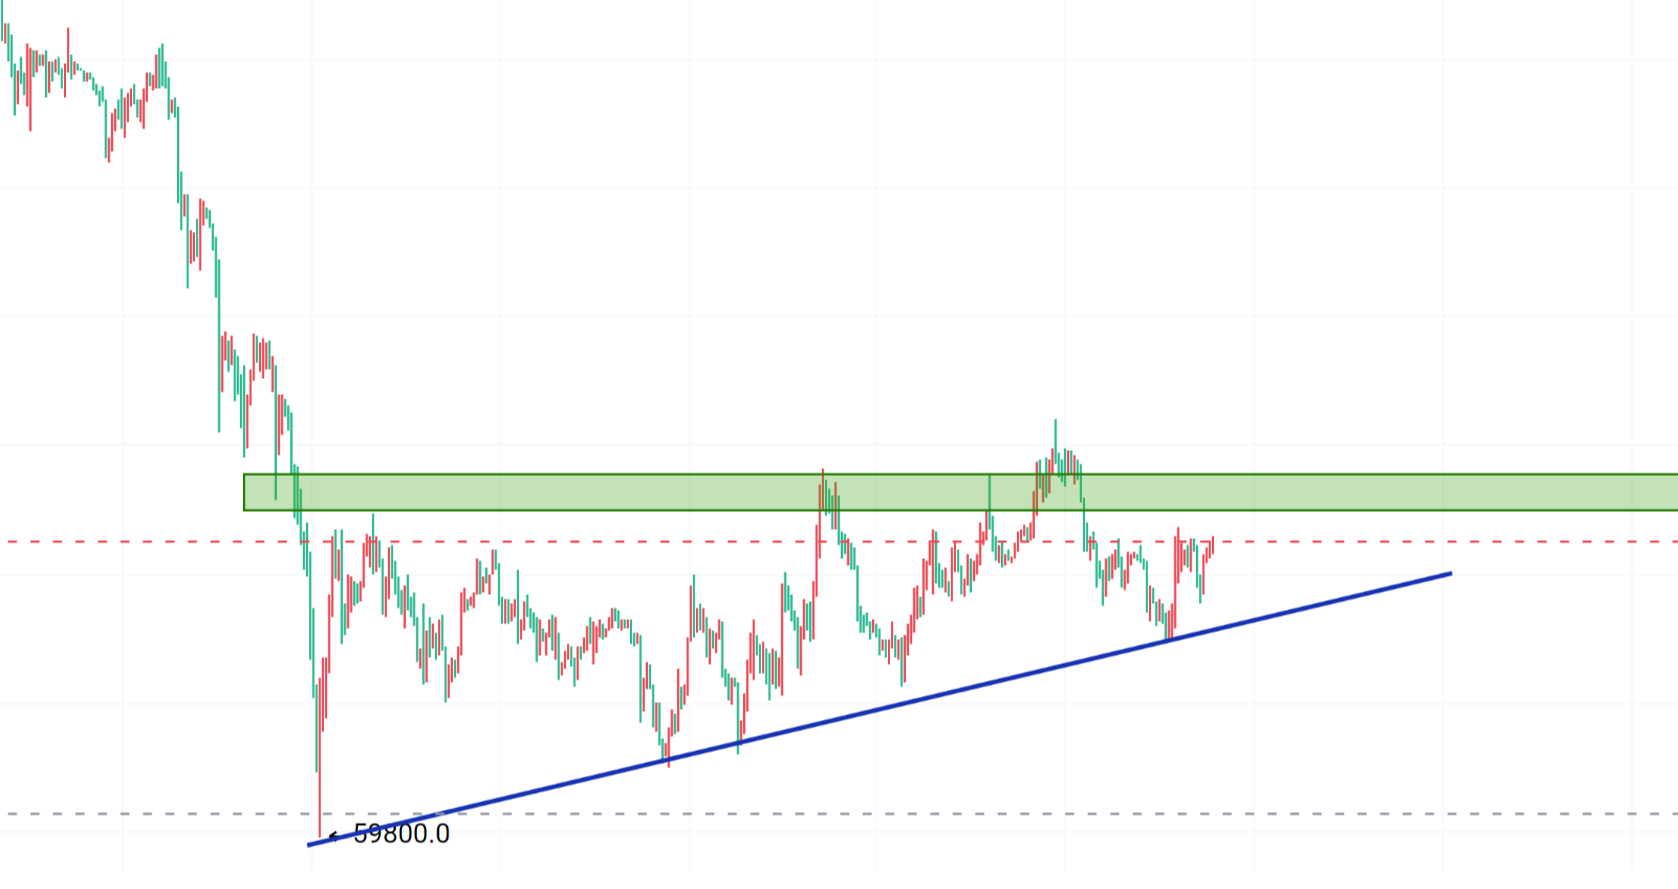
Bitcoin pulled back overnight yesterday to test the lower support, stabilized, and then made a slight rebound. The daily market continued to show narrow fluctuations and repair movements. As of the time of writing, the price is running around 71600. Looking at the daily chart of Bitcoin, the current price is operating above the dense area of short-term EMA moving averages and the middle rail of the Bollinger Bands, while the long-term EMA120 remains high and forms resistance. The medium-term trend is biased towards fluctuation. In terms of technical indicators, the three KDJ lines have turned up at the low level, forming a golden cross prototype, indicating that short-term bullish momentum has accumulated; the DIF and DEA of MACD are sticking together above the zero axis, and the bars have turned positive, showing that bullish strength is gradually recovering; the three lines of RSI maintain around 50 in the neutral zone, with no obvious overbought or oversold conditions. Overall, in the short term, there may be a slight rebound driven by the KDJ golden cross, but the MACD decreasing volume and neutral RSI limit the height of the rebound. The upward pressure in the medium term focuses on the upper rail of the Bollinger Bands, while the short-term support level to pay attention to is around 70000.
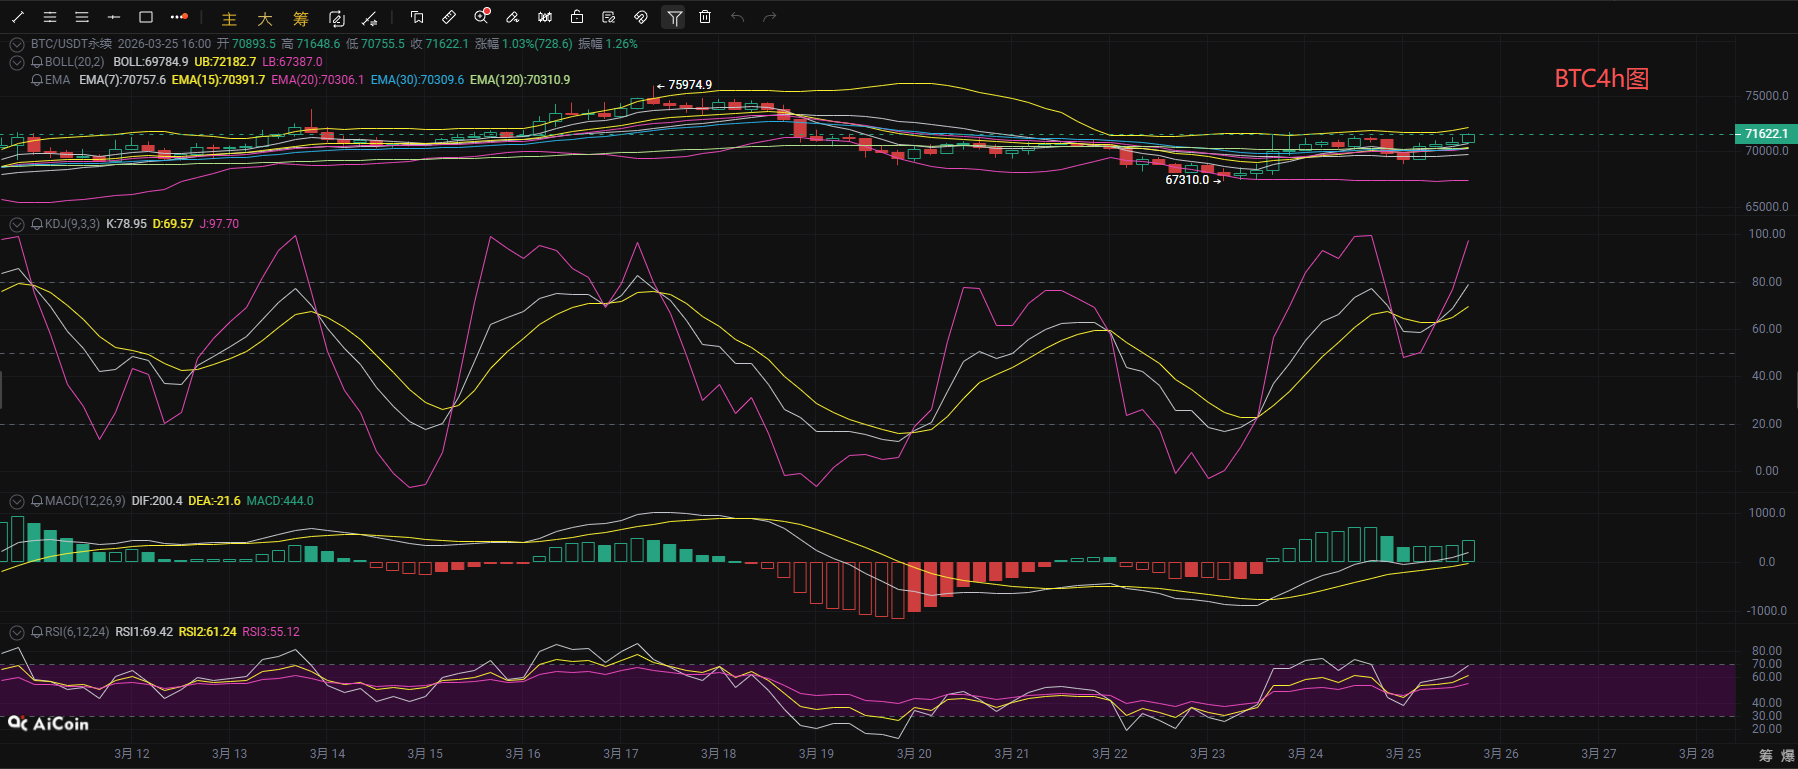
From the 4-hour chart of Bitcoin, the current price is stabilized above the EMA moving average and the middle rail of the Bollinger Bands, with the short-term moving averages showing a bullish arrangement. Long-term EMA120 (70300) provides support, and the short-term trend is bullish. In technical indicators, the three KDJ lines are diverging upwards from a high position, with the J value approaching the overbought area, indicating that short-term bullish momentum is abundant but shows signs of overheating; the DIF and DEA of MACD have formed a golden cross, and the positive bars continue to expand, confirming the continuation of the bullish trend; the three lines of RSI are generally rising, with RSI1 entering the strong zone. Overall judgment indicates that the price is expected to maintain a rebound in the short term, but the upper Bollinger band line (72000) and previous high points constitute direct pressure. If it cannot effectively break through, attention should be focused on the lower support level of the 70500-70000 range, and the operational suggestion is to lay out by buying on dips at low levels.
Chasing the Waves of Cryptocurrency: 3.25 Bitcoin Short-term Reference:
Long position: Buy in the range of 69300-70300, stop loss 500 points, target look at 71300-72000,
Short position: Sell in the range of 72000-73000, stop loss 500 points, target look at 71500-70500,
Chasing the Waves of Cryptocurrency: 3.25 Ethereum (ETH) Market Analysis Reference:
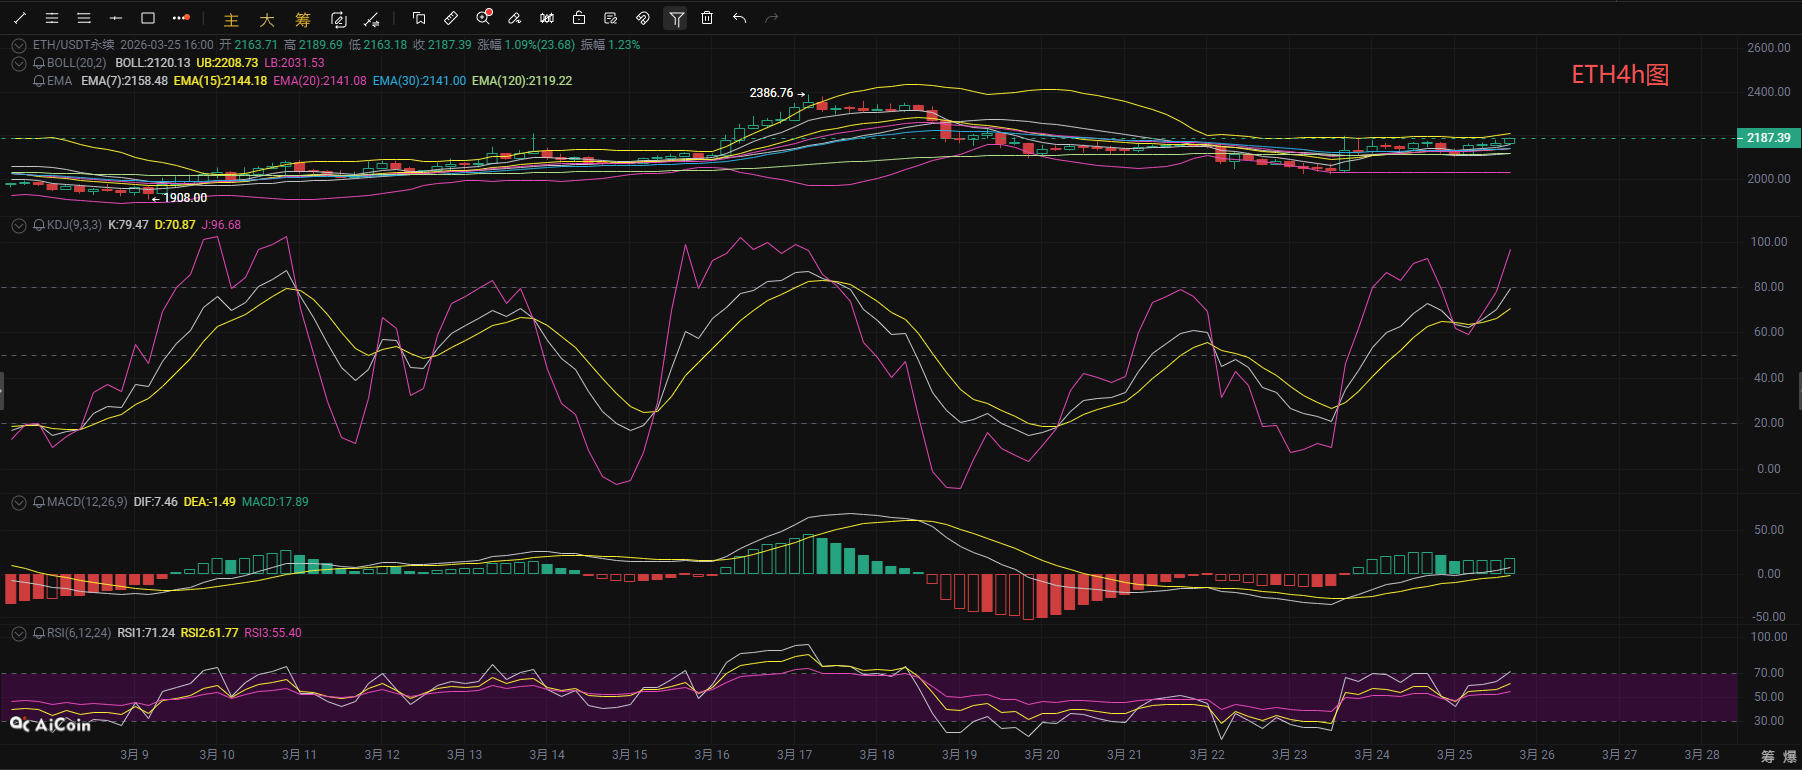
From the 4-hour chart, the current price of ETH is stabilizing above the middle rail of the Bollinger Bands. The three KDJ lines are all at a high level and diverging upwards, entering the overbought area; the MACD indicator's DIF has crossed above DEA to form a golden cross, with the volume bars gradually expanding, indicating bullish momentum is being gradually released; the RSI indicator is also in the strong range, showing a clear medium-term bullish trend, but caution is needed for the overbought signal and potential pullback risks. On the 1-hour chart, the price is running closely along the upper rail of the Bollinger Bands, and the short-term trend is strong; the KDJ indicator is also at a high level, showing slight signs of turning; the MACD golden cross continues, with volume gently expanding, and RSI1 entering the overbought zone, indicating strong short-term bullish momentum but with pullback pressure. In summary, the 4-hour cycle establishes a bullish pattern in the medium term, while the 1-hour cycle maintains strength but accumulates overbought signals. It is expected that the price will first test the upper rail pressure of the Bollinger Bands, and if it can effectively break through, it will look toward previous high points; if it is under pressure and falls back, the support level below is the middle rail of the Bollinger Bands (2109/2151). It is necessary to pay attention to the pullback risks after the overbought conditions, and the overall bullish outlook remains unchanged.
Chasing the Waves of Cryptocurrency: 3.25 Ethereum Short-term Reference:
Short position: Sell in the range of 2190-2220, stop loss 30 points, target look at 2160-2110,
Long position: Buy in the range of 2110-2140, stop loss 30 points, target look at 2170-2220,
[The above analysis and strategies are for reference only. Please bear the risks yourself. The publication of the article may have delays, and the strategies may not be timely. Do not operate blindly.]

The content of this article is originally shared by [Chasing the Waves of Cryptocurrency] and represents personal opinions only. There may be delays in sending the article, it is for reference only, and do not operate blindly! Do you want to get more daily real-time signals? Then follow my public account! Here, you can conduct online technical learning and understand knowledge related to exiting positions. I have many years of research experience in the market, focusing on the overall trend of the cryptocurrency space. My main responsibility is to analyze and guide the investment operations of BTC, ETH, SOL, BCH, and other cryptocurrencies. Welcome to study together.
免责声明:本文章仅代表作者个人观点,不代表本平台的立场和观点。本文章仅供信息分享,不构成对任何人的任何投资建议。用户与作者之间的任何争议,与本平台无关。如网页中刊载的文章或图片涉及侵权,请提供相关的权利证明和身份证明发送邮件到support@aicoin.com,本平台相关工作人员将会进行核查。