
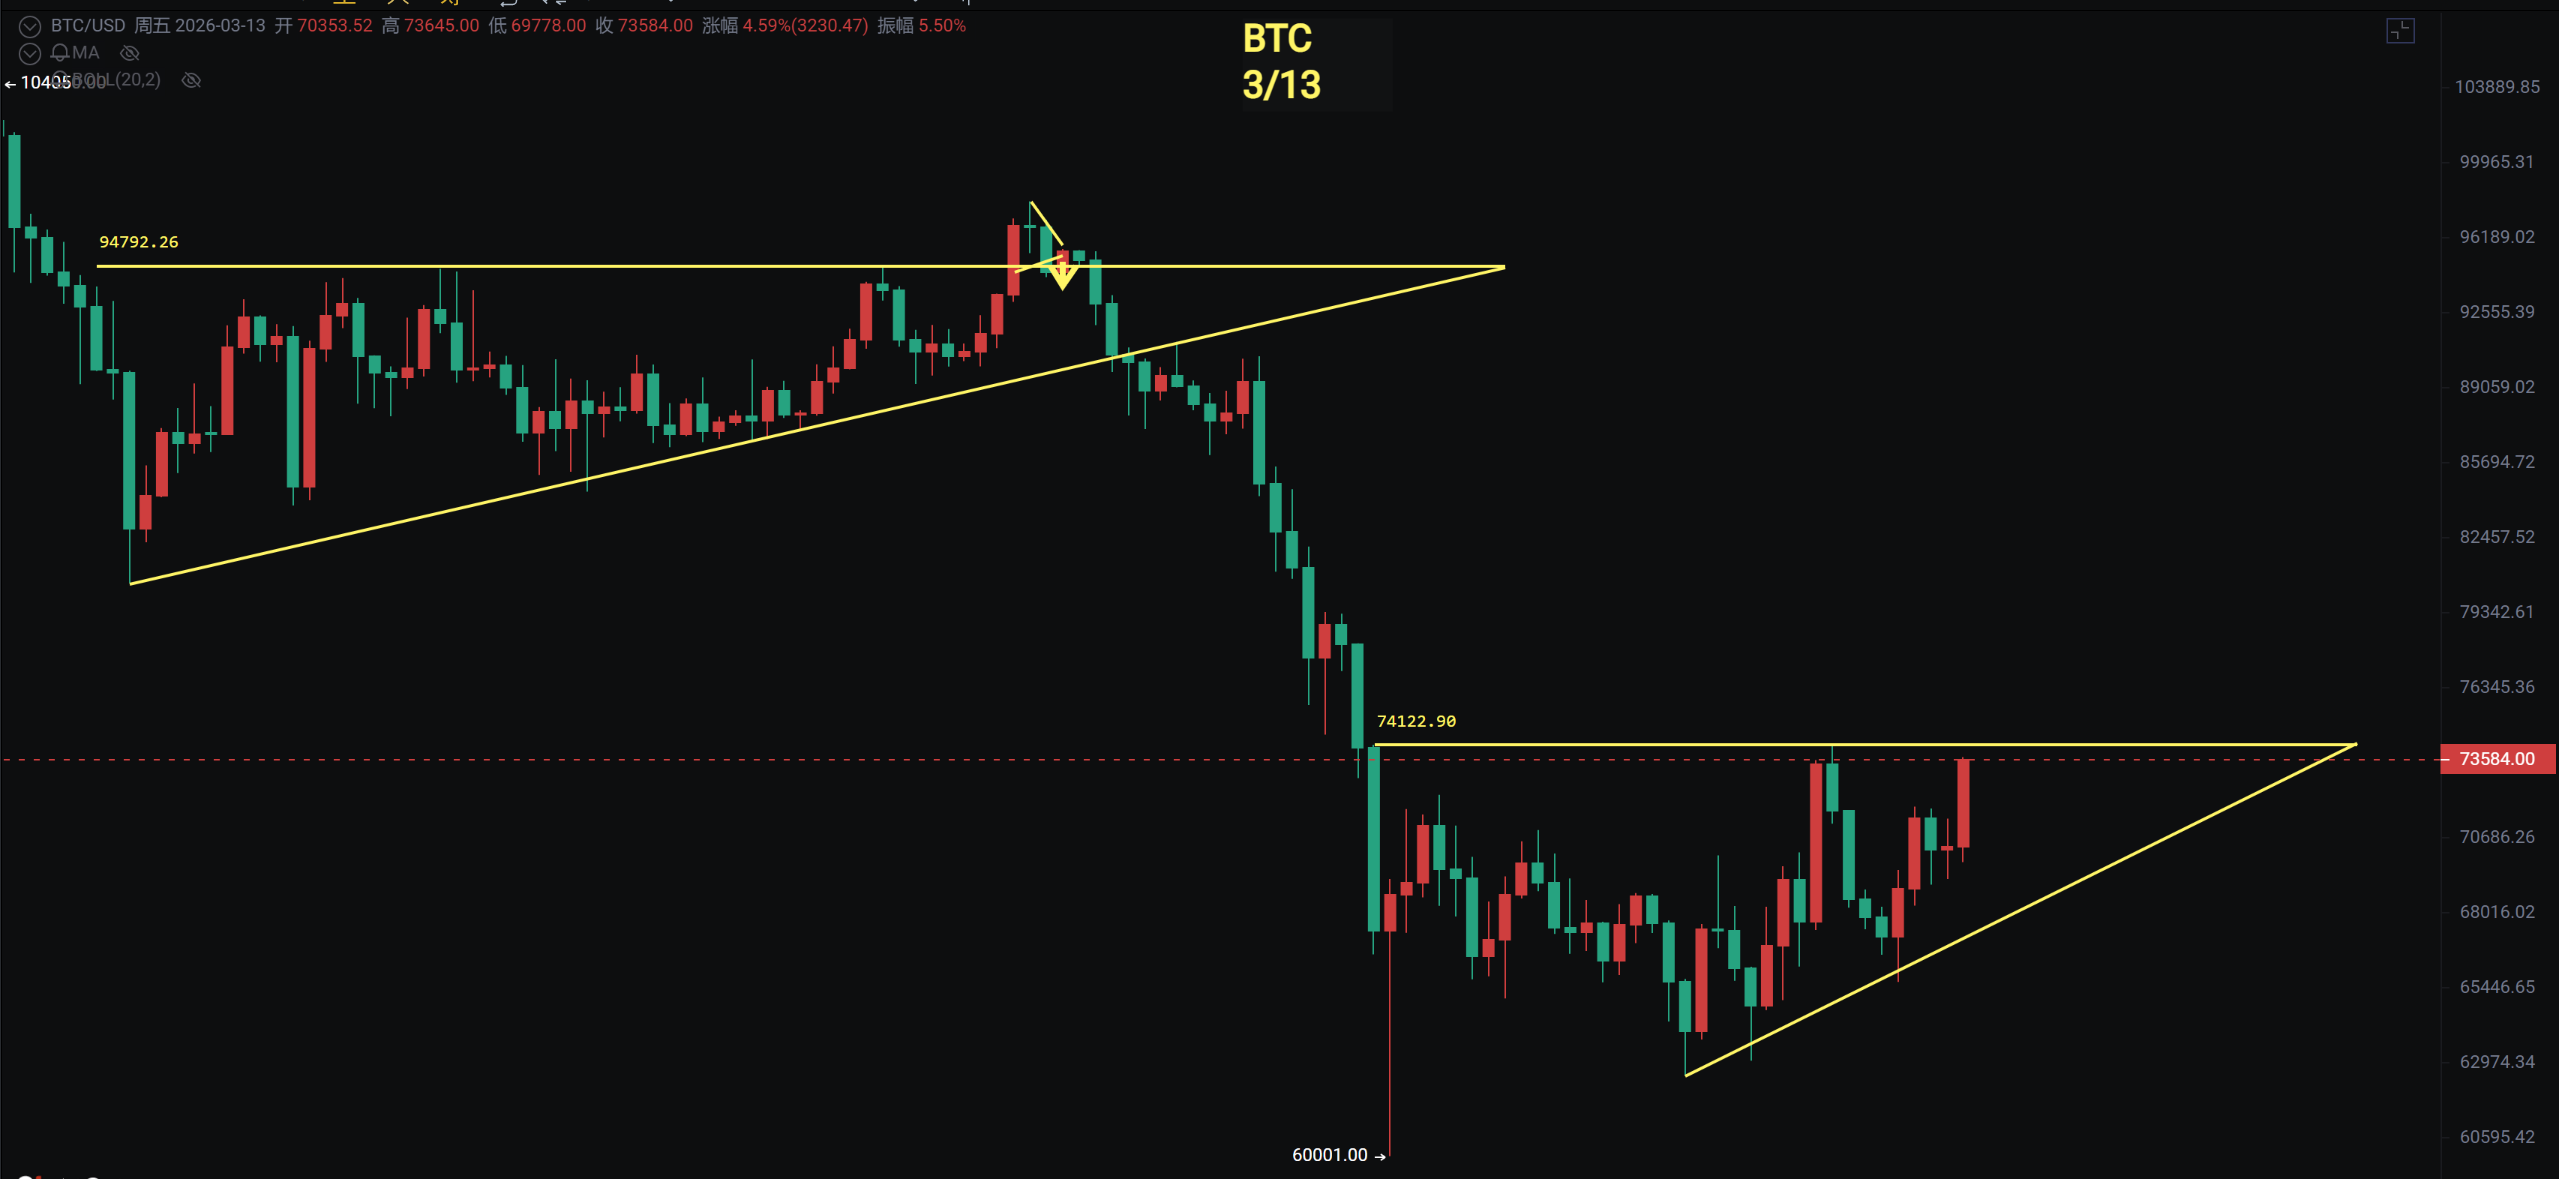
On March 26, 2013, BTC weekly chart showed a bottom divergence, about to face an upward breakthrough, how to grasp the next steps?
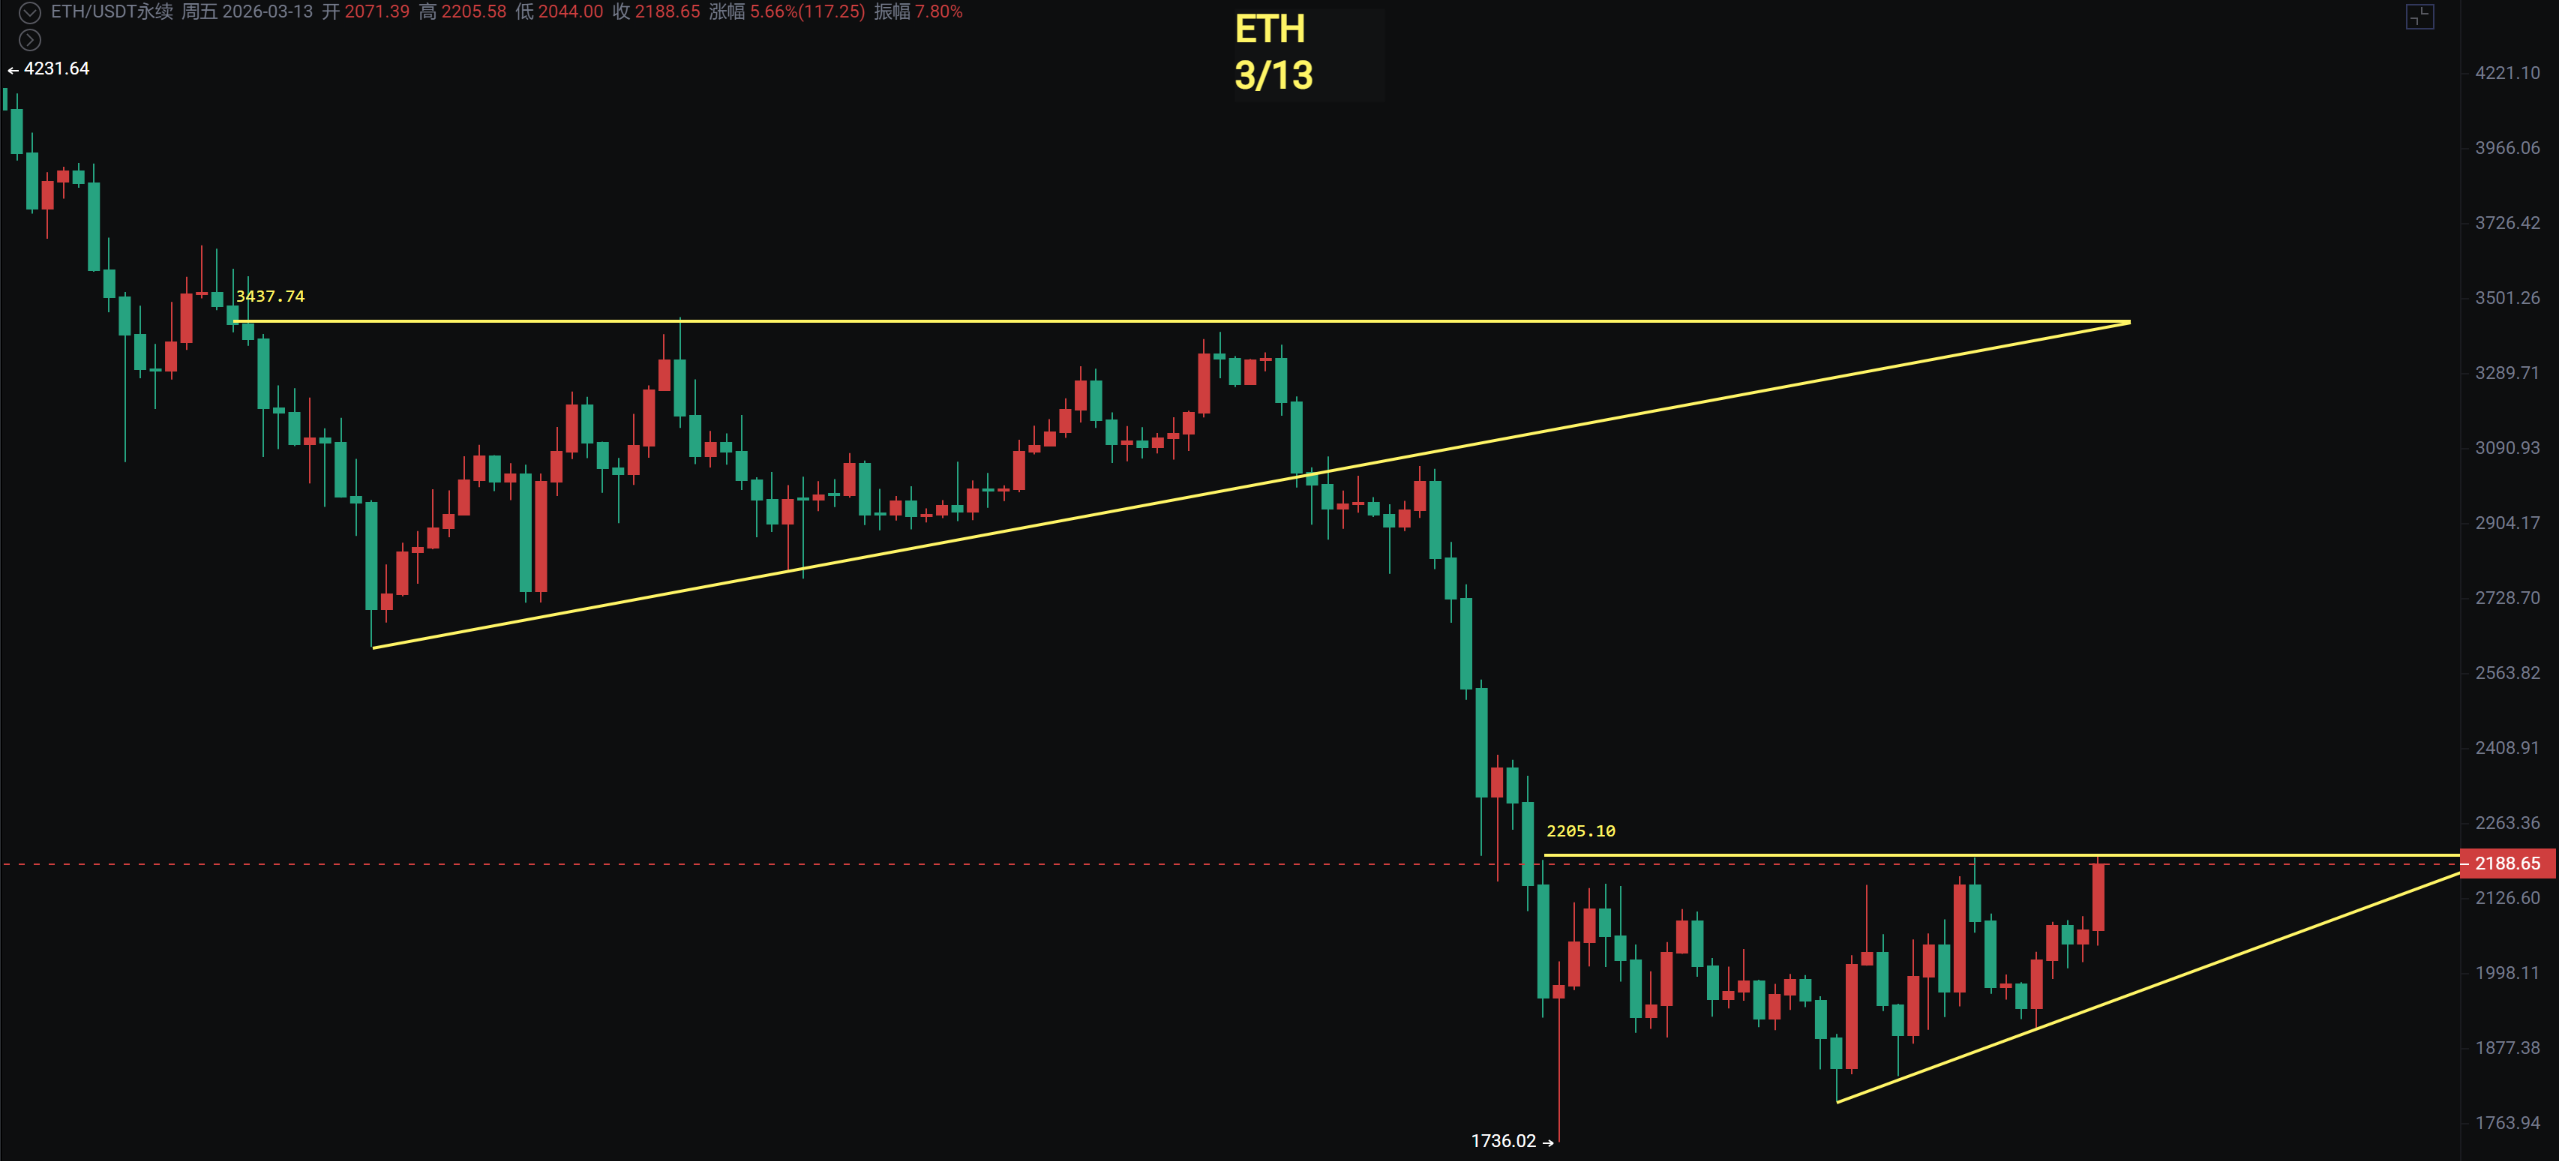
The big coin’s weekly MACD bottom divergence has been in narrow fluctuations for 35 days, currently facing around 74,000 resistance. Once it breaks through, there may be a chance to reach around 80,000 first. Ethereum's weekly chart also shows bottom divergence, approaching the resistance level and facing a breakthrough.
In the US stock market, a few months ago, I had been reminding about high-level fluctuations, with high points not widening the gap, indicating a future correction. Since late January, it has been in a declining trend, and currently, the risk of falling is still relatively high. Gold and silver have been in narrow fluctuations since January 30 after experiencing historic declines, and here it is increasingly likely to be near a phase top as I have been saying.
Big Coin
The daily chart of the big coin shows the Bollinger Bands opening, currently facing resistance near 74,000. If it breaks through, there may be a chance to reach around 80,000 or even higher, but one must guard against false breakouts, similar to the previous decline from 98,000.
The daily MACD histogram shows an airborne fueling trend, with the fast and slow lines continuously moving upward. There are two pressure points above, one at 78,900 and another at 84,300, temporarily focusing on short-term rebounds.
Support: 68,500—71,300
Resistance: 78,900—84,300
Ethereum
As of the time of writing, Ethereum has reached 2,200, which is also the pressure level maintaining the narrow range for 35 days. Currently, the probability of a breakthrough still seems high. The daily MACD has been above the zero axis, and after a correction, there are signs of increasing momentum, with the fast and slow lines continuing upward.
Resistance levels for continued upward rebounds on the daily chart: 2,380—2,575—2,770
Support: 1,900—1,990
Resistance: 2,380—2,575—2,770
If you like my views, please like, comment, and share, let's traverse through the bull and bear market together!!!
This article is time-sensitive and for reference only, real-time updates will be provided.
Focusing on K-line technical research, sharing global investment opportunities. Official account: BTC Trading Gentleman Fususu

免责声明:本文章仅代表作者个人观点,不代表本平台的立场和观点。本文章仅供信息分享,不构成对任何人的任何投资建议。用户与作者之间的任何争议,与本平台无关。如网页中刊载的文章或图片涉及侵权,请提供相关的权利证明和身份证明发送邮件到support@aicoin.com,本平台相关工作人员将会进行核查。