Original author: CryptoSlate
Original translation: Deep Tide TechFlow
Abstract: Currently, BTC is about $67K; miner electricity costs barely break even, but operating costs and depreciation still leave overall losses. This article disassembles the greatly simplified number of "the cost of mining" using real financial data from Riot Platforms, building a three-tier cost model, which has direct reference value for understanding miner stock valuations and BTC price pressure points.
Buying Bitcoin is cheaper than mining Bitcoin now, unless your electricity price is below 7 cents/kWh.
The full text is as follows:
The Riot case reveals the three-tier profit and loss structure of U.S. miners
The cost of Bitcoin mining is often simplified to a single number: "the cost to mine one BTC." In reality, this number depends on the level at which you measure the business.
Electricity costs determine whether to turn on machines today, operating expenses determine if a mine can support the entire company, and accounting costs determine whether this business ultimately reports profitability.
To analyze these three aspects more clearly, CryptoSlate constructed a Bitcoin mining cost model based on fundamental principles, calculating mining economics based on network difficulty, block rewards, transaction fees, ASIC efficiency, and electricity prices.
This model then incorporated company-level cost data from Riot Platforms' public financial documents to showcase the actual economic situation.
Under current network conditions, the model shows miners can cover electricity costs but still cannot cover broader operating and accounting expenses.
Riot's Texas operations reveal that even after the BTC price rebound, there remains a significant distance between the electricity break-even point, the operating break-even point, and the full accounting profit point.
Riot's mining economics reveal a three-tier profit and loss structure
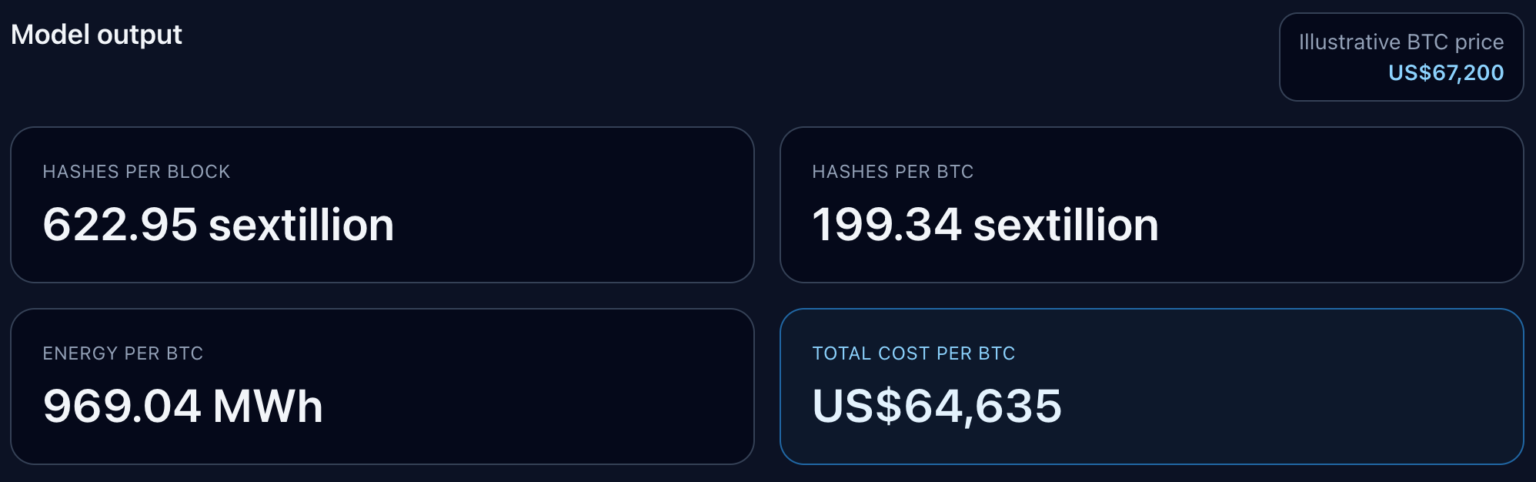
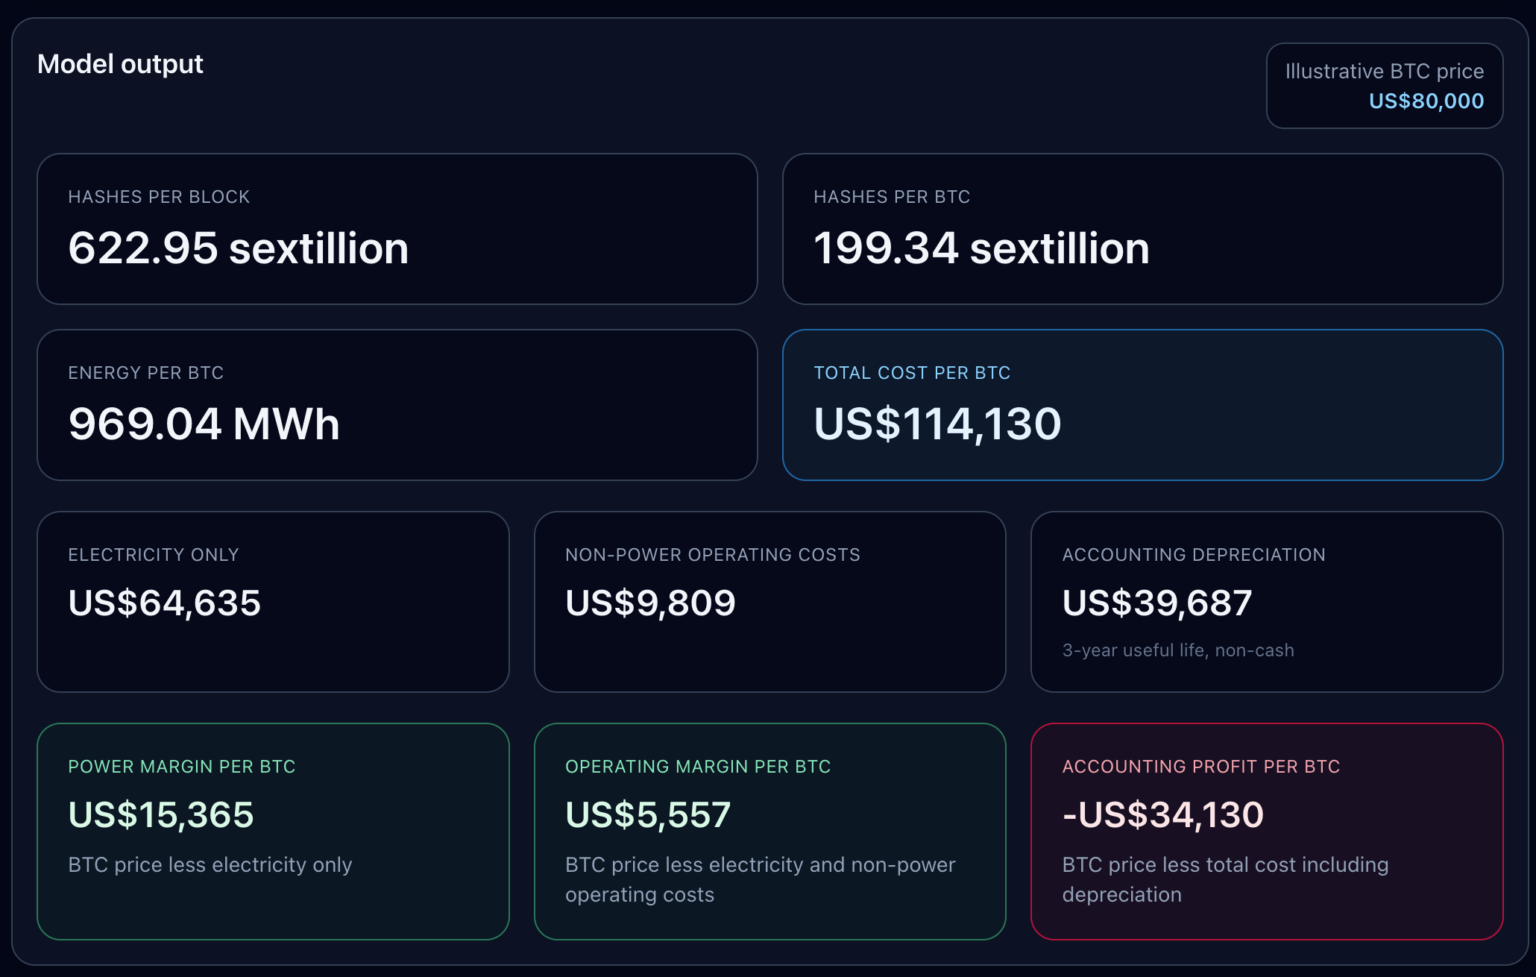
At the current BTC price of $67,200, Riot crossed one break-even point but did not cross the last two.
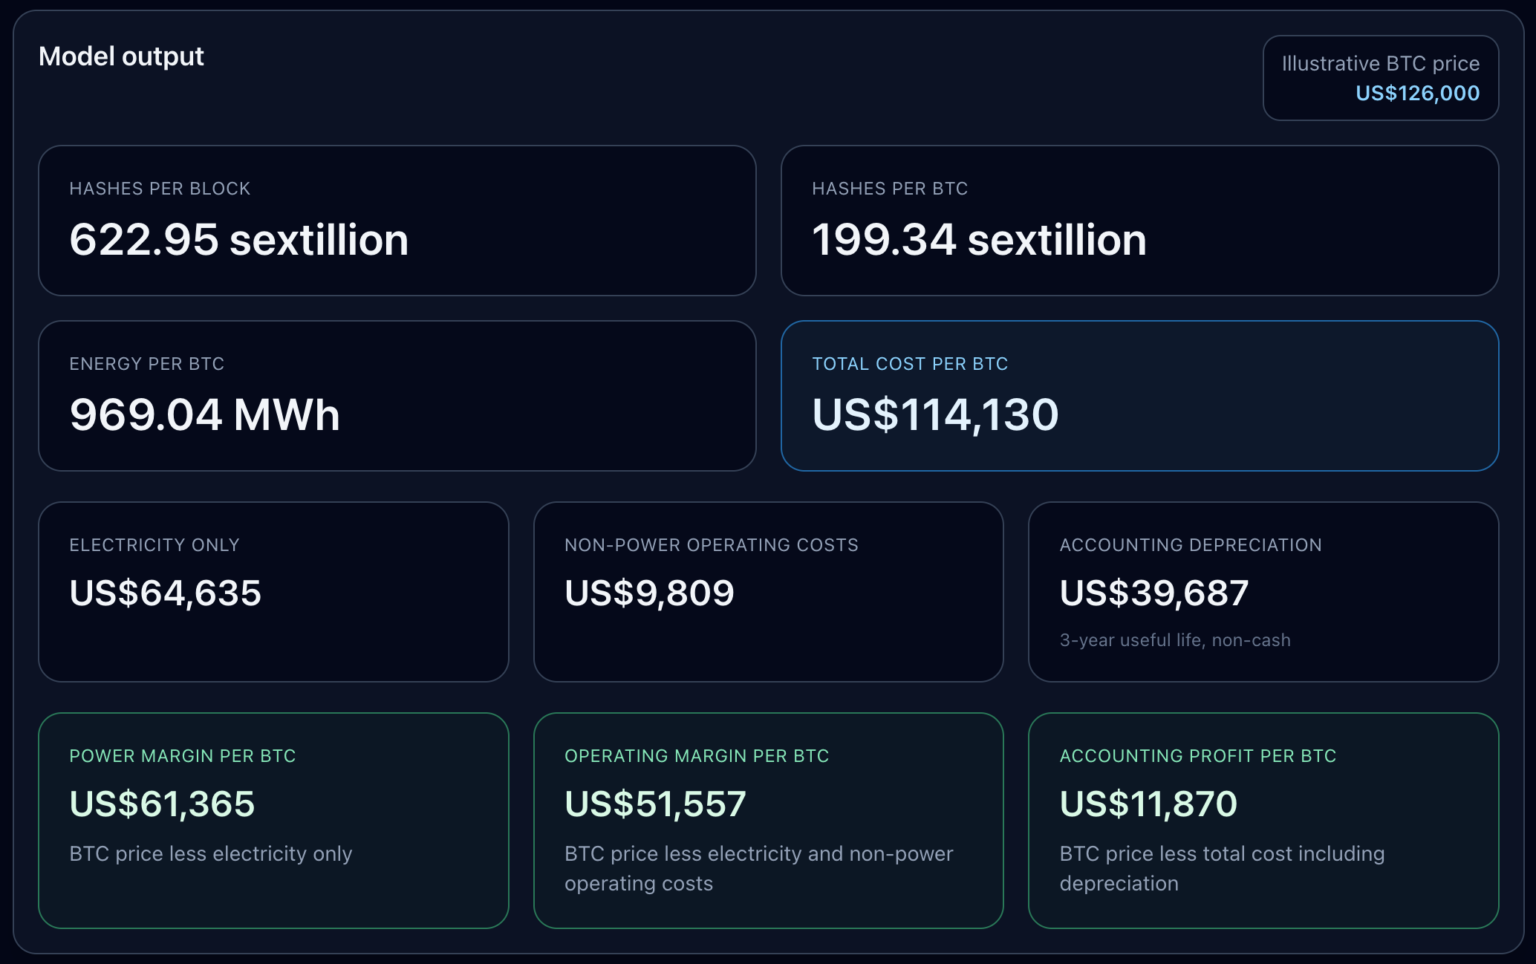
The model is based on the following current network conditions: Bitcoin difficulty 145,042,165,424,850, block reward 3.125 BTC, modern ASIC efficiency of approximately 17-19 J/TH, and Texas industrial electricity price of approximately $0.0667/kWh. Given that the current average transaction fee is about 0.02 BTC/block, this model ignores block transaction fees.
The above parameters yield the following results: total network computing power per block 622.95 quintillion hashes, computing power needed per BTC 199.34 quintillion hashes, and energy consumption per BTC 969.04 megawatt-hours.
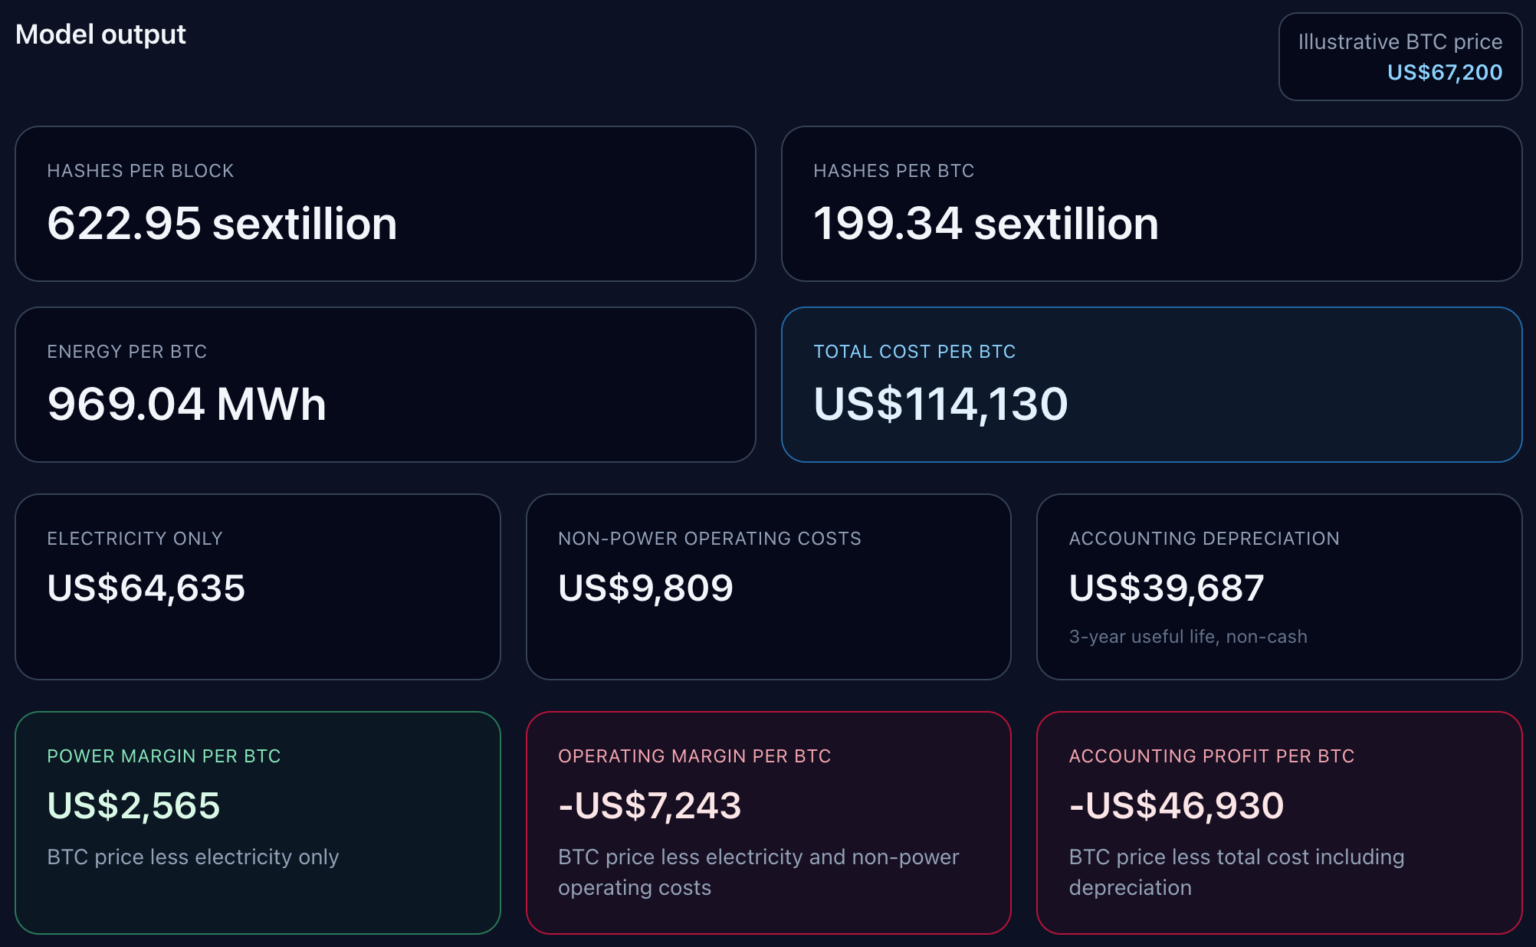
Accordingly, the electricity cost to mine one BTC at current prices is $64,635, with an electricity profit of $2,565/BTC.
After adding Riot's non-electric operating costs of about $9,809/BTC, the operating profit becomes negative $7,243, and total costs rise accordingly. Further adding non-cash depreciation of about $39,687/BTC brings accounting profit down to negative $46,930.
This clearly indicates that for large U.S. miners, "the cost to mine one BTC" does not have a singular number.
First layer: Electricity costs, determining whether it is worthwhile to turn on machines in the short term.
Second layer: Adding broader operating costs, determining whether self-mining can cover the overall business.
Third layer: Adding depreciation, determining whether book profits can synchronize with cash profits.
The model displays these three layers side by side, revealing the gap between them after the market rebound.
The break-even staircase defines the complete operational picture
The break-even staircase provided by the model is more explanatory than any single all-cost number.
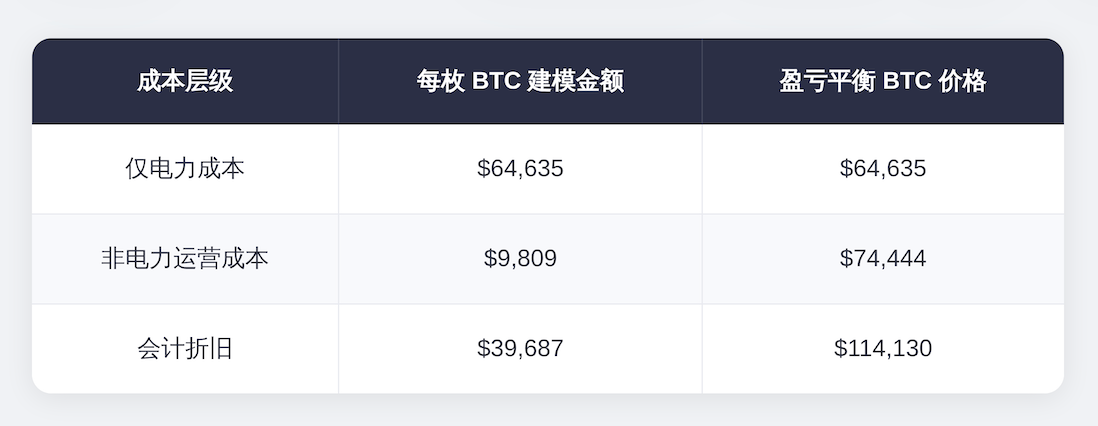
Break-even point for electricity costs only: $64,635/BTC.
After adding Riot's non-electric operating costs, the break-even point rises to approximately $74,444.
After adding accounting depreciation, the full accounting break-even point rises to $114,130.
Thus, miners can report positive revenue at the electricity level while still being in the red at the operational or accounting level.
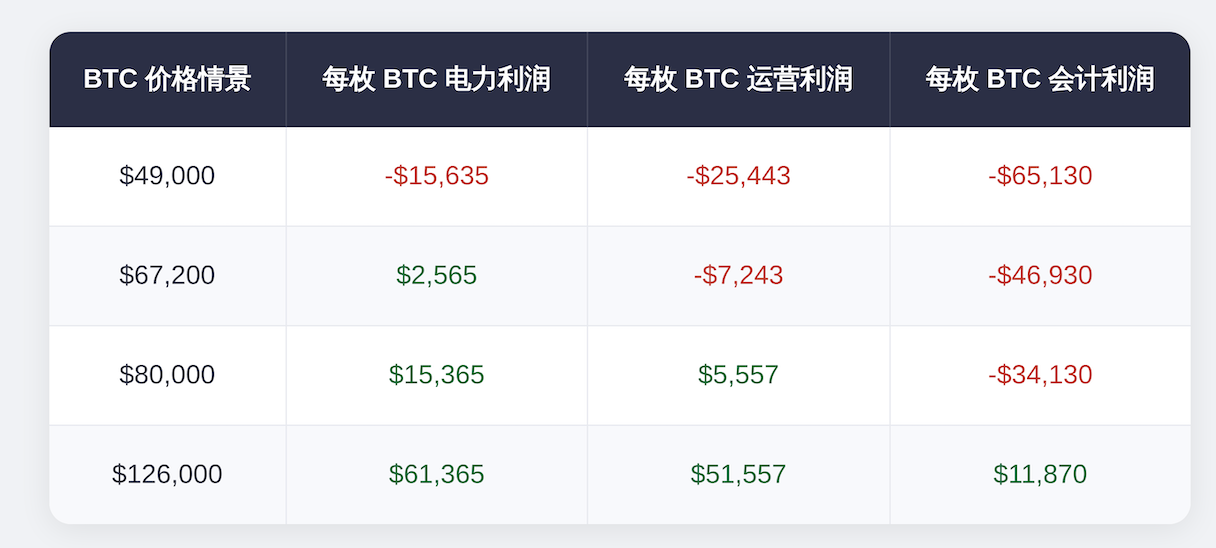
I established four price scenarios to illustrate how this staircase operates in practice.
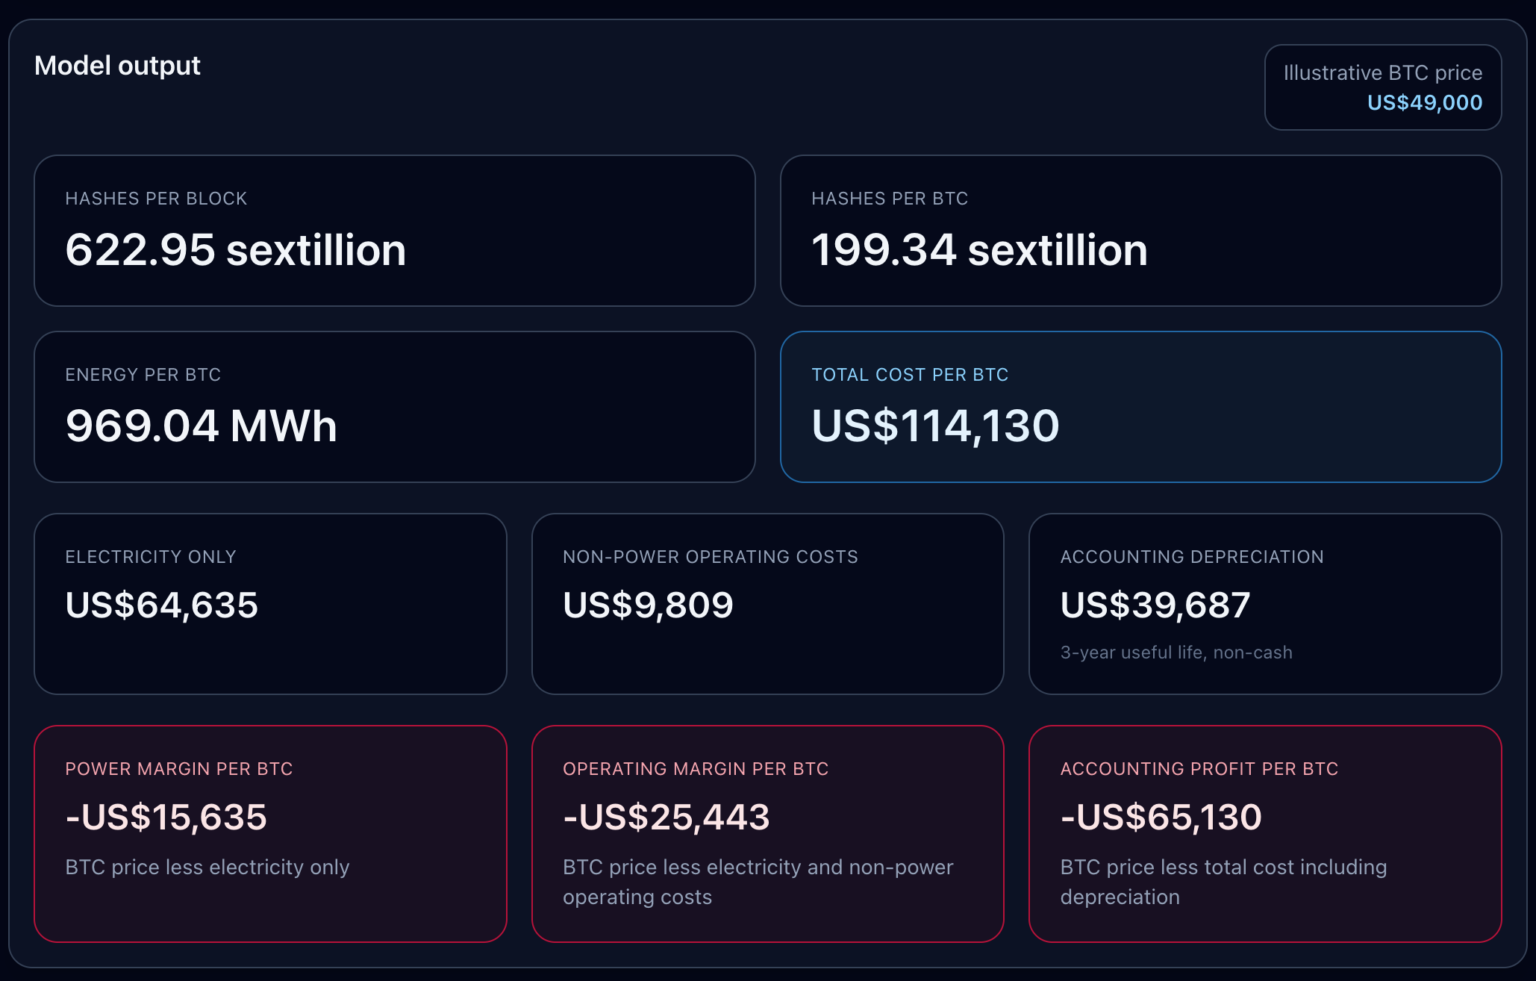
$49,000 bear market scenario: Riot is negative at all levels: electricity profit -$15,635/BTC, operating profit -$25,443/BTC, accounting profit -$65,130/BTC.
$67,200 current price scenario: Riot just barely crosses the electricity break-even point, slightly above the critical value. Electricity profit turns positive, but operational and accounting perspectives remain negative.
$80,000 rebound scenario: Riot crosses the operating break-even point with an operating profit of $5,557/BTC, but at the accounting level is still losing $34,130.
For all three levels to be positive, BTC needs to return to the historical high of $126,000, at which point accounting profit will be $11,870/BTC.
This distinction is substantial. Riot's depreciation layer is clearly defined as a non-cash expense and is calculated based on a three-year lifespan, being an accounting allocation rather than a short-term avoidable cash outflow.
However, it still belongs to this picture because public miners cannot survive solely on electricity profits—they have to report income statements, replace machines, and bear corporate operating costs.
Therefore, the truly valuable question is: What profit line are investors, analysts, and management actually watching when judging miner profitability?
Riot's price pressure test before the next halving
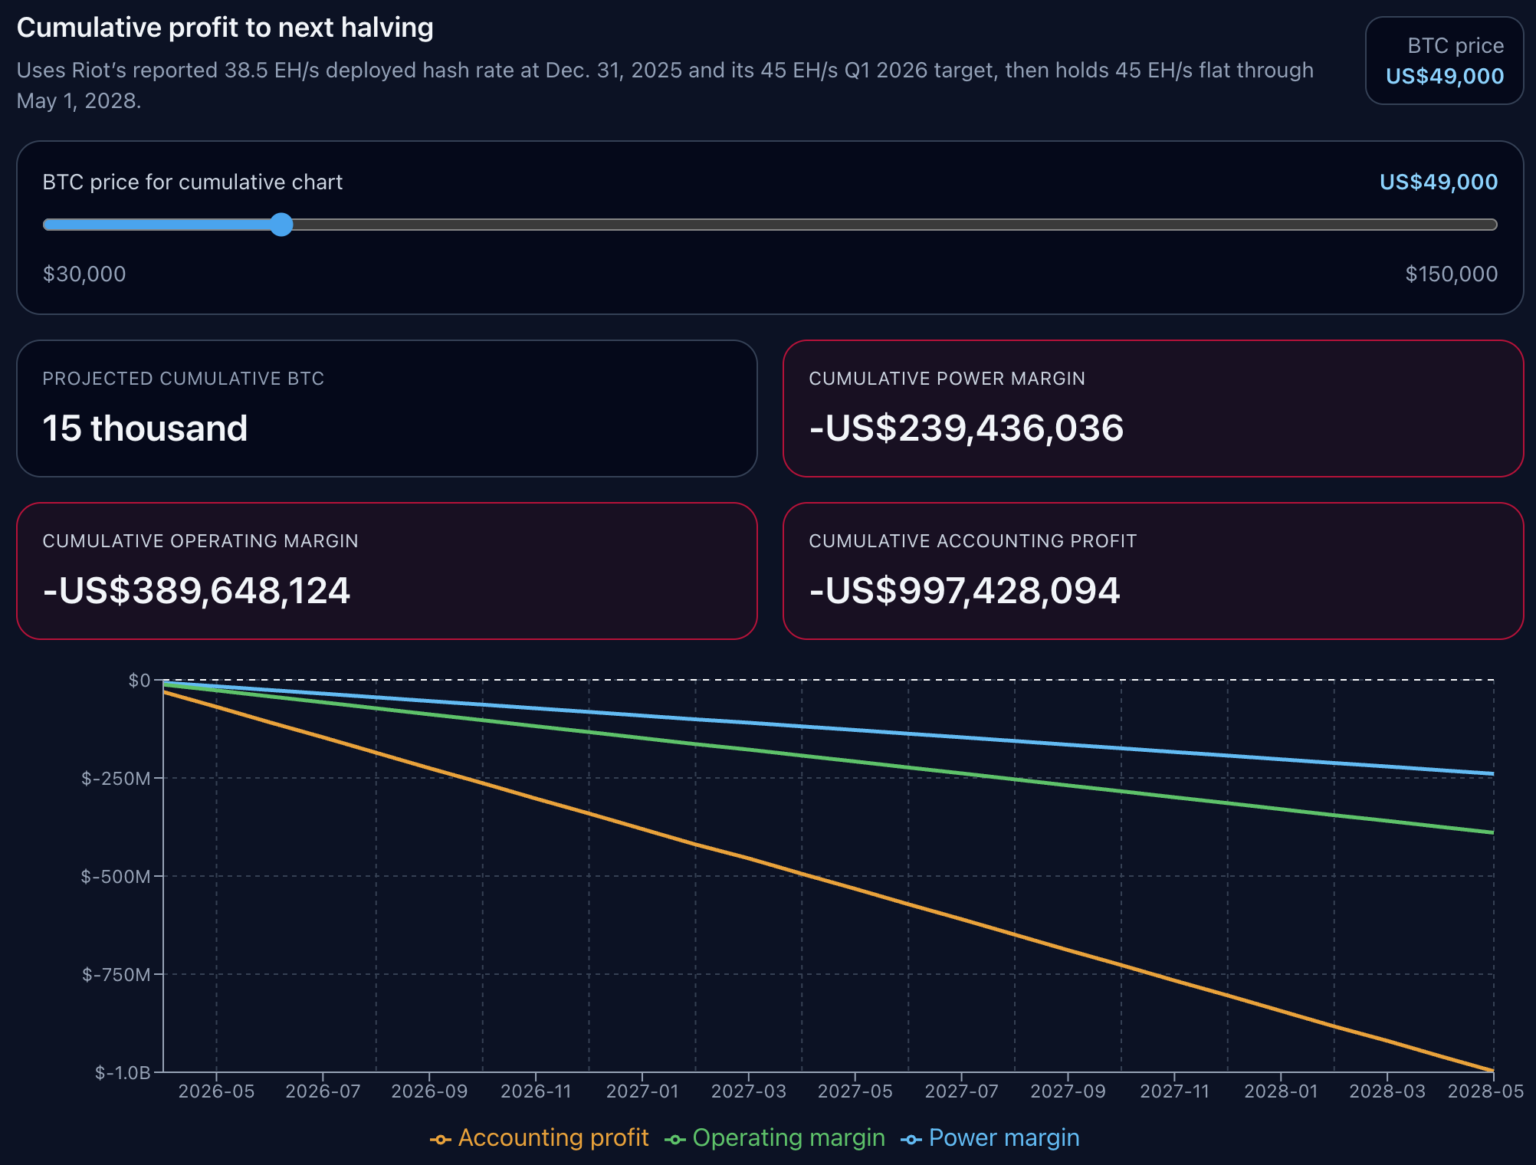
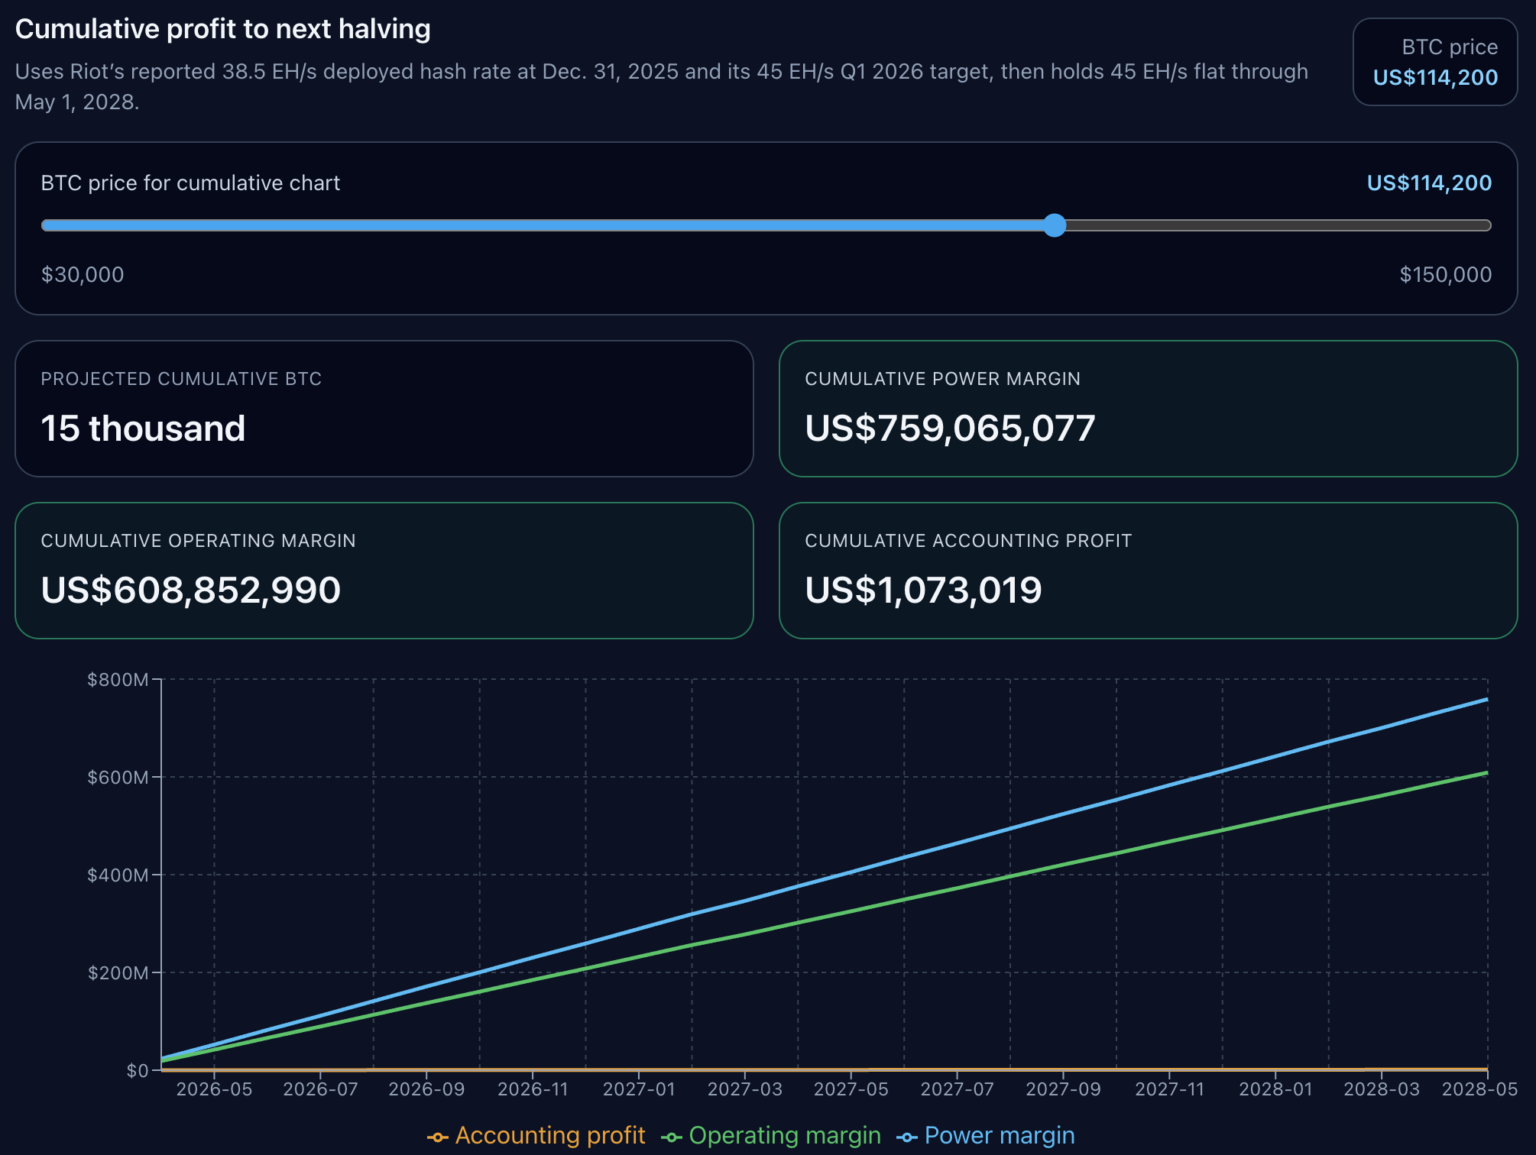
We then extended the cost model to the next halving in 2028.
Based on Riot's latest public documents, assuming current hashrate of 38.5 EH/s, climbing to 45 EH/s before March 31, 2026, and maintaining that level until the next halving window.
This model does not rebuild the entire market but rather keeps the current per BTC economics unchanged while projecting according to Riot's reported and planned self-mining hashrate path.
This is a scenario analysis focused on operational leverage, with clear price sensitivity.
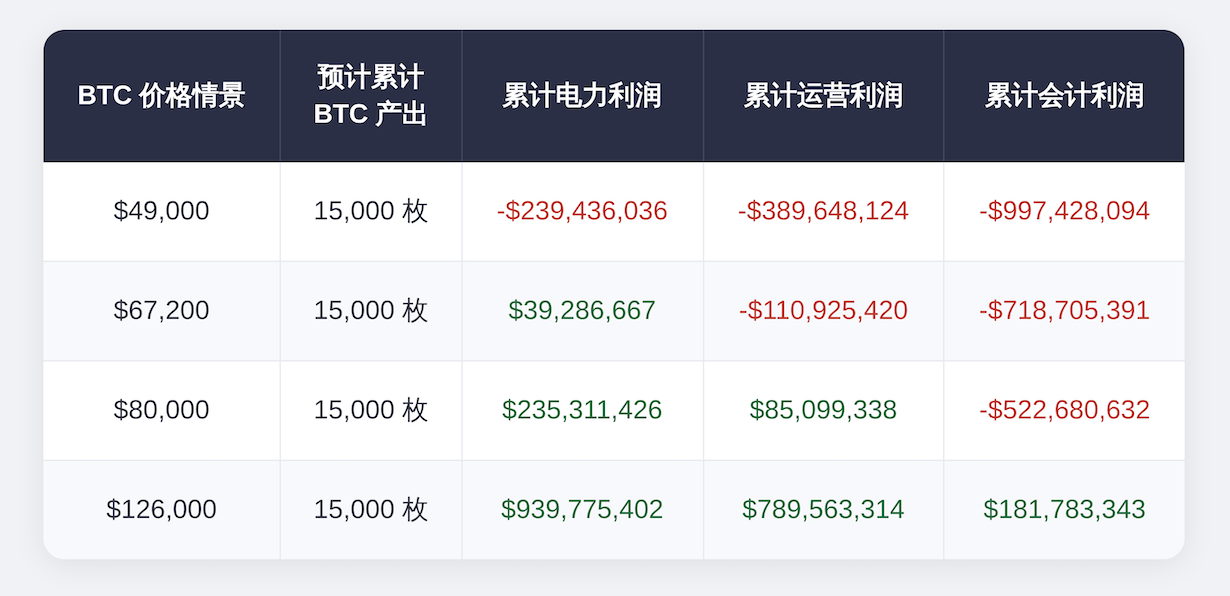
In all four scenarios, the expected cumulative mined BTC total is 15,000, while the profit structure varies.
$49,000 scenario: Riot cumulative electricity profit -$239,436,036, cumulative operating profit -$389,648,124, cumulative accounting profit -$997,428,094.
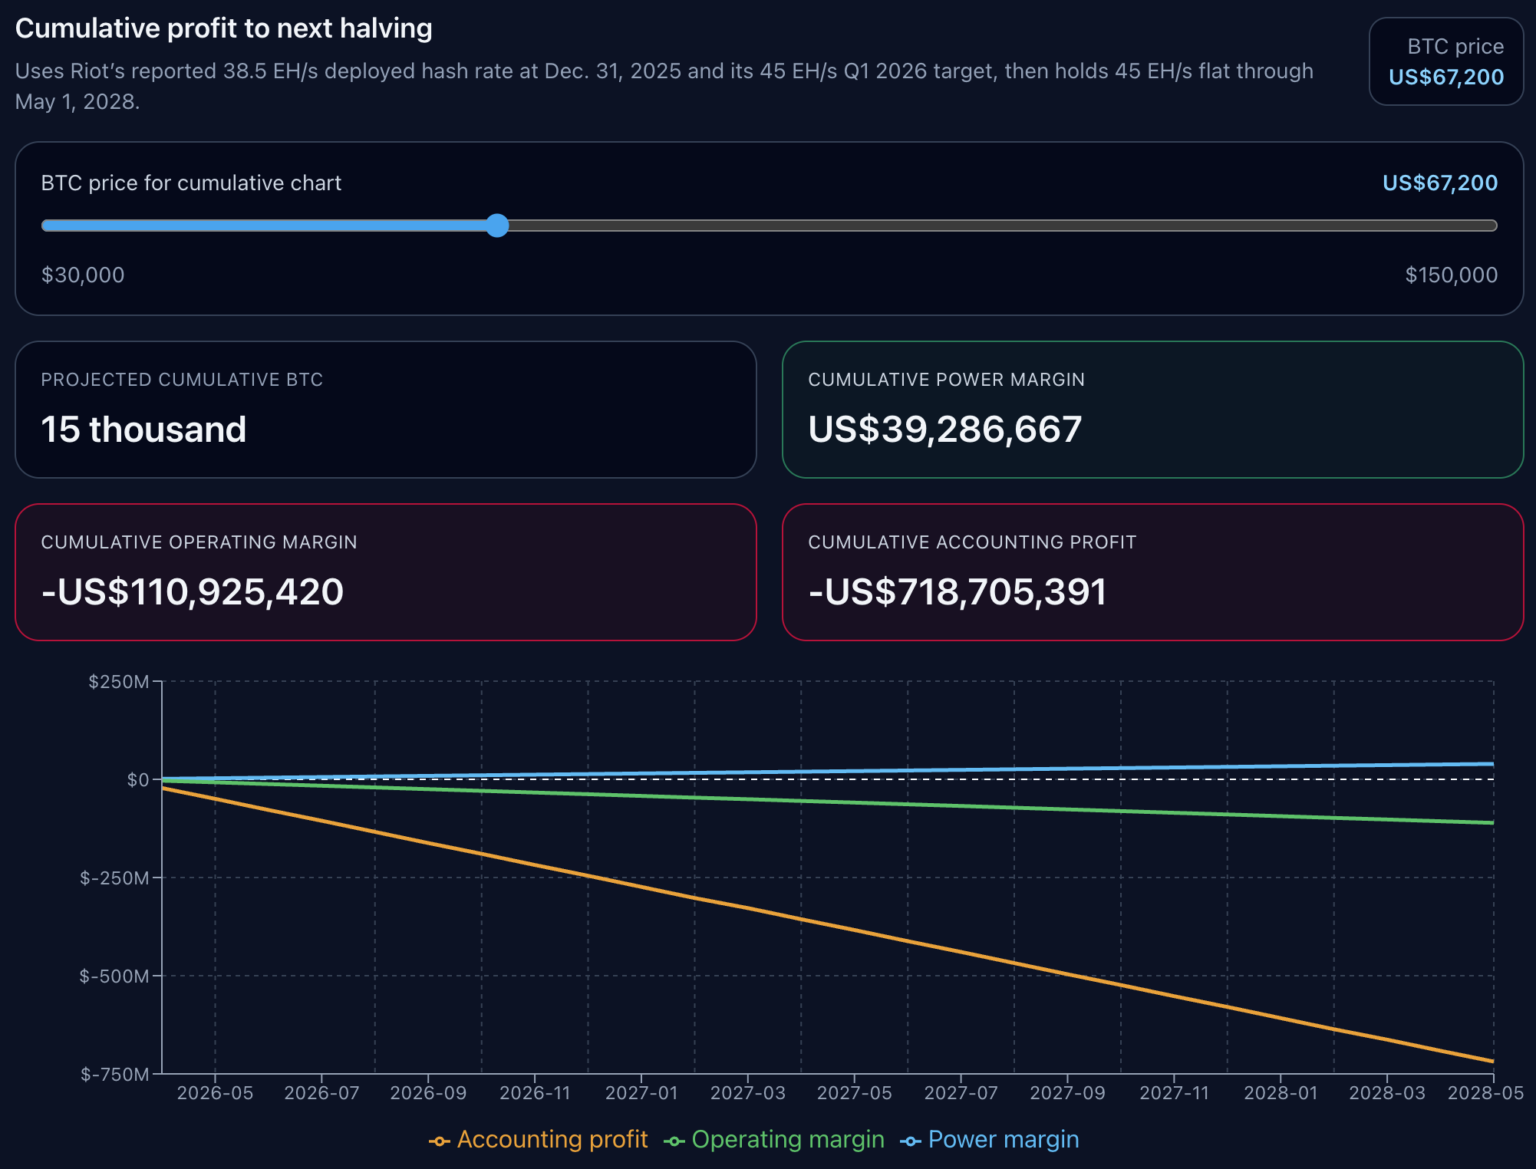
$67,200 scenario: cumulative electricity profit turns positive to $39,286,667, but cumulative operating profit remains -$110,925,420, and cumulative accounting profit is -$718,705,391.
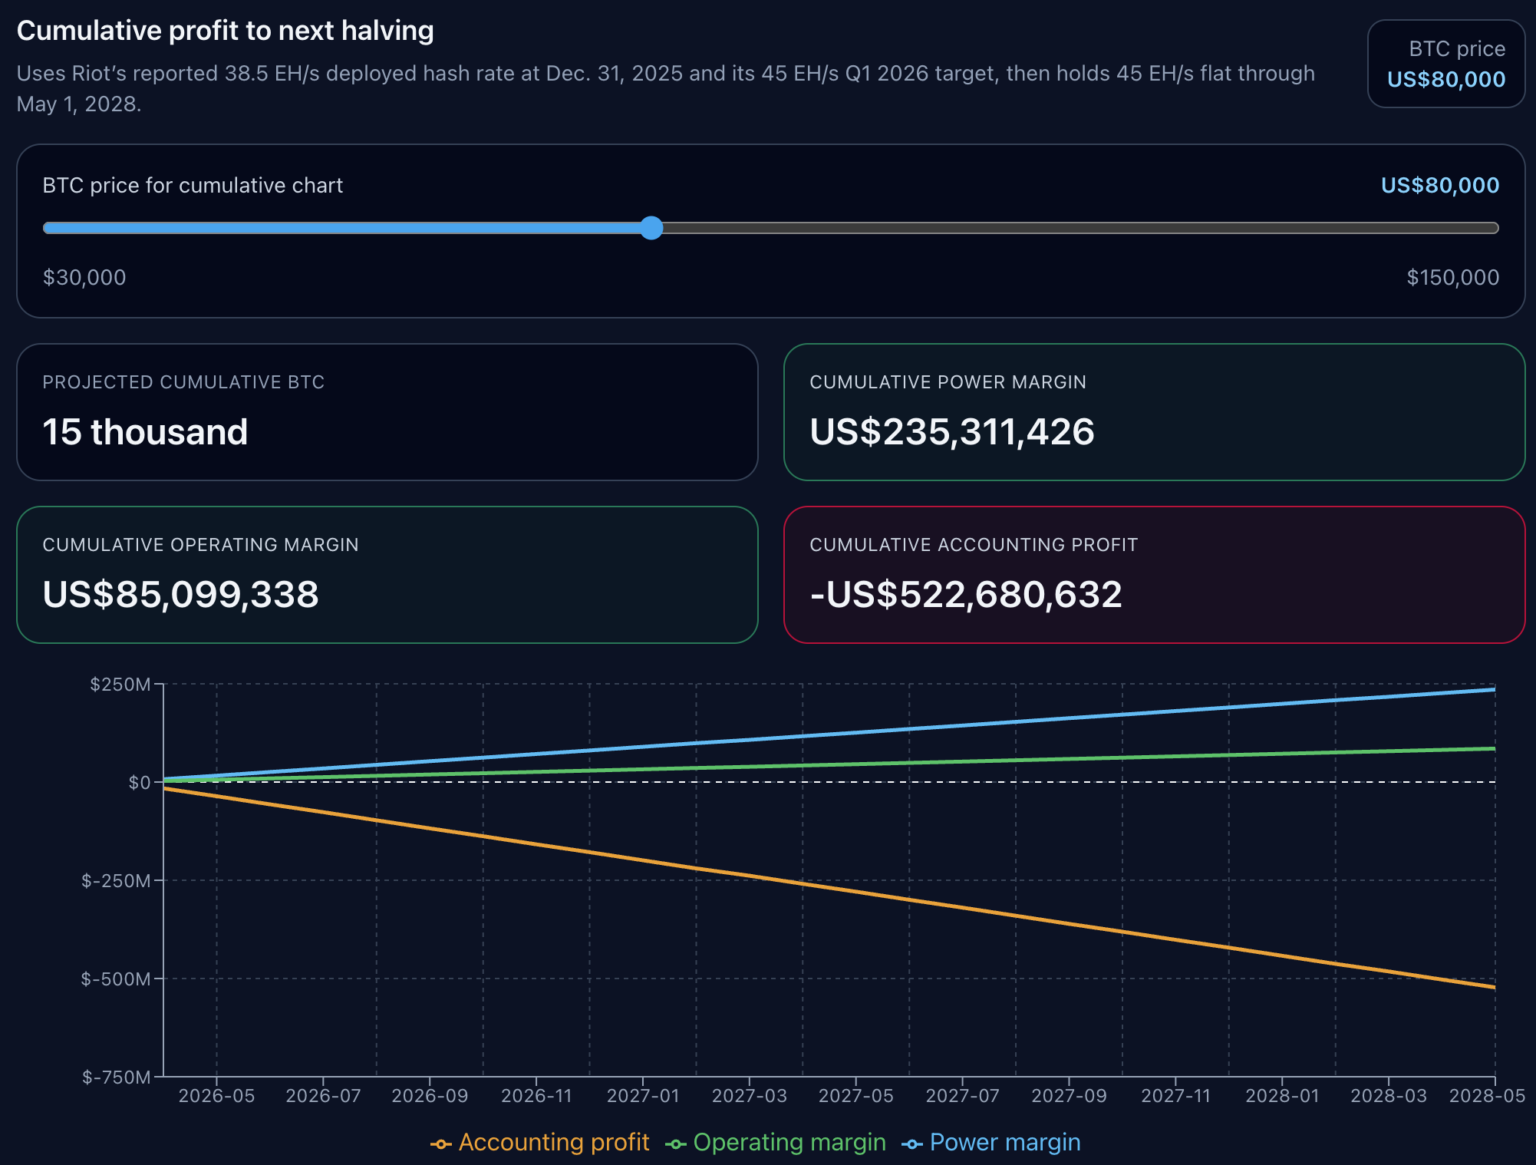
$80,000 scenario: cumulative operating profit turns positive to $85,099,338, but cumulative accounting profit remains -$522,680,632.
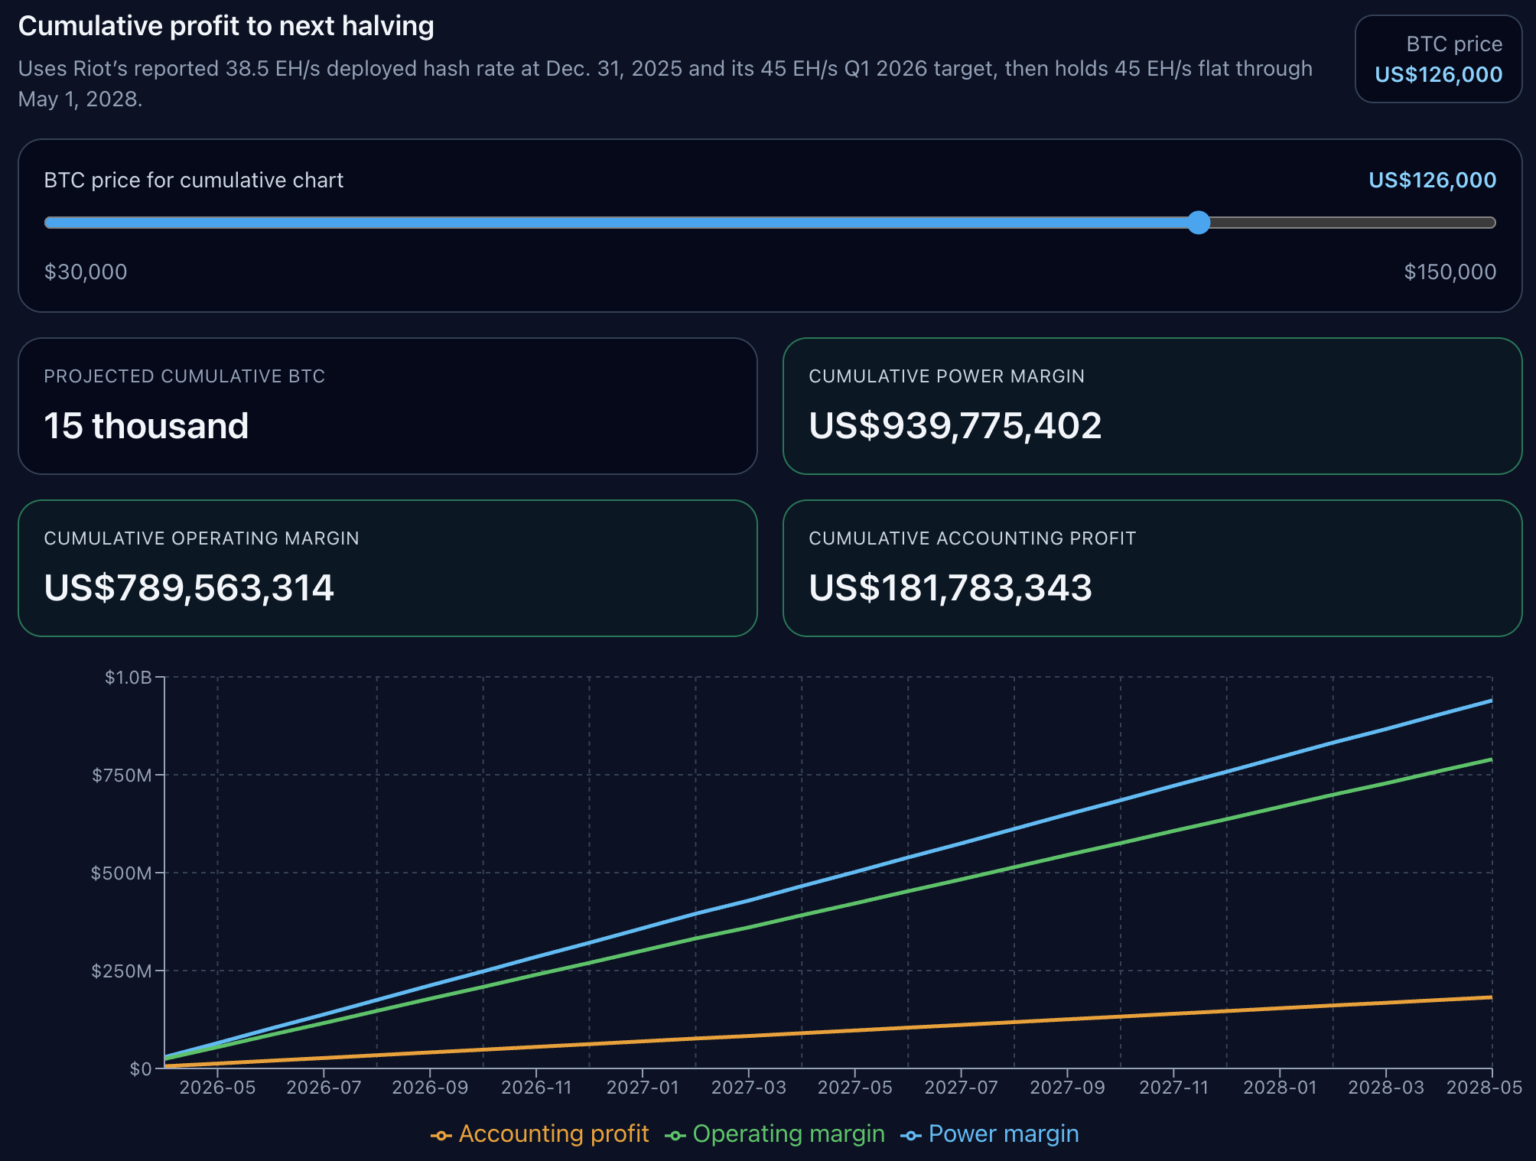
Only in the $126,000 scenario do all three lines turn positive, with cumulative accounting profit at $181,783,343.
Miners can maintain positive electricity profits for extended periods but still fail to cover broader operating costs; they can also achieve operational positivity while remaining far from accounting profitability. The Riot case indicates that the gap between these two states is substantial.
In the model, the gap between the electricity break-even point and the full accounting break-even point is about $49,495/BTC. This margin helps explain why miners appear healthy at the hashrate scheduling level but struggle at the reported profit level.
Our cumulative charts do not predict future difficulty, transaction fees, downtime, peak income, financing, or new capital expenditures and merely assume current per BTC economics remain unchanged, projecting along Riot's planned hashrate path.
This limitation does not affect the core signal the model conveys: that under the premise of unchanged others economics, fixing these parameters means that discussions before the next halving will largely depend on BTC prices.
For Riot, the model achieves cumulative accounting profitability at the $126,000 scenario, but in terms of absolute value, this critical point is $114,200.
Insights from the Riot case for the entire U.S. mining sector
For U.S. miners, the broader insight is clear: operational issues cannot be resolved solely by price; miner efficiency and electricity prices remain the primary hurdles.
In terms of cost sensitivity, we compared three ASIC presets: Bitmain S21 (17.5 J/TH), MicroBT M60S (18.5 J/TH), and Antminer S19 Pro (29.5 J/TH), using Texas industrial reference electricity prices.
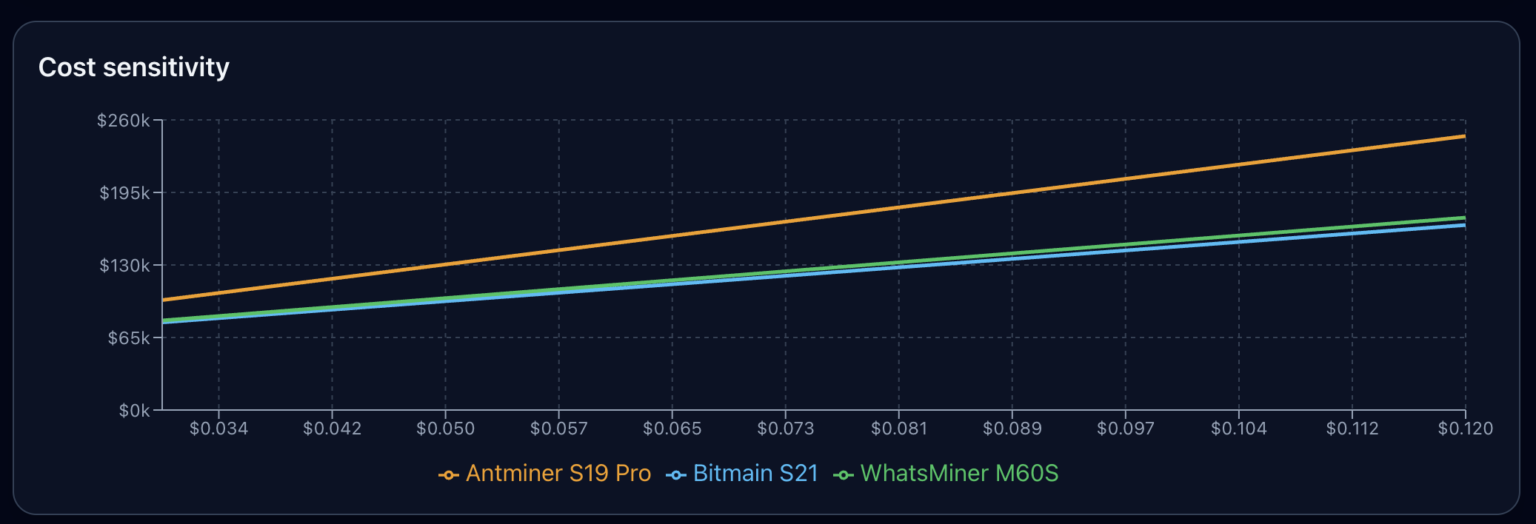
Within this electricity price range, the S19 Pro's cost per BTC is always higher than that of the newer models. The two new models are closely priced, while the less efficient miner consistently maintains a significantly higher cost line throughout the chart.
This conclusion is not exclusive to Riot. Riot's non-electric cost layer and depreciation assumptions are specific to the company; other miners may have different bases for indirect costs, different lifespan assumptions, different peak income structures, or different actual power mixes. However, the applicability of the three-layer analytical framework is not affected by this.
First layer: Electricity costs. Second layer: Operating costs. Third layer: Accounting costs.
Companies that can survive during low price cycles often easily cross the first layer. Those that can compound growth during cycles...
免责声明:本文章仅代表作者个人观点,不代表本平台的立场和观点。本文章仅供信息分享,不构成对任何人的任何投资建议。用户与作者之间的任何争议,与本平台无关。如网页中刊载的文章或图片涉及侵权,请提供相关的权利证明和身份证明发送邮件到support@aicoin.com,本平台相关工作人员将会进行核查。