Author: CryptoSlate
Translated by: Deep Tide TechFlow
Deep Tide Introduction: This article explains an important market mechanism: the Bitcoin derivatives market has clearly signaled risks through funding rates, open interest, and forced liquidations before the macro data is released. Understanding this logic allows one to see the true market pressures earlier than following any narrative.
The full text is as follows:
The Bitcoin derivatives market provides us with the best explanation for this week's macro pressures.
The funding rate has sharply turned negative, open interest remains high, and then the U.S. employment report comes out. These three events combined indicate that the market has heavily positioned for a downward hedge before the real macro catalysts arrive.
This sequence is worth understanding because it explains how macro volatility enters the crypto market.
It usually appears first in perpetual contracts—where the hedging speed is fastest and leverage usage is highest.
The funding rate tells you which side is paying the cost to maintain their positions, open interest tells you how much positioning is left in the system, and liquidation data tells you when these positions begin to collapse.
On February 28, the funding rate for Bitcoin perpetual contracts dropped to about -6%, one of the most negative readings in nearly three months. Open interest, measured in BTC, rose from about 113,380 BTC at the beginning of the year to 120,260 BTC.
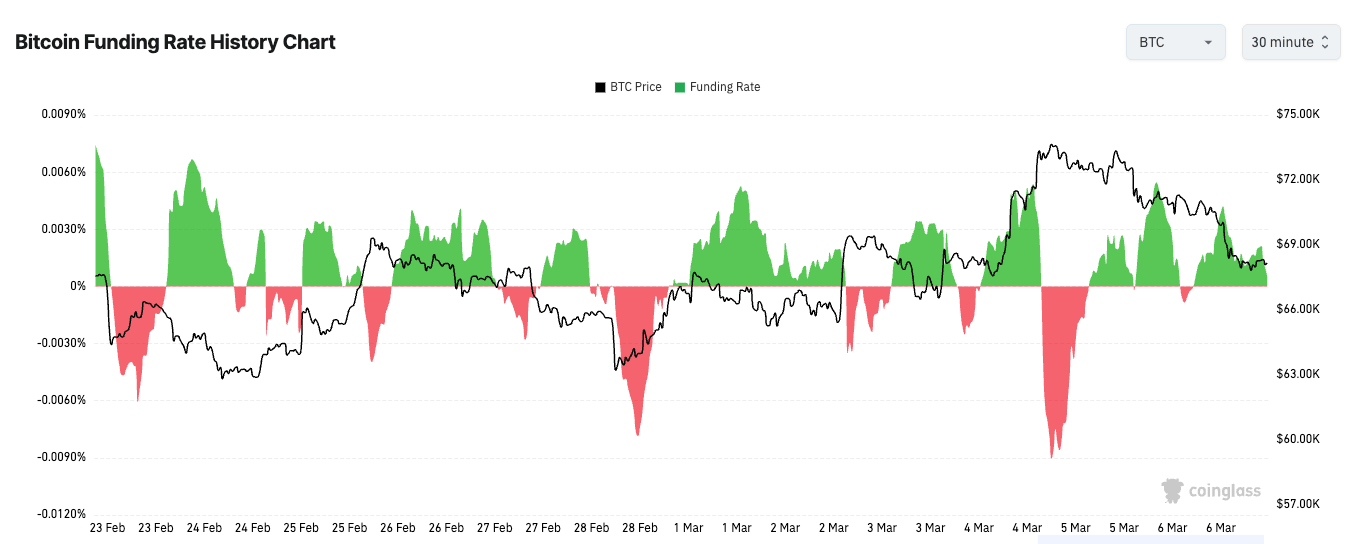
This combination is significant because it points to two things: traders are betting heavily on a downturn, and they are doing so with more leverage entering the market. The market is both very tense and very crowded.
This is the simplest way to understand how macro pressures enter the crypto market.
It appears on the derivatives ledger, not as a neatly packaged X narrative or economist's report. Traders act there first because perpetual contracts have good liquidity, low costs, and are always available.
When they are concerned about growth, interest rates, or broader risk aversion, they short perpetual contracts; these contracts fall below spot, and the funding rate turns negative because shorts must pay fees to maintain their positions.
Why negative funding rates can persist
But a negative funding rate itself is not a bottom signal; it simply tells you which way the market is leaning.
This distinction is important because traders like to turn every extreme reading into a prediction.
Extremely negative funding rates can signal short covering, and last week's pattern clearly created such a possibility. But when hedging demand is real, it can also persist longer than people expect.
Extreme funding rate spikes and drops reflect one-sided positioning, which may persist during strong directional moves.
This persistence usually comes from two places.
Some traders are hedging real spot exposure, which means they are not precisely predicting the next move but are simply protecting their portfolios. Others are simple trend followers who are willing to pay the funding rate as long as the market continues to move in their direction. Both types can keep the funding rate negative, even after the initial panic has passed.
That's why the real signal is not whether the funding rate is negative. More interesting patterns emerge when the funding rate remains significantly negative while prices no longer make new lows. At that point, pressure begins to build up beneath the surface. Shorts are still paying to maintain their positions, but the market no longer rewards them in the same way. This is how conditions for short covering are formed.
The employment report brought real macro inputs to the market
This week's macro catalyst came from the U.S. labor market. On March 6, the Bureau of Labor Statistics released that non-farm jobs decreased by 92,000 in February, with an unemployment rate of 4.4%.
Such reports can trigger broad re-pricing because they simultaneously affect multiple market themes. A weaker labor market could suppress yields if traders believe the Federal Reserve may need a more dovish path. It could also dampen risk appetite if traders interpret the data as a signal of real economic weakness.
The crypto market tends to feel these debates more acutely since leverage can turn macro issues into position events.
If traders have heavily shorted, even a brief alleviation of financial conditions due to macro data could cause prices to soar as shorts are forced to cover.
If the data deepens risk aversion, the similarly crowded positioning structure may continue to apply downward pressure as shorts remain comfortable and longs begin to capitulate.
The funding rate is a pressure gauge, open interest is the fuel, and liquidations are the moment when pressure starts to break through the system.
Liquidation data is the scoreboard
Liquidation data tells you whether the market is orderly or reactive.
Short liquidations usually confirm a covering event, while long liquidations typically confirm a washout to the downside. When both sides are liquidated in a short time, the market indicates that volatility has taken over, and there is little room for both sides to hold their positions.
This is why liquidation data is best used as a confirming layer. The funding rate sets the conditions, but liquidations tell you whether those conditions are indeed reflected in prices.
Open interest is equally important here. If participation simultaneously shrinks, a price decline and a negative funding rate don’t reveal much.
This may simply mean traders are stepping back to observe. But when open interest rises alongside a negative funding rate, it indicates that new positions are being established under bearish or defensive mechanisms.
Tracking open interest in BTC can eliminate some distortions caused by price fluctuations; thus, during price declines, an increase in BTC-denominated open interest can more clearly reflect market participation.
From this perspective, the past week was not truly about the strength or weakness of Bitcoin but about where pressure was accumulating.
The derivatives market had already shown a pattern of heavy shorting or hedging before the employment data was released.
The employment report subsequently provided global markets with a real macro input to process.
When these two events met, the crypto market did what it typically does: it expressed the same macro uncertainty that everyone was facing with larger candlesticks, quicker reversals, and more intense position liquidations.
The funding rate cannot predict prices; it only tells you which way leverage is leaning. Open interest cannot tell you who is right; it only tells you how much positioning is still in play. Liquidation data cannot explain the entire market; it only tells you when the market becomes uncontrollable.
That’s why derivatives ultimately become the best macro interpreters this week. Before the narrative settled, the ledger had already painted the risk clearly. Traders were shorting, leverage was still in the system, and the employment report gave the market a real object to react to.
Everything that followed was the price discovering how crowded this room was.
免责声明:本文章仅代表作者个人观点,不代表本平台的立场和观点。本文章仅供信息分享,不构成对任何人的任何投资建议。用户与作者之间的任何争议,与本平台无关。如网页中刊载的文章或图片涉及侵权,请提供相关的权利证明和身份证明发送邮件到support@aicoin.com,本平台相关工作人员将会进行核查。


