Author: Frank, PANews
At the beginning of 2026, the crypto market is permeated with a sense of frustration and confusion.
Bitcoin has retraced about 36% from the historical high reached in October 2025, and the market has been in a tug-of-war between bulls and bears. However, what makes many crypto investors even more uneasy is not the price itself but the fact that the indicators they used in the past to gauge market positions have almost all failed.
The S2F model's prediction of $500,000 diverges from reality by over three times, the four-year cycle has yet to see an explosive market after halving, the Pi Cycle Top indicator has remained silent throughout the cycle, the fixed threshold of MVRV Z-Score has not triggered, and the top area of the rainbow chart has become unattainable. Meanwhile, the contrarian signals from the fear and greed index have repeatedly failed, and the highly anticipated "altcoin season" never arrives.
Why have these indicators collectively failed? Is it a temporary deviation, or has there been a fundamental change in market structure? PANews systematically reviews and analyzes eight widely discussed failed indicators.
Four-Year Cycle Theory: The Supply Shock from Halving is Becoming Insignificant
The four-year cycle theory is the most widely accepted principle in the crypto market, positing that Bitcoin follows a fixed rhythm driven by halving events: accumulation before halving, an explosion 12-18 months after halving, a peak drop of 75%-90%, and then a new start after the bear market bottoms. The three halvings in 2012, 2016, and 2020 have validated this principle well.
However, after the halving in April 2024, the market did not see the typical explosive growth observed in previous cycles. Bitcoin's annualized volatility has dropped from historically over 100% to about 50%, showing more "slow bull" characteristics. The bear market decline has also narrowed, with the drop from peak to trough in 2022 being 77%, which is less than the 86% in 2014 and 84% in 2018.
Discussions around the failure of the four-year cycle theory are very prevalent on social media, with the mainstream view suggesting that the entry of institutional funds fundamentally changed the micro-structure of the market.
Firstly, after the listing of Bitcoin spot ETFs in the U.S., continuous capital inflow has created sustained demand, breaking the simplistic narrative driven purely by halving.
Secondly, on the supply side, the 2024 halving reduces the block reward to 3.125 BTC, decreasing the daily new supply from about 900 BTC to 450 BTC, with an annualized reduction of approximately 164,000 coins. This reduction has brought Bitcoin’s annualized inflation rate (supply growth rate) down from 1.7% before halving to about 0.85%, with the annual supply decrease accounting for only 0.78% of the total issuance of 21 million coins. Relative to the multi-trillion-dollar Bitcoin market value, the actual impact of this supply reduction is negligible.
Pi Cycle Top: Decreased Volatility Makes Moving Average Crosses Lose Conditions
The Pi Cycle Top, developed by Philip Swift, identifies market tops by observing when the 111-day moving average crosses above twice the 350-day moving average. This indicator has accurately signaled tops three times: in 2013, 2017, and April 2021.
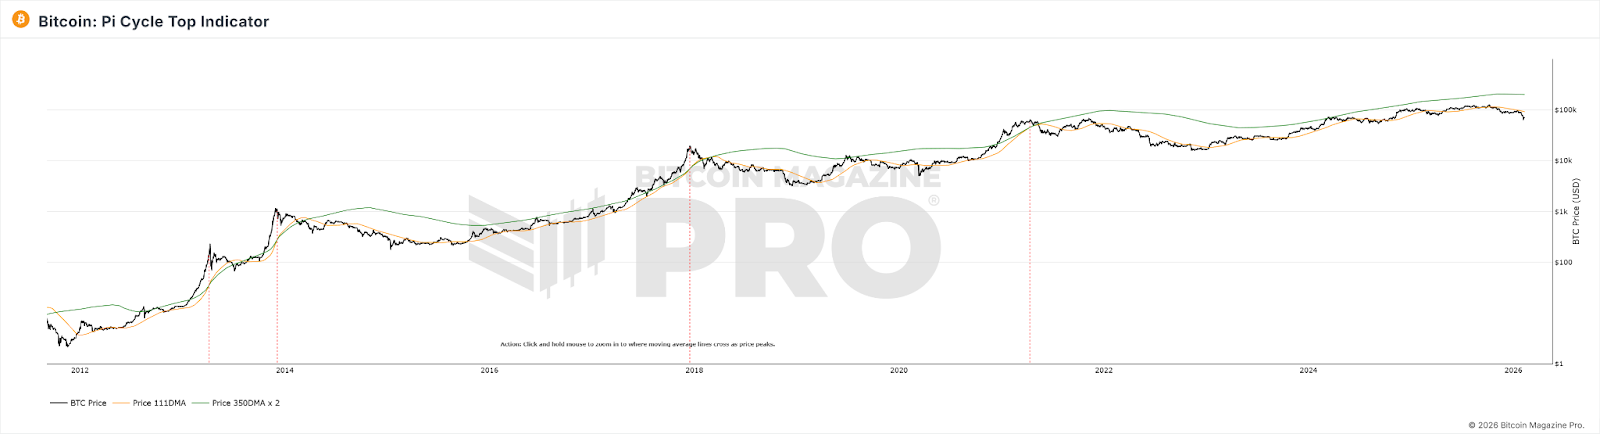
During the 2025 bull market cycle, the two moving averages have failed to produce an effective crossover, and the indicator has remained "silent." However, the downward trend of the market has become quite apparent.
The reason for this indicator's failure may be that the Pi Cycle Top relies on sharp price fluctuations, which cause the short-term moving average to deviate significantly from the long-term moving average to produce a crossover. With the structural decrease in Bitcoin's volatility due to ETF and institutional participation, BTC price movements have become smoother, reducing the parabolic upward trend driven by retail investors, making the prerequisite conditions for moving average crosses less likely to be met. Moreover, this indicator essentially fits the data from the early adoption phase (2013-2021), and after a qualitative change in the participant structure, the parameters fitted early on are likely no longer applicable.
MVRV Z-Score: Market Scale and Holding Patterns Changed the Calculation Basis
The MVRV Z-Score is an on-chain valuation metric that assesses market valuation by comparing Bitcoin's market value (current market capitalization) with realized value (the total value computed based on the price at the last on-chain movement of each Bitcoin). Traditionally, a Z-Score exceeding 7 is considered a sell signal indicating an overheated market, while below 0 is seen as a buy signal indicating extreme undervaluation.
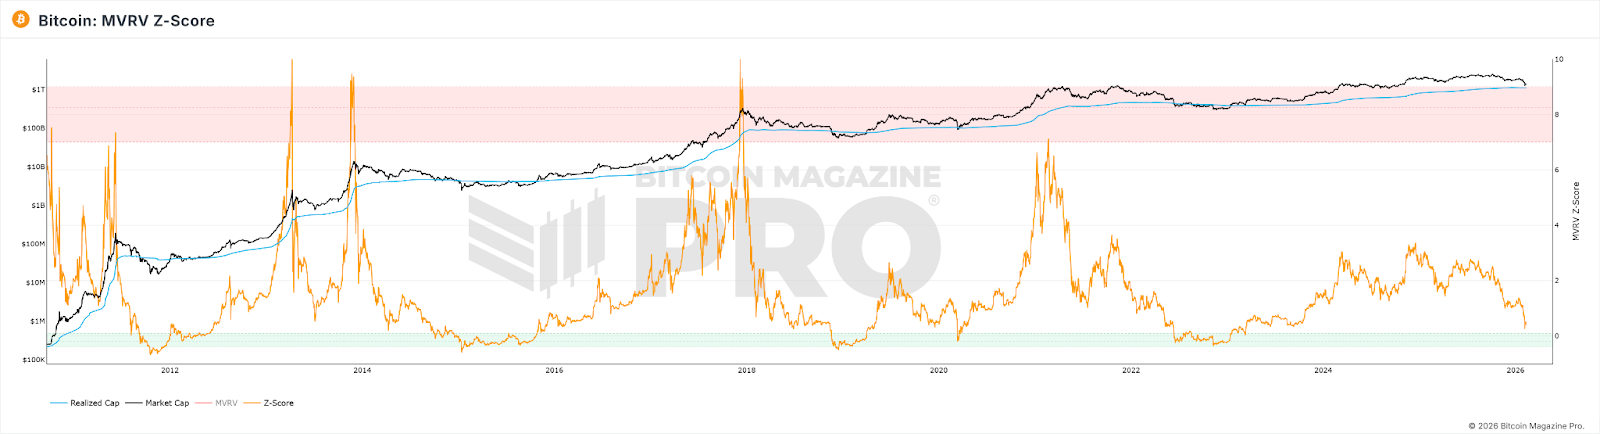
In terms of performance, even at the peak of the 2021 bull market, the Z-Score did not reach the heights of previous cycles, and the traditional fixed threshold (>7) was not triggered. By 2025, although Bitcoin prices reached a peak, the highest Z-Score was only 2.69.
Examining the reasons, several aspects may contribute:
1. Institutional buying at high prices and holding for the long term has systematically raised the Realized Value to a level closer to market value, compressing the volatility of MVRV.
2. The high-frequency movements of short-term active traders continuously "refresh" the active supply's RV to near the current price, further narrowing the gap between MV and RV.
3. After the market's total capitalization has expanded, to create extreme Z-Score values similar to earlier periods would require a geometrically increasing amount of capital.
The result of the interplay of these three factors is that the ceiling of Z-Score has been structurally lowered, and the originally set fixed threshold of "7=overheated" is no longer achievable.
Rainbow Chart: The Logarithmic Growth Assumption is Being Broken
The Bitcoin Rainbow Chart uses a logarithmic growth curve to fit the long-term price trend, dividing the price range into color bands from "extremely undervalued" to "bubble maximum," allowing investors to judge buy and sell timing based on this. In 2017 and 2021, the price indeed corresponded to the cycle peaks when it reached high-value color bands.
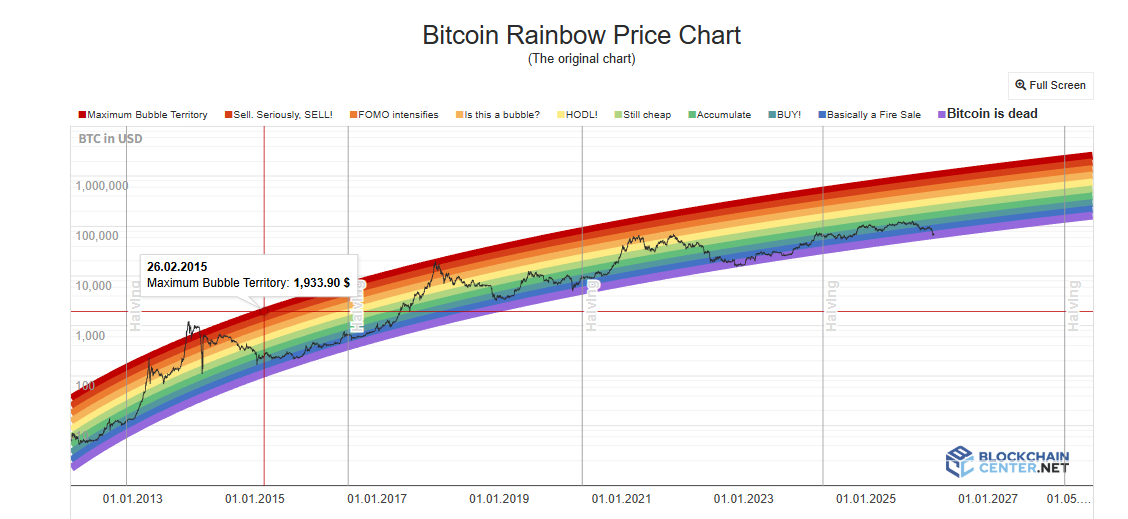
However, throughout the bull market cycle of 2024-2025, Bitcoin prices only lingered in the "HODL!" neutral zone, never approaching the deep red area that represents extreme bubbles. The top predictive function of the chart has hardly worked.
For the rainbow chart indicator, in this model, price is merely a function of time. It does not consider halving, ETFs, institutional funds, macro policies, or any other variables. Additionally, the volatility decrease brought about by institutionalization has systematically reduced the deviation of price around the trend line, making the fixed-width color bands no longer reachable. Furthermore, Bitcoin's growth is transitioning from the "steep segment of the adoption S-curve" to the "slow growth segment of mature assets," causing the extrapolated growth rate of the logarithmic function to be systematically higher than the actual growth rate, leading prices to remain below the centerline for a long time.
Altcoin Season Index and BTC Dominance: The Premise of "Capital Rotation" Has Changed
The Altcoin Season Index measures the percentage of the top 100 altcoins that have outperformed BTC over the last 90 days, with a value above 75 considered as "altcoin season." BTC Dominance (the percentage of Bitcoin market cap to the total market cap) is viewed as a signal for capital flowing from BTC to altcoins when it falls below 50% or even 40%. In 2017, BTC Dominance fell from 85% to 33%, and in 2021 from 70% to the 40% range, both corresponding to large-scale altcoin rallies.
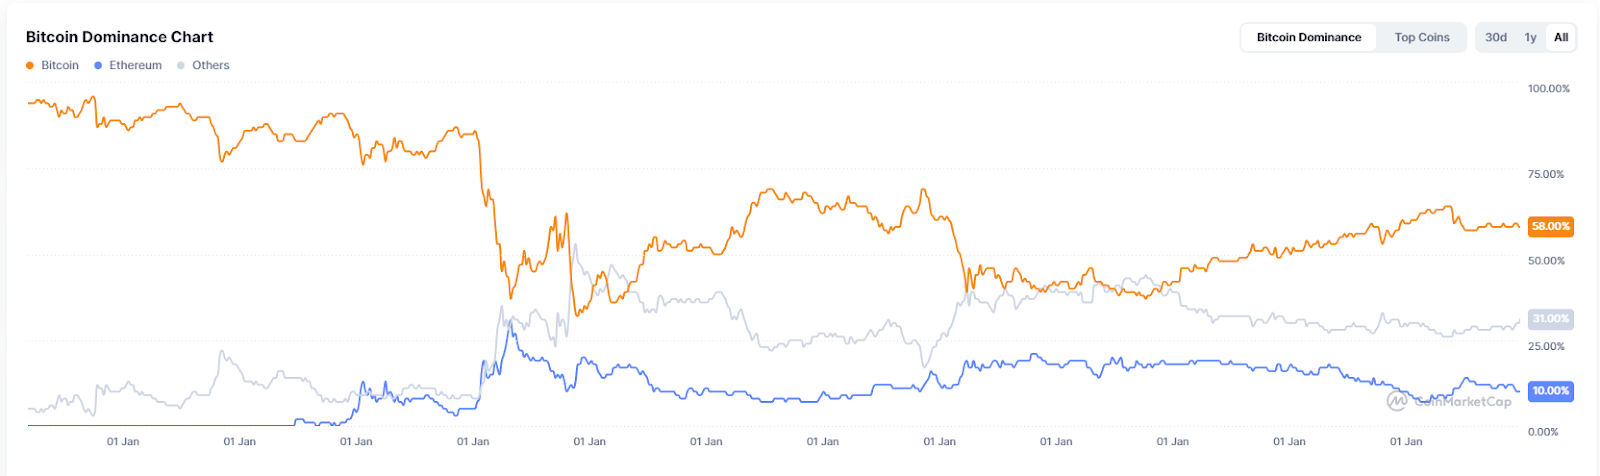
However, throughout 2025, the Altcoin Season Index remained below 30 for a long time, consistently in a "Bitcoin season." BTC Dominance peaked at 64.34% and never fell below 50%. By early 2026, the so-called "Altseason" was more characterized by precise narrative-driven local rotations, with only specific tracks like AI and RWA benefiting, rather than a generalized surge seen in the previous two cycles.
The deep reason for the failure of these two indicators is also due to the current market structure, where institutional and ETF funds have become dominant. These funds exhibit a significantly higher risk preference for Bitcoin compared to altcoins. Additionally, a large amount of capital siphoned away by the market frenzy surrounding AI and precious metals has made the inflow of funds into the crypto market much lower. Incremental funds attracted by Bitcoin ETFs flow directly into BTC, and structurally, these funds will not "rotate" into altcoins; ETF holders purchase financial products, not tickets to entry into the crypto ecosystem. Furthermore, the exhaustion of narratives within the altcoin ecosystem and the weakening liquidity support for new projects also serve as important reasons for the delay of altcoin seasons.
Fear and Greed Index: Retail Sentiment is No Longer the Determining Force of Price
The Crypto Fear and Greed Index synthesizes volatility, market momentum, social media sentiment, Google Trends, and other factors to derive a score from 0 to 100. The classic usage is to operate contrarily: buying in extreme fear and selling in extreme greed.
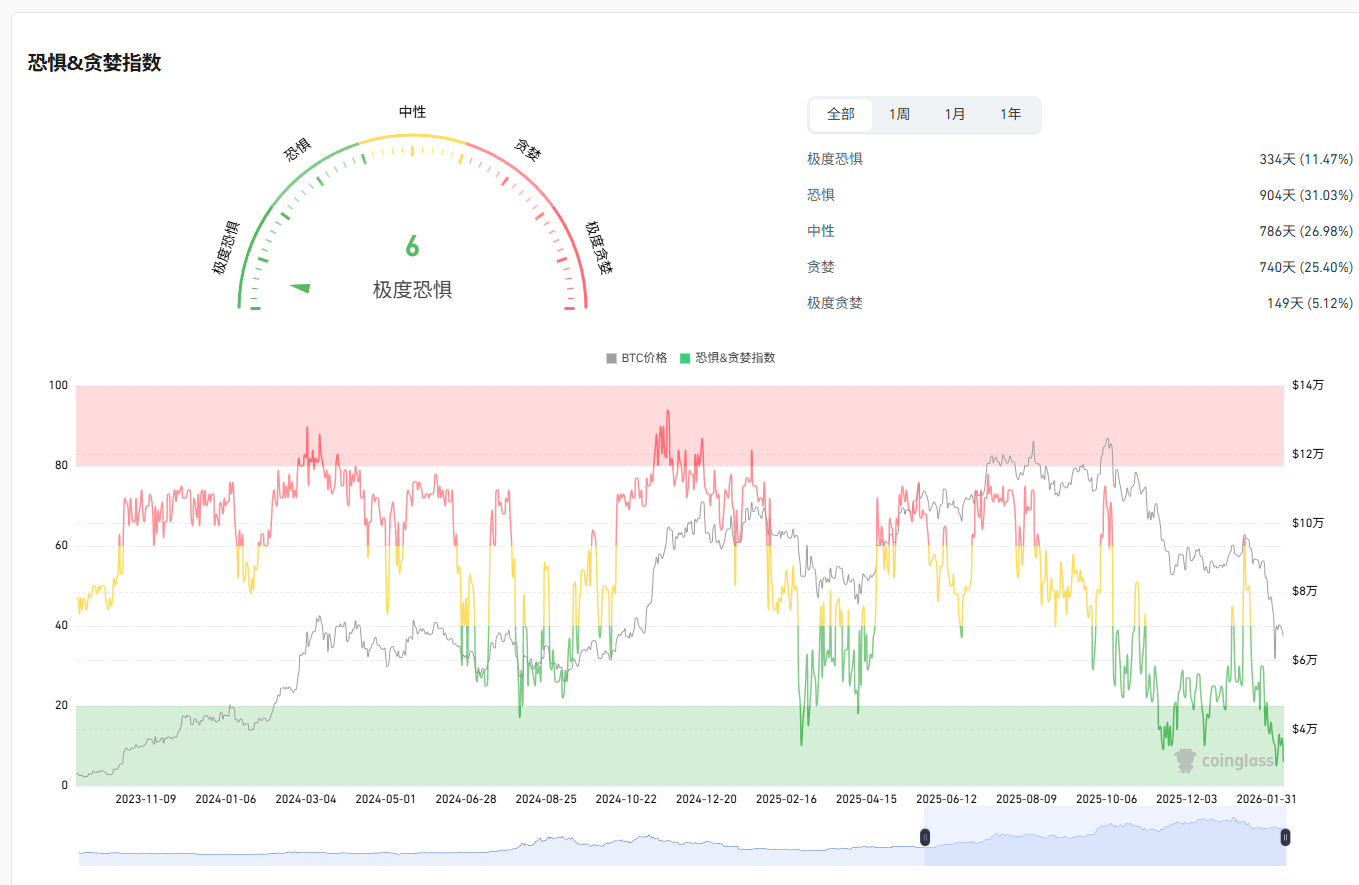
In April 2025, this index dropped below 10, lower than during the FTX collapse, but BTC did not experience the anticipated substantial rebound thereafter. The average for the entire year was only 32, with 27 days spent in the fear or extreme fear range. As a top signal, this indicator is similarly unreliable; in October 2025, when the market peaked, the index was only around 70.
The core reason for the failure of the Crypto Fear and Greed Index lies in the interruption of the transmission mechanism between sentiment and price by institutional funds. When retail investors are fearful, institutions may be buying the dip; when retail investors are greedy, institutions may be hedging with derivatives. This makes retail sentiment no longer the dominant force behind price movements.
NVT Ratio: On-Chain Transaction Volume No Longer Represents Real Economic Activity
The NVT ratio, known as the "crypto version of the price-earnings ratio," is calculated by dividing the network’s market cap by daily on-chain transaction volume. A high NVT might indicate overvaluation, while a low NVT may suggest undervaluation.
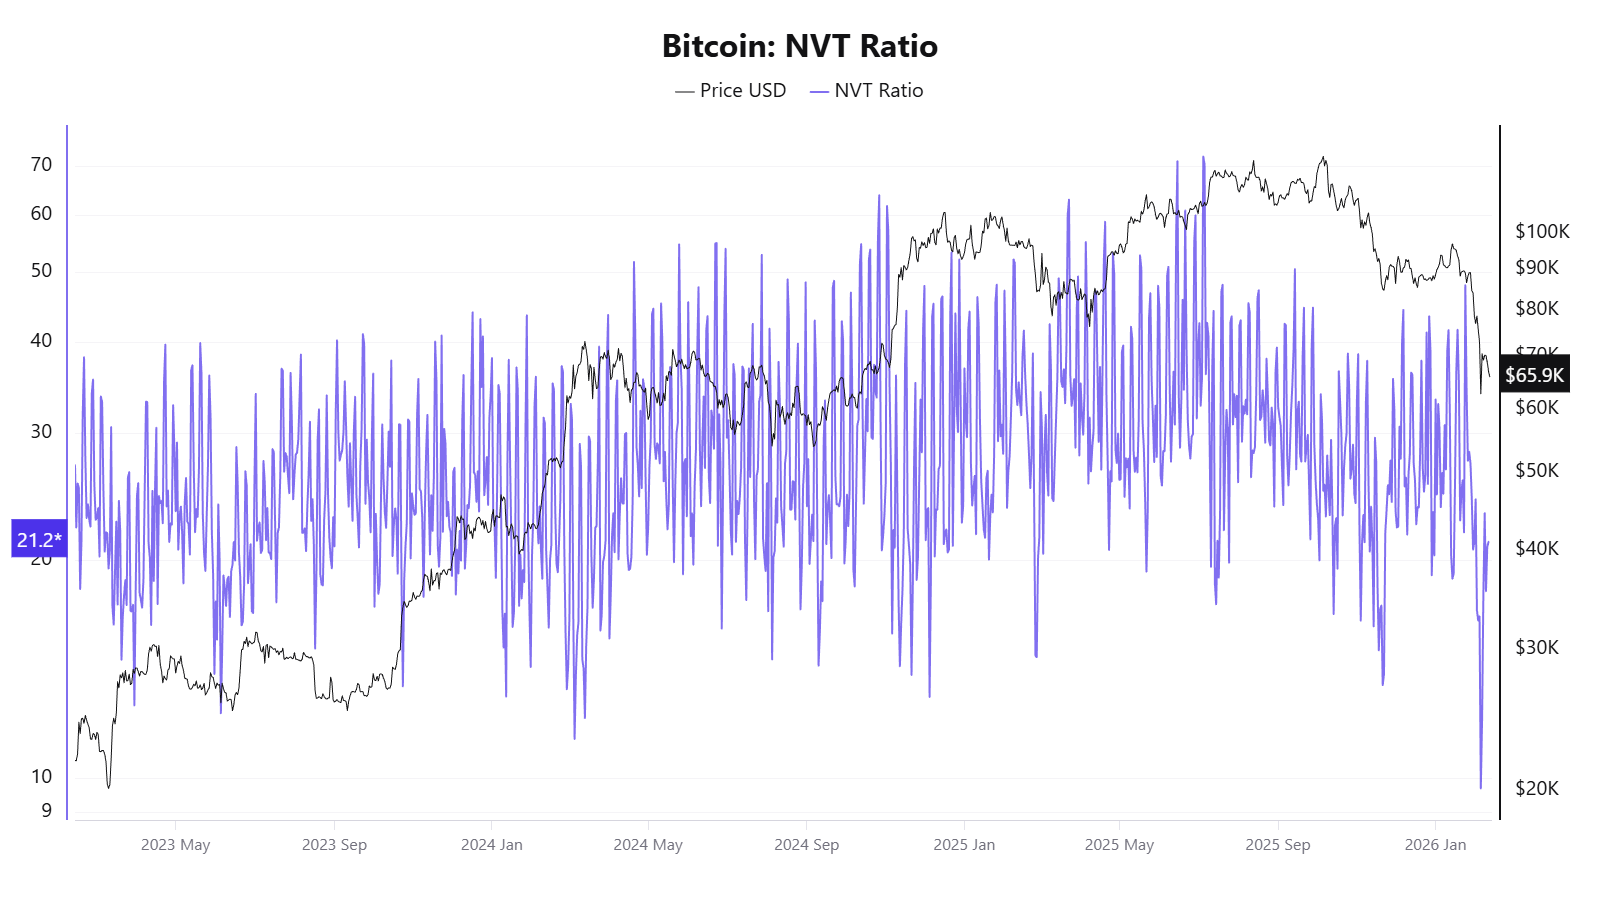
In 2025, this indicator exhibited contradictory signals. In April, when prices had not yet surged significantly, the NVT Golden Cross was as high as 58, but by October, when prices reached around $120,000, it showed that prices were undervalued.
The fundamental reason for the failure of NVT lies in its denominator, the on-chain transaction volume, which can no longer represent the real economic activity of the Bitcoin network.
S2F Model: The Cost of Only Looking at Supply and Ignoring Demand
The Stock-to-Flow model, proposed by an anonymous analyst known as PlanB in 2019, drew on the valuation logic of precious metals, measuring scarcity through the ratio of Bitcoin's stock to its annual increment, and fitting a price prediction curve through logarithmic regression. The core assumption is that after each halving, the S2F ratio doubles, and prices should rise exponentially.
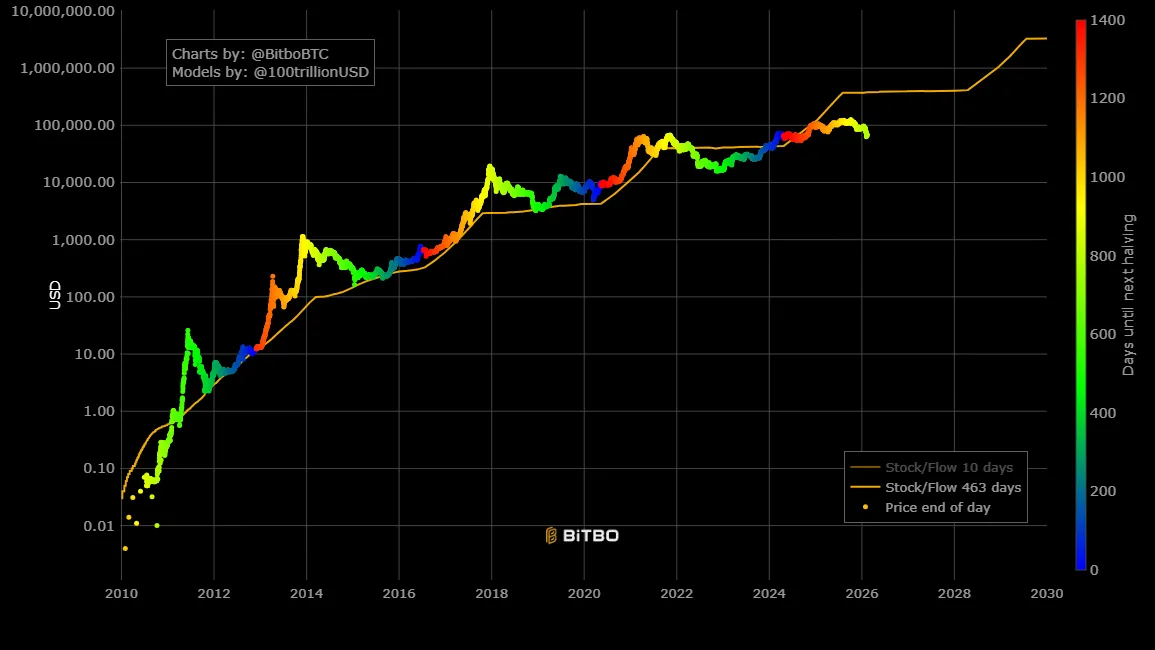
In terms of failure performance, in December 2021, the model predicted BTC should have reached about $100,000, while the actual price was around $47,000, a deviation exceeding 50%. In 2025, the model's target was $500,000, but the actual price was around $120,000, increasing the gap to over three times.
The root cause of the S2F failure lies in the fact that it is a purely supply-side model that completely ignores demand-side variables. Additionally, as Bitcoin's market value reaches the trillion-dollar level, sustaining exponential growth physically becomes increasingly difficult, and diminishing marginal returns is an unavoidable reality.
What has Failed is Not a Specific Indicator, but the Market Assumptions that These Indicators Reliably Depend On
Looking at the failure of these indicators together reveals that their dysfunction is not an isolated event but points to the same set of structural changes:
Institutionalization has altered the microstructure of the market: Bitcoin ETFs, corporate treasury allocations, CME derivatives, and the entry of pension funds have collectively changed the structure of capital and price discovery mechanisms. Institutions tend to buy on dips and hold long-term, smoothing out the extreme volatility previously driven by retail sentiment. This makes all indicators relying on extreme volatility or sentiment signals difficult to operate as they once did, along with AI and precious metals siphoning off funds, reducing liquidity in the crypto market.
The structural decrease in volatility is the direct technical reason for the failure of multiple indicators: Pi Cycle Top and the Rainbow Chart require extreme price increases to trigger signals, MVRV needs a significant deviation between market cap and cost basis, and funding rates need an extreme bullish vs bearish imbalance. When volatility decreases from 100% to 50%, these conditions become harder to meet.
Bitcoin's "asset type" is migrating: from a digital commodity to a macro-financial asset, the price drivers of Bitcoin are shifting from on-chain variables (halving, on-chain activity) to macro factors like Fed policy, global liquidity, and geopolitics. Those focusing on analyzing on-chain data are facing a market increasingly dominated by off-chain factors.
The representativeness of on-chain data itself is declining: Layer 2 transactions, internal exchange settlements, ETF custodial models—these trends are eroding the data foundation of on-chain indicators, making it increasingly challenging for indicators such as NVT and MVRV that rely on on-chain transaction data to capture the complete picture.
Additionally, most classic indicators are fundamentally based on curve fitting from 3-4 halving cycles, with a very small sample size, making them prone to failure when market conditions undergo a qualitative change.
For ordinary investors, the collective failure of these indicators conveys perhaps a simpler signal: understanding the assumptions and applicable boundaries of each indicator may be more important than pursuing a universal prediction tool. Over-reliance on any single indicator can lead to misjudgments, and in a phase where the underlying rules of the market are being rewritten, maintaining cognitive flexibility may be more pragmatic than seeking the next "universal indicator."
免责声明:本文章仅代表作者个人观点,不代表本平台的立场和观点。本文章仅供信息分享,不构成对任何人的任何投资建议。用户与作者之间的任何争议,与本平台无关。如网页中刊载的文章或图片涉及侵权,请提供相关的权利证明和身份证明发送邮件到support@aicoin.com,本平台相关工作人员将会进行核查。


