Original title: Report: Is Fintech or DeFi a better financial system?
Original authors: LEX SOKOLIN, MARIO STEFANIDIS, AND JON MA
Translation by: Peggy, BlockBeats
Editor's note: For a long time, Fintech and DeFi were viewed as two entirely separate financial systems: one is compliant, centralized, and can be valued; the other is open, operates on-chain, and resembles a public utility. Fintech excels at turning traffic into revenue, while DeFi maximizes efficiency. As tokenization, stablecoins, and on-chain transactions continuously infiltrate traditional systems, the integration has become irreversible. So, will future finance establish toll booths on the open road, or will the toll booths eventually learn to walk the open road?
This article compares and analyzes Fintech and on-chain protocols (Onchain Protocols) from four dimensions: revenue, scale, user numbers, and take rate, attempting to answer whether DeFi will win or Fintech will win?
Below is the original text:
Good morning, Fintech architects, today we bring you truly heavyweight content.
We have collaborated with analytics firm Artemis (referred to as the "Bloomberg Terminal of digital finance") to officially release the first comparative analysis of key indicators (KPI) between Fintech and DeFi in history.
If you've ever been torn between investing in Robinhood or Uniswap, you're in the right place.
Summary
We placed Fintech stocks and crypto tokens on the same "comparison chart" for a true side-by-side examination.
Covering multiple tracks such as payments, digital banks, trading, lending, and prediction markets, we compared revenue, user scale, take rates, industry key metrics, and valuation indicators.
The results are quite surprising:
Hyperliquid's trading volume has surpassed 50% of Robinhood's
The loan scale of DeFi protocol Aave exceeds that of buy now pay later platform Klarna
The growth rate of stablecoin payment channels is far faster than traditional payment service providers
Wallet users like Phantom and MetaMask can now rival new banks like Nubank and Revolut
We found that valuations truly reflect this tension: crypto assets are either heavily discounted due to the unclear monetization of the future or are assigned extreme premiums due to overly high expectations.
Finally, we pose a core question about "integration": will the crypto world learn to establish toll booths, or will Fintech ultimately adopt crypto's open payment and settlement channels?
Involved Parties
Block, PayPal, Adyen, Tron, Solana, Coinbase, Robinhood, Uniswap, Aave, Affirm, Klarna, Polymarket, DraftKings
Two Financial Systems
For years, we have seen the crypto world and Fintech as two parallel universes: one regulated, audited, and traded on NASDAQ, the other an unlicensed system with assets circulating in decentralized and centralized exchanges.
They use the same language: revenue, trading volume, payments, lending, trading, but with entirely different "accents." And this pattern is changing.
As Stripe acquired Bridge, Robinhood launched prediction markets, and PayPal began issuing its own USD stablecoin, the boundaries between the two systems are gradually blurring.
The real question is: when these two worlds truly meet and collide, how should they be compared on the same comparison chart?
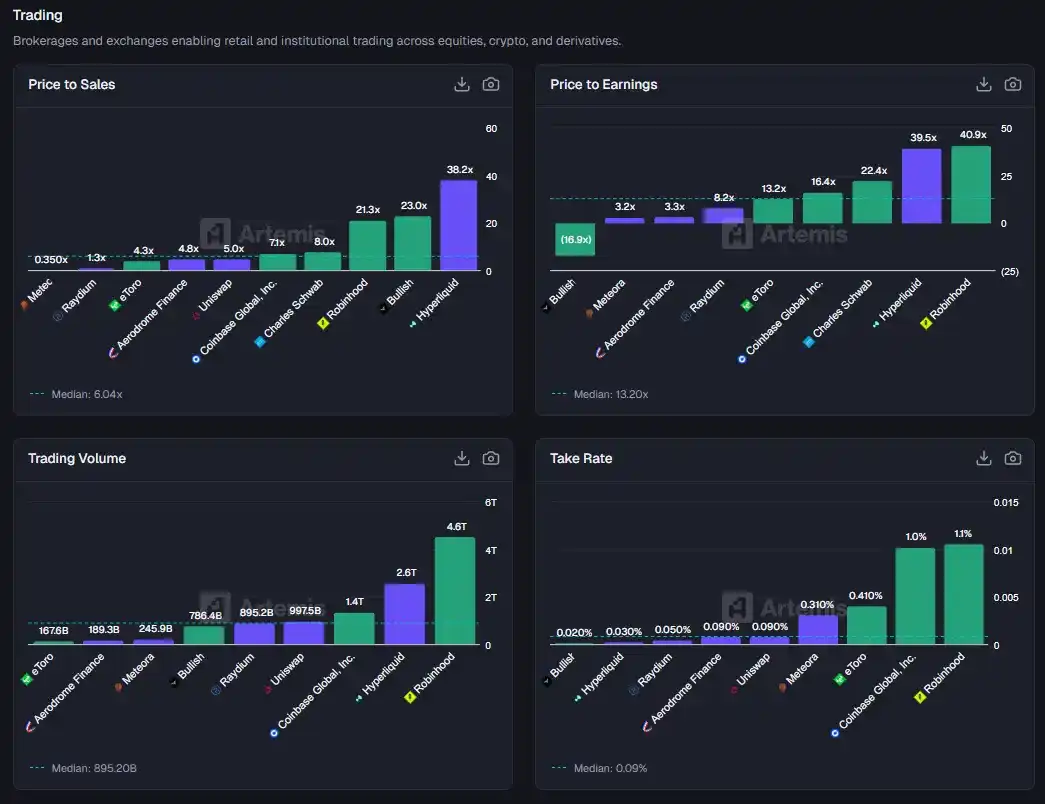
Comparing brokerages and DEXs on the same chart. Purple represents crypto assets, green represents stocks. Robinhood ranks first in trading volume, but the second is Hyperliquid…
Thus, we decided to conduct an experiment.
We selected familiar Fintech companies—covering payment processors, digital banks (neobanks), buy now pay later (BNPL) institutions, and retail brokerages—and compared them one-to-one with their crypto-native counterparts.
In the same set of charts, we used Fintech metrics you are already accustomed to (like P/S, ARPU, TPV, number of users, etc.): green bars represent stocks, and purple bars represent tokens.
This gradually reveals a picture of two financial systems: on-chain financial protocols can often match or even exceed their Fintech counterparts in trading volume and asset scale; however, the economic value they capture is only a small part of the total; relative to comparable Fintech firms, crypto asset pricing is either extremely overvalued or deeply undervalued, with almost no "middle ground"; and the gap in growth rates is even wider.
Payments: The "Pipelines" of Money Flow
Let's start with the largest sector in Fintech—moving money from point A to point B.
On the green side, there are real giants:
PayPal: processes $1.76 trillion in payments annually
Adyen: processes $1.5 trillion
Fiserv: this "infrastructure company that no one talks about at parties," processes $320 billion
Block (formerly Square): facilitates $255 billion in flows through Cash App and its merchant network
These companies constitute the most mature and stable "pipeline layer" in the traditional Fintech system.
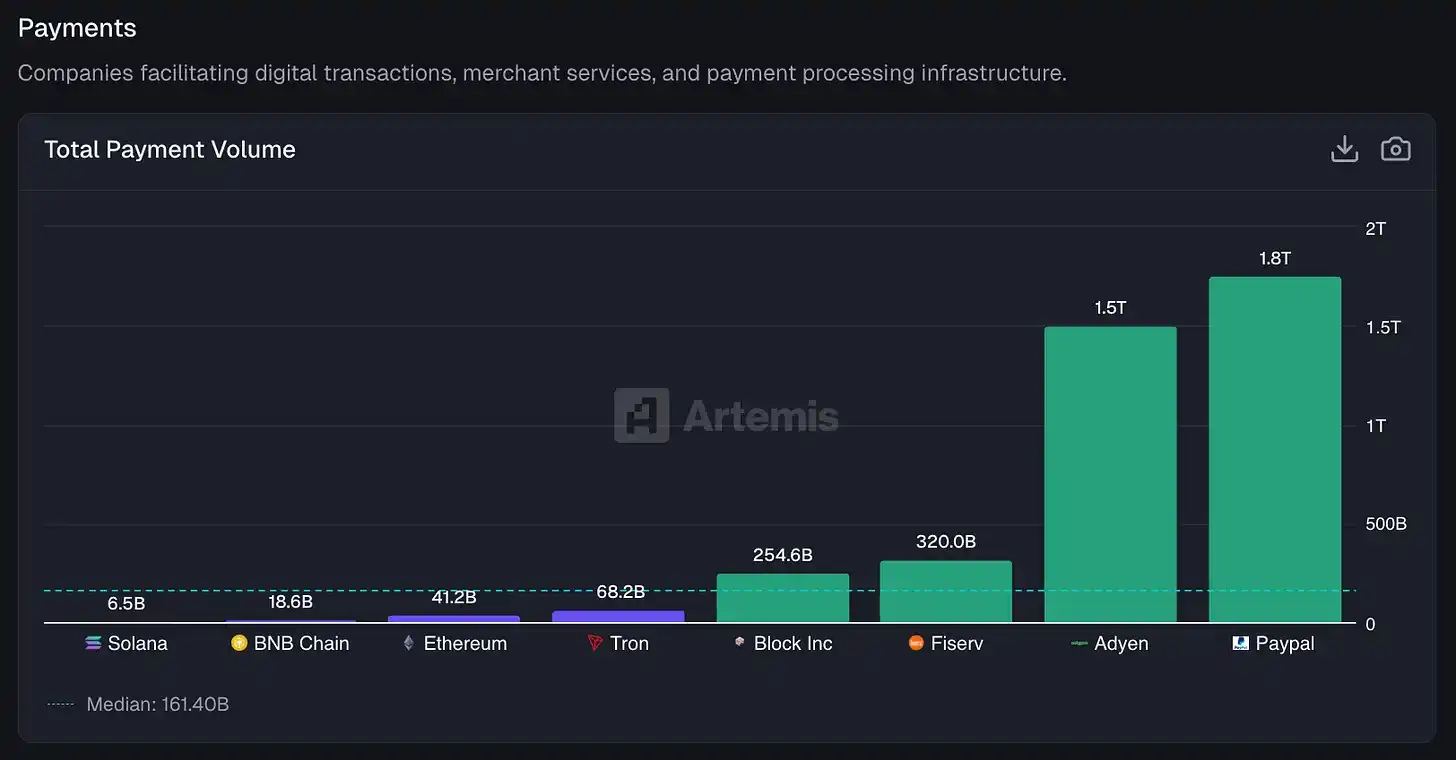
The total payment volume (TPV) comparison between blockchain and Fintech. For the blockchain part, we estimate its B2B payment volume based on Artemis's research; for public companies, we extract TPV data from Adyen, Fiserv, and Block's public financial reports.
On the purple side, we have the annualized B2B payment volumes estimated by Artemis's stablecoin team:
Tron: stablecoin transfer volume of $68 billion
Ethereum: $41.2 billion
BNB Chain: $18.6 billion
Solana: approximately $6.5 billion
From an absolute value perspective, the two sides are not on the same level. The total stablecoin transfer volume across all major public blockchains is roughly equivalent to only 2% of the payment processing scale of Fintech providers. If you squint at that market share chart, the purple bars are almost just rounding errors.
But the really interesting part is the growth rate.
PayPal's total payment volume only grew by 6% last year
Block grew by 8%
Adyen, the European "darling," achieved a growth of 43%—already quite strong by Fintech standards
Now let's look at blockchain:
Tron: growth of 493%
Ethereum: growth of 652%
BNB Chain: growth of 648%
Solana: year-over-year growth of 755%, the fastest growth
Once again, these data come from Artemis's data team based on McKinsey research estimating B2B payment volumes.
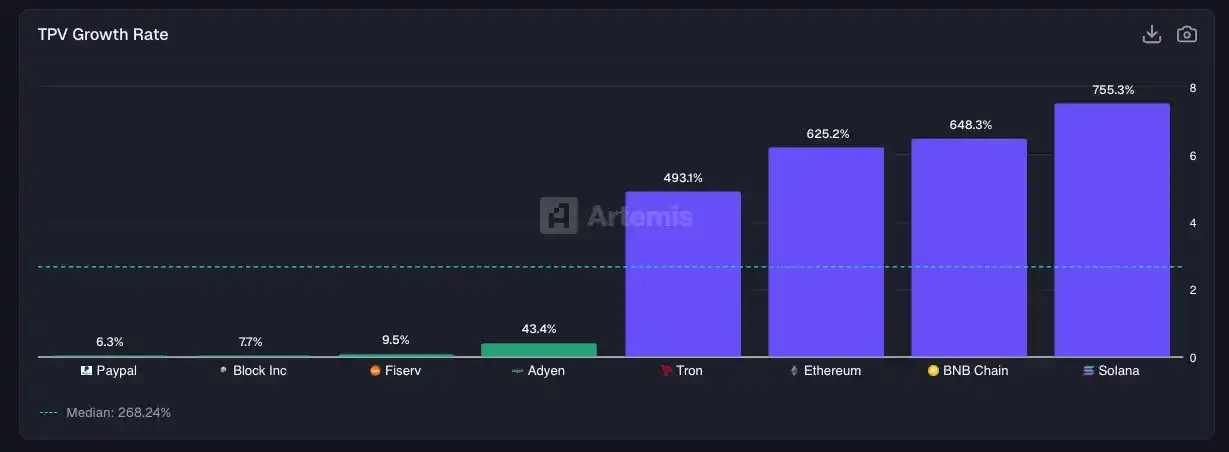
TPV growth rate: Our calculation method is to take the last twelve months (LTM) TPV, divided by the same period's LTM TPV from the previous year.
The results are very clear: the growth rate of stablecoin "payment rails" is far faster than that of traditional Fintech payment systems.
Of course, they also started from a much smaller base.
The next question becomes: who is actually capturing the economic value?
Fiserv: takes 3.16% on every dollar it handles
Block: takes 2.62%
PayPal: takes 1.68%
Adyen: due to adopting a lower-margin enterprise model, it takes only 15 basis points (0.15%)
All of these are real commercial companies, their revenue is directly and stably tied to payment volumes.
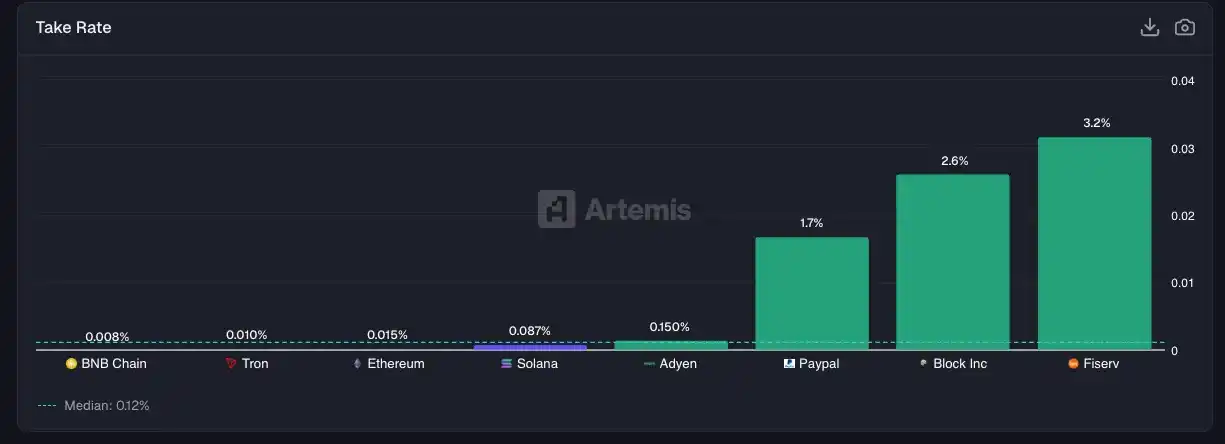
As for the blockchain side, its take rate on stablecoin transfers and broader asset transfers is much lower, roughly between 1-9 basis points (bps). Tron covers its stablecoin transfer costs by charging users TRX, while Ethereum, BNB Chain, and Solana charge end-users Gas fees or priority fees.
These public chains are very strong in facilitating transfers and promoting asset liquidity, but compared to traditional payment service providers, their take rates are significantly lower. Avoiding things like interchange fees and merchant fees is one of the important reasons blockchain can claim a significant efficiency advantage over existing payment systems.
Of course, there are also a lot of on-chain payment orchestrators that are happy to layer additional fees on top of base costs—this constitutes a substantial opportunity for "facilitators" to build economic value upon.
Digital Banks (Neobanks): Wallets Become New Bank Accounts
In the digital banking sector of Fintech, there are real banks (or "licensed banks"), like Revolut, Nubank, SoFi, Chime, Wise. These institutions have licenses, deposit insurance, and compliance departments.
On the crypto side, we see wallets and yield protocols, like MetaMask, Phantom, Ethena, EtherFi. They are certainly not "banks," but millions of people store assets here; and an increasing number are earning yields on their savings here. Even if the regulatory shells are different, this functional comparison still holds.
Let's start with user scale: Nubank has 93.5 million monthly active users (MAU), making it the largest digital bank globally, a scale built on the high smartphone penetration in Brazil and the extremely complex local banking system; Revolut has 70 million users in Europe and beyond; next is MetaMask, with about 30 million users—this scale has now surpassed Wise, SoFi, and Chime.
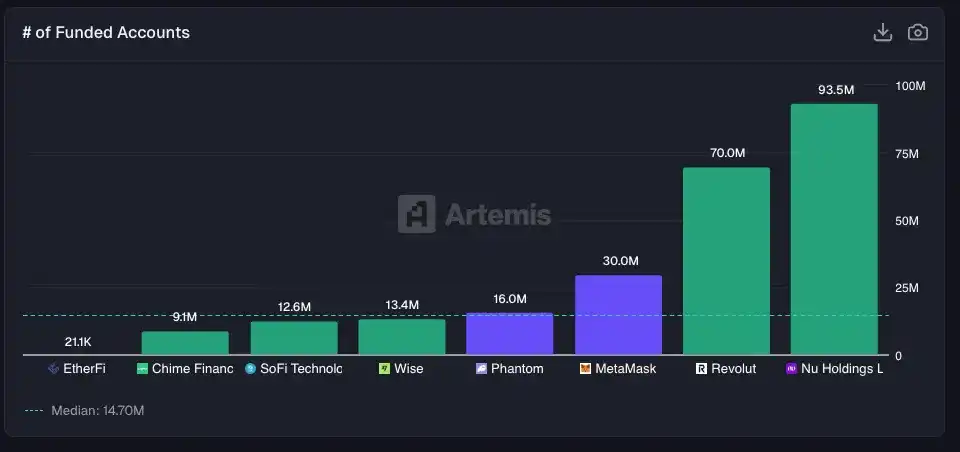
Monthly active users (MAU) by application. Nu, Wise, SoFi, and Chime MAU data comes from company disclosure documents; EtherFi data is sourced from Artemis; Phantom, MetaMask, and Revolut data come from their respective public sources.
It is important to note that most MetaMask users are not using the crypto wallet to pay rent but are using it to interact with DEX or participate in lending protocols. Another leading wallet, Phantom, has 16 million monthly active users. Phantom initially positioned itself as the best wallet within the Solana ecosystem but quickly expanded across multiple chains and has since launched its own stablecoin $CASH, debit card, tokenized stocks, and prediction market products.
Now, let’s look at where the money is kept.
Revolut: customer balances of $40.8 billion
Nubank: $38.8 billion
SoFi: $32.9 billion
These are real deposits bringing net interest income to institutions.
In the crypto world, there are highly similar counterparts:
Ethena: this synthetic dollar protocol that didn't exist two years ago now holds $7.9 billion
EtherFi: has a scale of $9.9 billion
They are not "deposits," but staked assets, yield-bearing positions, or liquidity held in smart contracts—known in industry terminology as TVL (Total Value Locked).
But from the user's perspective, the logic is not fundamentally different: money is kept somewhere and continuously generates yield.
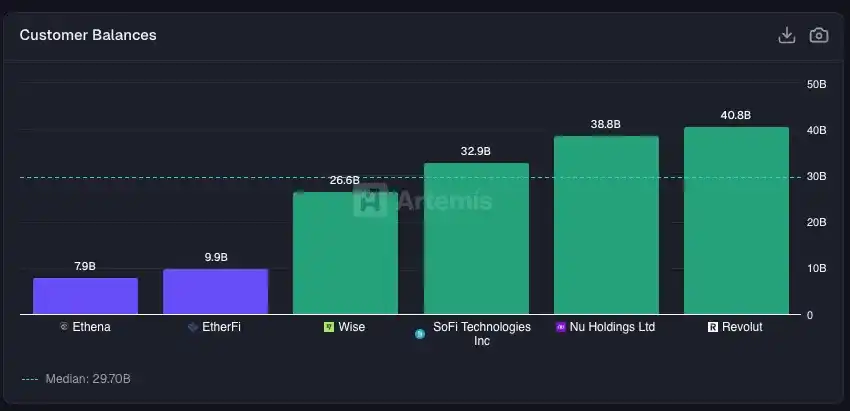
Balance comparison of customer funds between Fintech / Crypto. Wise, SoFi, Nu data come from company financial disclosures; Revolut from public press releases; EtherFi and Ethena data are sourced from Artemis.
The real difference lies in how these platforms monetize the "existing funds" and how much they can earn from users.
SoFi: average annual revenue of $264 per user. This is not surprising—SoFi heavily cross-sells between loans, investment accounts, and credit cards, serving a higher-income user base overall.
Chime: average revenue of $227 per user, primarily from interchange fees.
Nubank: operates in a market with lower per capita GDP in Brazil, averaging $151 per user.
Revolut: despite having a large user base, only $60 per user on average.
And what about EtherFi? An average of $256 per user, almost on par with SoFi.
However, this new crypto entrant faces a disadvantage: EtherFi has only about 20,000 active users, while SoFi has 12.6 million.
This means this DeFi protocol has achieved revenue capabilities comparable to top digital banks on a very small user base.
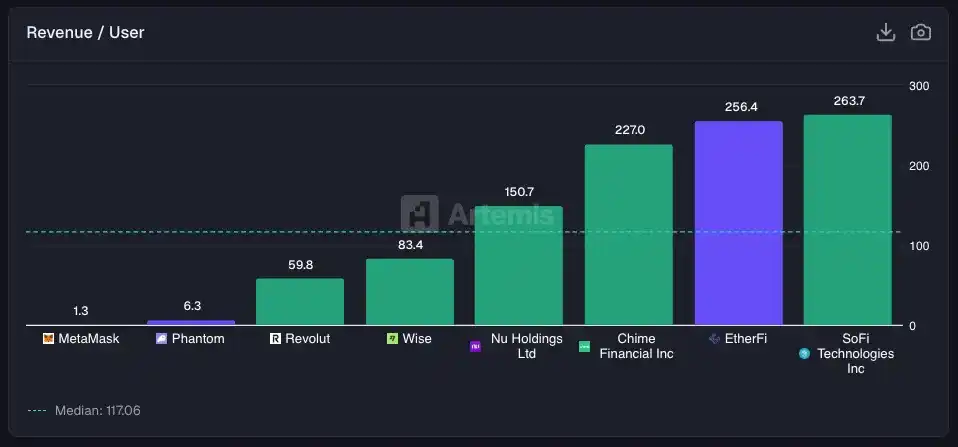
Revenue per user for the last 12 months (LTM) / number of funded accounts. Revenue data for Revolut, Wise, Nu, Chime, SoFi comes from public disclosures; data for Phantom and MetaMask comes from Dune.
From another perspective, MetaMask generated roughly $85 million in revenue last year, which translates to an ARPU of about $3, still below Revolut's early stage levels.
While Ethena has $7.9 billion in TVL, its user reach is still just a fraction of Nubank's.
Valuation is a direct reflection of this "growth vs. monetization capability" binary tension.
Revolut’s valuation is around 18 times revenue, reflecting its market positioning and the "option value" of future expansion; EtherFi's valuation is about 13 times; Ethena around 6.3 times, roughly aligning with SoFi and Wise.
A rather counterintuitive conclusion is emerging: the market is treating DeFi/on-chain "banks" and traditional Fintech banks in a remarkably similar way at the valuation level.
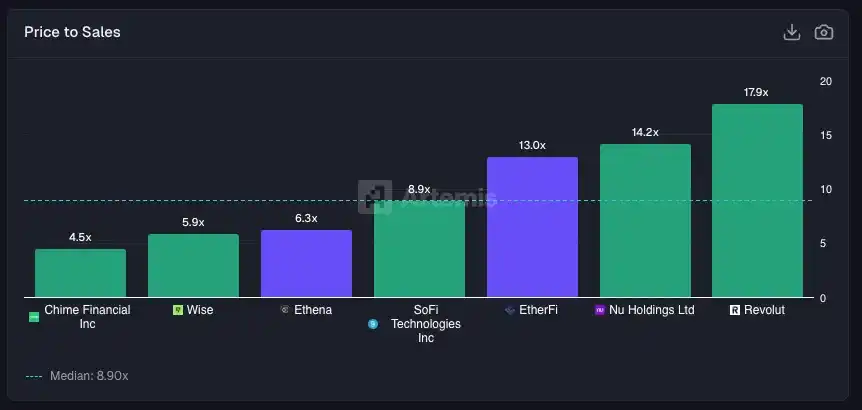
Market capitalization / sales (Marketcap / Sales) comparison of digital banks and crypto "on-chain banks." Token market cap data comes from Artemis, stock market cap data comes from Yahoo Finance.
The so-called "convergence thesis" suggests that wallets will eventually evolve into digital banks.
We have already seen concrete manifestations of this trend: MetaMask launched a debit card, Phantom integrated fiat deposit and withdrawal channels. The direction is clear, it's just still in progress.
But when on-chain "digital banks" like EtherFi have per-user revenues already higher than Revolut, the gap between them may not be as large as the narrative suggests.
Trading: On-chain DEX Approaching Traditional Brokerages
Let's shift our perspective to the capital markets.
What really surprised us is that the trading volume of on-chain exchanges is now comparable to that of traditional brokerages.
In the last 12 months, Robinhood processed $4.6 trillion in trading volume, primarily from stocks, options, and crypto assets, corresponding to an asset scale of about $300 billion (give or take).
Hyperliquid's spot and perpetual contract trading volume is about $2.6 trillion, primarily driven by crypto trading, although stocks and commodities are starting to gain market share.
Coinbase's trading volume is about $1.4 trillion, almost entirely from crypto assets.
The "old guard" Charles Schwab did not disclose trading volume in the same way, but its $11.6 trillion in assets under custody is enough to illustrate the scale gap between new and old money—roughly 40 times that of Robinhood.
This also outlines a clear contrast: on-chain trading has reached "traffic" levels nearing mainstream brokerages, but in terms of "stock assets," the traditional system still holds an overwhelming advantage.
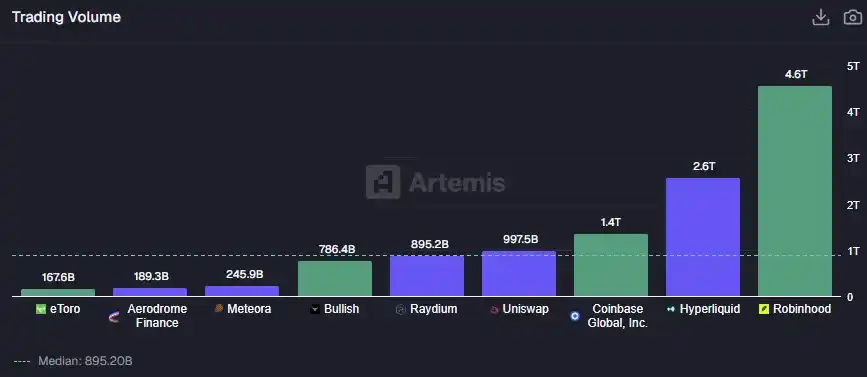
Trading volume data sources: eToro, Bullish, Coinbase, Robinhood's trading volumes come from company financial disclosures; Hyperliquid's spot + perpetual trading volumes, and DEXes like Raydium, Uniswap, Meteora, Aerodrome are sourced from Artemis.
Other decentralized exchanges are also not to be ignored. For instance, Uniswap, which has demonstrated the feasibility of automated market makers (AMMs), has trading volumes close to $1 trillion; Raydium (the top DEX in Solana ecosystem) completed $895 billion; Meteora and Aerodrome contributed about $435 billion in total.
In total, the processing scale of major DEXs is already comparable to that of Coinbase. Just three years ago, this was almost unimaginable.
Of course, we do not know how much of that trading volume is wash trading versus real trades; but the trend itself is what matters. Moreover, while the "convergence" in trading volumes is real, there is a fundamental difference in take rates (take rate) between DEXs and traditional brokerages.
Traditional brokerages/centralized platforms:
Robinhood: takes 1.06% per trade, primarily from payment for order flow (PFOF) and crypto spreads
Coinbase: approximately 1.03%, with high spot trading fees still common among centralized exchanges
eToro: even so, takes 41 basis points
DEXs operate in a completely different universe:
Hyperliquid: 3 basis points
Uniswap: 9 basis points
Aerodrome: 9 basis points
Raydium: 5 basis points
Meteora: 31 basis points (an obvious exception)
Decentralized exchanges can generate extremely high trading volumes, but due to intense competition for liquidity providers (LPs) and traders, their take rates are significantly compressed.
This is quite similar to the division of labor in traditional markets: true exchanges (like NASDAQ, Intercontinental Exchange) and brokers bringing customers to trading venues inherently have different functions.
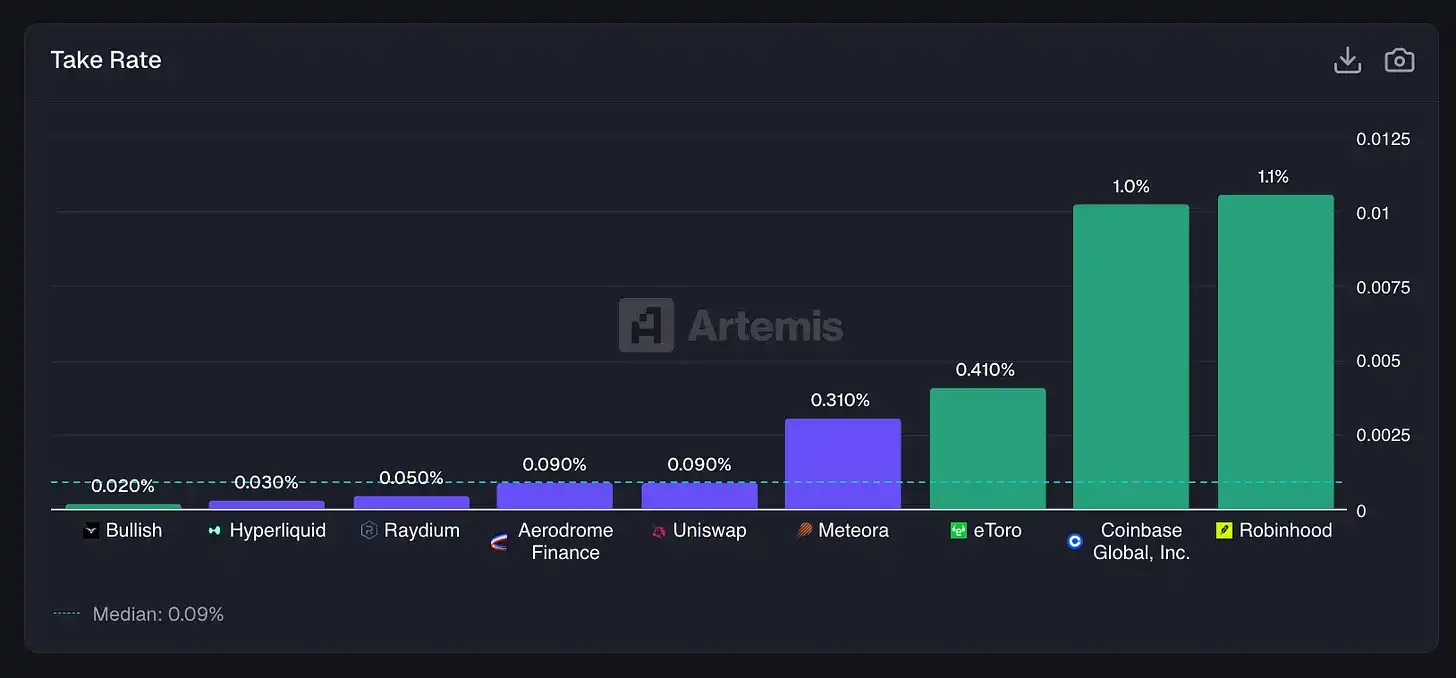
Take Rate = Last Twelve Months (LTM) revenue / trading volume. eToro, Coinbase, Robinhood, Bullish's revenue data comes from company financial reports; Raydium, Aerodrome, Uniswap, Meteora data are sourced from Artemis.
This is precisely the paradox of DEXs.
DEXs have built trading infrastructure that can compete directly with centralized exchanges in terms of trading volume: running 24/7, with almost no downtime, not needing KYC, and anyone can list tokens. However, on $1 trillion in trading volume, even with a 9 basis point take rate, Uniswap can only generate about $900 million in fees, or about $29 million in revenue; whereas on $1.4 trillion in trading volume, a 1% take rate allows Coinbase to generate $14 billion in revenue.
In market valuation, this difference is accurately reflected:
Coinbase: 7.1× Sales
Robinhood: 21.3× (high for a brokerage, but supported by growth)
Charles Schwab: 8.0× (a mature multiple for a mature business)
Uniswap: 5.0× Fees
Aerodrome: 4.8× Fees
Raydium: 1.3× Fees
The conclusion is not complex: the market is not pricing these protocols as "high-growth tech companies"; one important reason is that—they have lower take rates than traditional brokers, and thus capture less economic value.
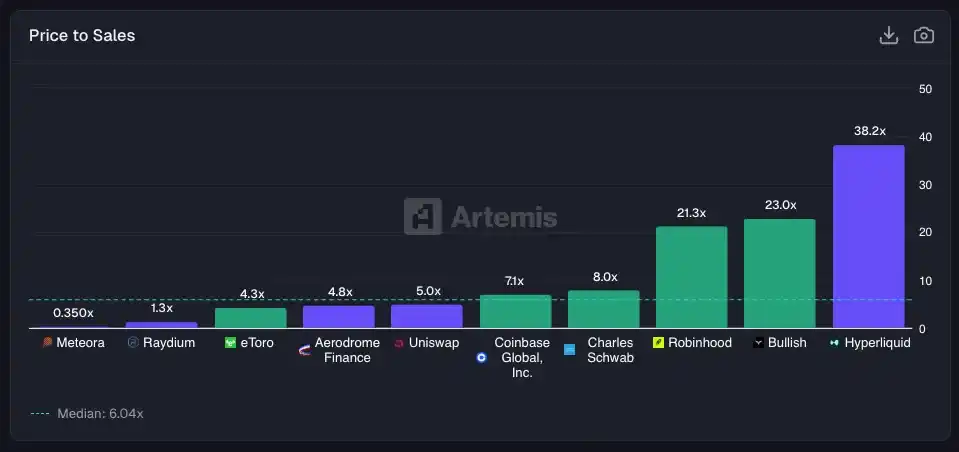
Market capitalization / Last Twelve Months (LTM) revenue. Public companies' market cap data comes from Yahoo Finance, token market cap data comes from Artemis.
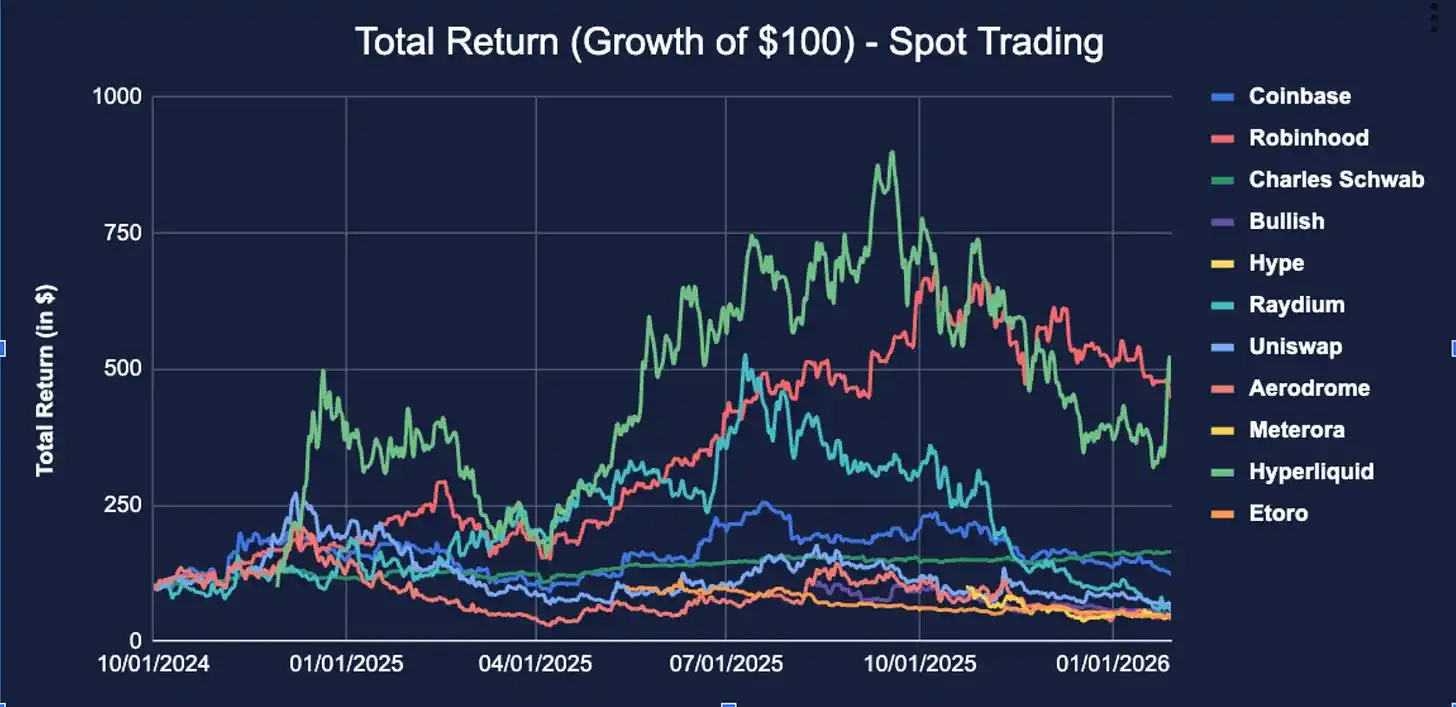
From stock performance perspectives, the direction of market sentiment is clear.
Robinhood's stock has increased about 5.7 times since the end of 2024, benefiting from the revival of retail investing and the rebound in crypto markets; Coinbase rose about 20% during the same period; however, Uniswap, the protocol that "spawned thousands of DEX forks," saw its price (token) decline by 40%.
Despite significant trading volume continually flowing through these DEXs, corresponding tokens have not captured comparable value, partly because: their "utility" as investment tools is not sufficiently clear.
The only exception is Hyperliquid. Due to its explosive growth in scale, Hyperliquid's performance nearly mirrored Robinhood's, achieving a similar gain during the same time.
Historically, DEXs often struggled to capture value and were viewed as public goods, but projects like Uniswap are now beginning to activate their "fee switch"—using fees to buy back and burn UNI tokens. Currently, Uniswap's annualized revenue is around $32 million.
We remain optimistic about the future: as more trading volumes migrate on-chain, value is expected to gradually flow back to DEX tokens themselves, as evidenced by Hyperliquid's success.
But for now, until token holders implement a clear, direct value capture mechanism like Hyperliquid, the performance of DEX tokens will continue to lag behind the stocks of centralized exchanges (CEXs).
Lending: "Insuring" for the Next Generation of Financial Systems
In the lending segment, the comparison becomes more intriguing.
On one side, there is the core business of Fintech—unsecured consumer credit:
Affirm: allows you to split the purchase of a Peloton bike into four payments
Klarna: offers similar installment services for fast fashion
LendingClub: once pioneered the P2P lending model, later transformed into a true bank
Funding Circle: provides loan underwriting for small and medium enterprises
These companies share a highly consistent profit logic: charging borrowers interest rates higher than what's paid to depositors, while hoping default rates do not consume this interest spread.
On the other side, there is secured DeFi lending: Aave, Morpho, Euler
Here, borrowers collateralize ETH to borrow USDC and pay an algorithmically determined interest rate; if the collateral price drops to risky levels, the protocol automatically liquidates—no collection calls or write-offs for bad debts.
These are essentially two entirely different business models, merely both termed "lending."
Starting from Loan Scale
Aave's loans outstanding stand at $22.6 billion
which already exceeds the sum of the following companies:
Klarna: $10.1 billion
Affirm: $7.2 billion
Funding Circle: $2.8 billion
LendingClub: $2.6 billion
The largest DeFi lending protocol's loan volume has exceeded that of the largest BNPL platform.
Pause and take in this fact.
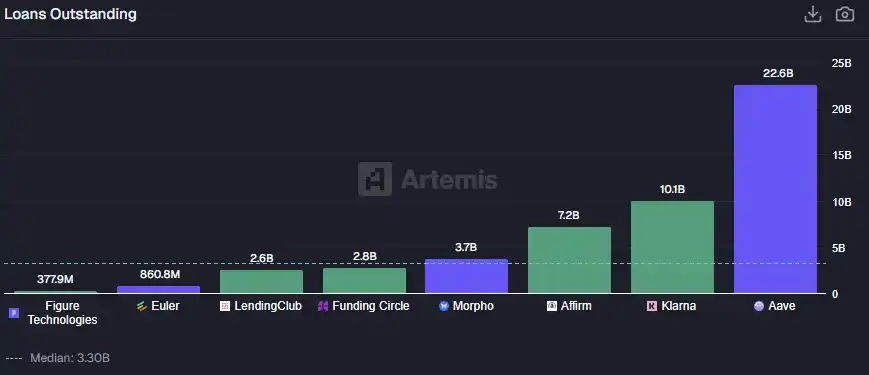
Total loan scale data for LendingClub, Funding Circle, Affirm, Klarna, and Figure comes from company financial disclosures; loan deposit data for Euler, Morpho, Aave comes from Artemis.
Morpho additionally adds $3.7 billion. Euler restarted after facing a hack in 2023, currently at $861 million.
Overall, the DeFi lending system has developed within about four years to a scale sufficient to compete with the entire listed digital lending industry—but its economic structure is inverted.
In traditional Fintech: Funding Circle has a net interest margin of 9.35% (this relates closely to its business model closer to private credit); LendingClub is at 6.18%; Affirm, although a BNPL company rather than a traditional lender, can still achieve 5.25%.
These are relatively "fat" interest spreads—essentially compensation for undertaking credit risk, conducting underwriting, and risk control.
On the crypto side: Aave's net interest margin is just 0.98%; Morpho is 1.51%; Euler is 1.30%.
Overall, while DeFi protocols may have larger loan volumes, the interest spreads generally are lower than those of Fintech lending institutions.
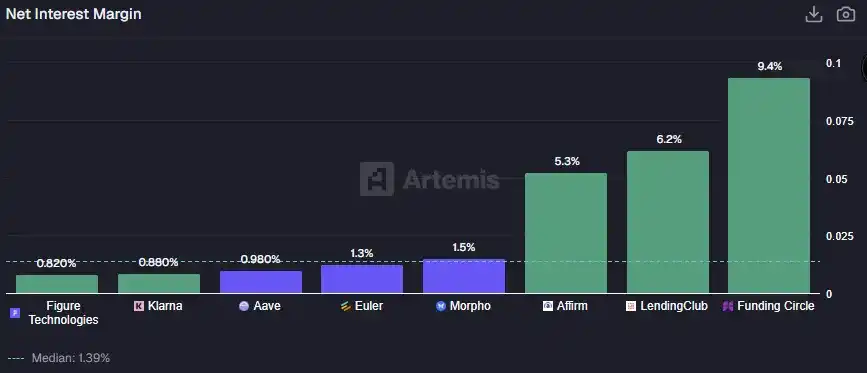
Net interest margins for Aave, Euler, Morpho calculated as: income / loans; public companies' net interest margins come from their financial disclosures.
DeFi lending is designed to be over-collateralized.
When borrowing $100 on Aave, you usually need to provide $150 or even more in collateral. The protocol itself does not assume credit risk, but rather liquidation risk—which is an entirely different nature of risk.
The fees paid by borrowers essentially cover leverage and liquidity, not for obtaining credit qualifications that were previously unobtainable.
Fintech lenders, on the other hand, do the exact opposite. They provide unsecured credit to consumers to meet "buy now, pay later" demands; the presence of interest spreads compensates for those who essentially won't pay back.
This is directly reflected in the data for losses caused by actual defaults, and managing these default risks is the core work of underwriting and risk control.
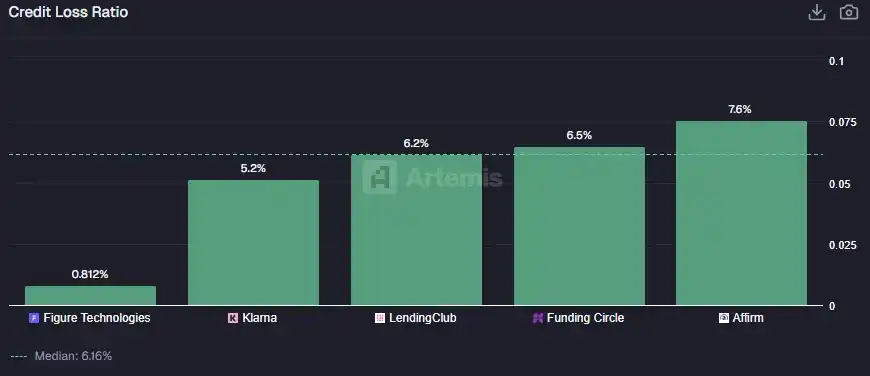
Public company credit loss ratio data comes from public financial records.
So, which model is better? The answer depends on what goal you want to optimize.
Fintech lending services those who currently have no money but wish to consume first; thus, they must bear true credit and default risks. It is a brutal business. Many of the early digital lending firms (like OnDeck, LendingClub, Prosper) have been on the "brink of death" multiple times.
Even if Affirm's business operates well, its stock is still down about 60% from historical highs—often due to the market using SaaS valuation logic, pricing its credit income while failing to adequately account for inevitable future credit losses.
DeFi lending is, in essence, a leveraged business.
It serves not "the cashless," but those who already have assets but wish to obtain liquidity without selling, resembling a margin account. There are not traditional credit decisions, the only criteria are the quality of the collateral.
This model offers high capital efficiency and scalability, generating extremely thin profit margins at great scales; but it also has clearly defined limits—useful only for those who are already on-chain, possess substantial assets, and wish to earn income or additional leverage without selling their assets.
Prediction Markets: No One Can Say for Sure?
Finally, let's turn to prediction markets.
This is the latest battlefield between Fintech and DeFi and the most peculiar one. For decades, they were merely "freaks" in the academic sense: economists love them, but regulators steered clear.
The Iowa Electronic Markets ran small-scale election predictions; Intrade had a brief period of prosperity before being shut down; many projects were directly categorized as gambling or sports betting.
"Trading outcomes of real-world events, and these markets can provide better predictions than polls or commentators"—this idea has long lingered at the theoretical level.
This all changed in 2024 and accelerated during Trump's second term: Polymarket processed over $1 billion in election bets; Kalshi won its legal battle with the CFTC and began introducing political contracts to US users; Robinhood, eager not to miss any trends, quickly launched event contracts; DraftKings already operated a kind of prediction market through daily fantasy sports, while sitting on the sidelines with a market cap of $15.7 billion and annual revenue of $5.5 billion.
Prediction markets have finally transitioned from marginal experiments to the forefront of finance and the crypto world.
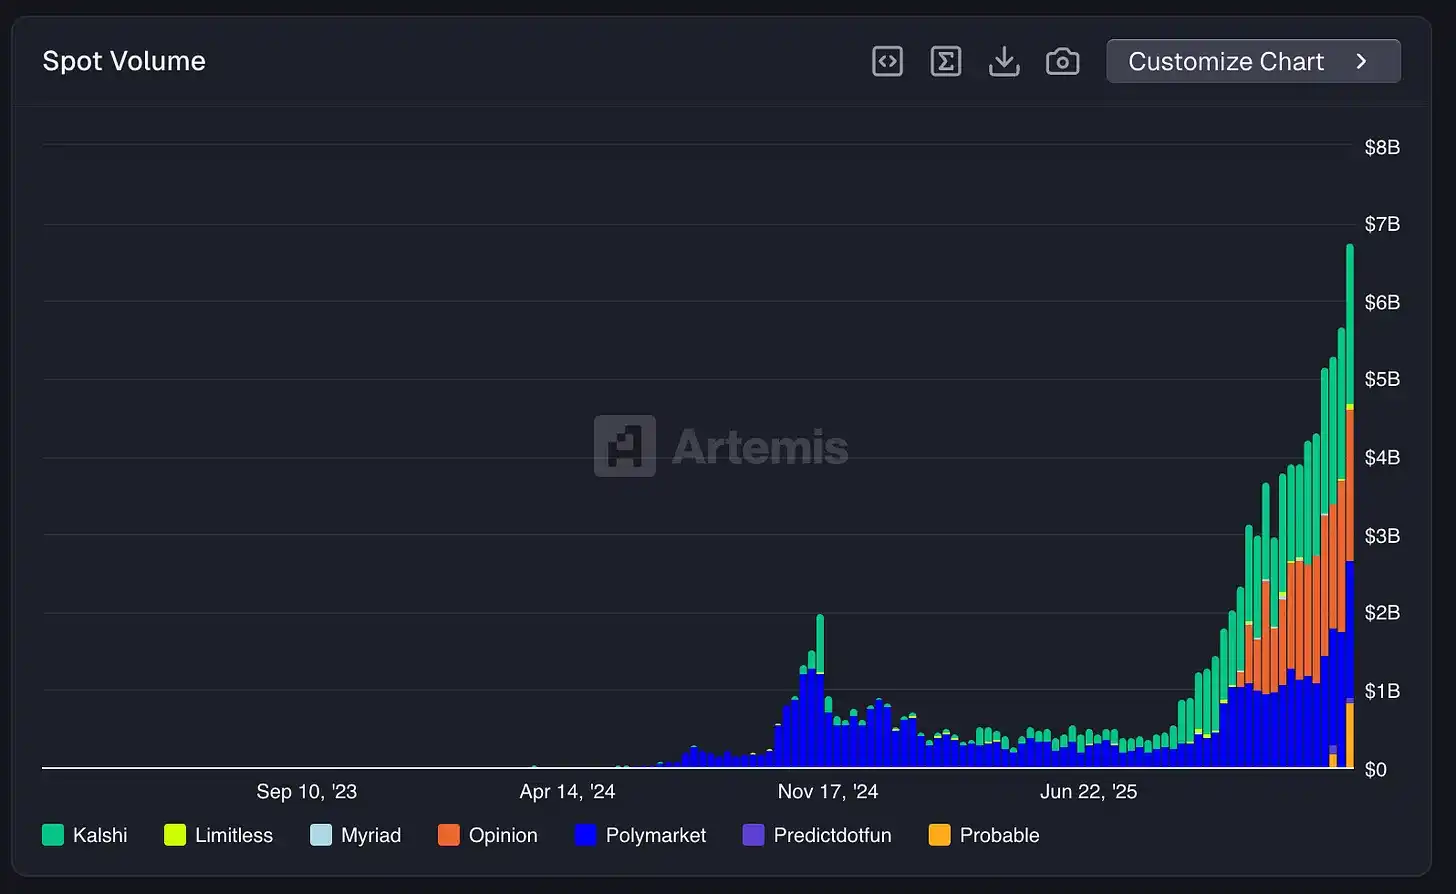
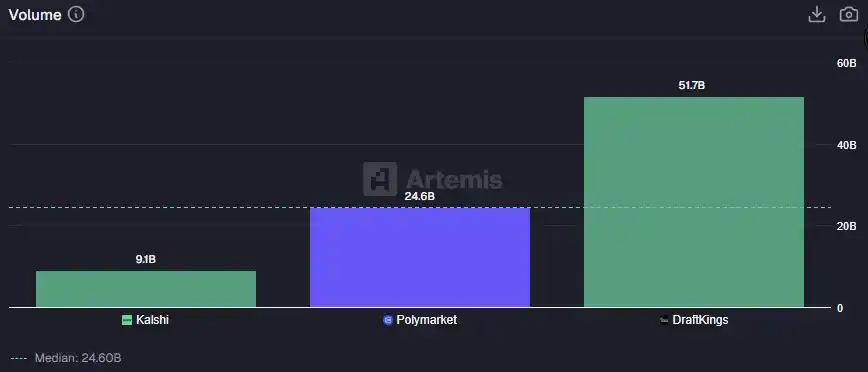
Spot trading volume data for Kalshi and Polymarket comes from Artemis; DraftKings' "trading volume" uses its Sportsbook Handle metric, which is the total amount of user bets settled in its sports betting products.
This sector has rapidly ascended from a niche experiment to the mainstream in about 18 months—weekly trading volumes for prediction markets have reached approximately $7 billion, setting new historical highs.
DraftKings had a trading volume of $51.7 billion in the last 12 months; Polymarket reached $24.6 billion, about half of DraftKings, while it remains a crypto-native protocol, theoretically not allowed for US users; Kalshi, as a compliant US-based alternative, had a trading volume of $9.1 billion.
From just the volume perspective, Polymarket already has considerable competitiveness. It has built a liquid prediction market on Polygon, covering globally, while Kalshi is still navigating the courts for compliance eligibility.
But when we turn to revenue, the comparison starts to tip.
DraftKings achieved $5.46 billion in revenue last year; Kalshi only $264 million; Polymarket, after activating taker fees for 15-minute crypto markets, realized about $38 million in annualized revenue run rate.
This again reveals a familiar division: in terms of "scale," DeFi has caught up; but in terms of "monetization capability," traditional finance and bookmakers still hold an overwhelming advantage.
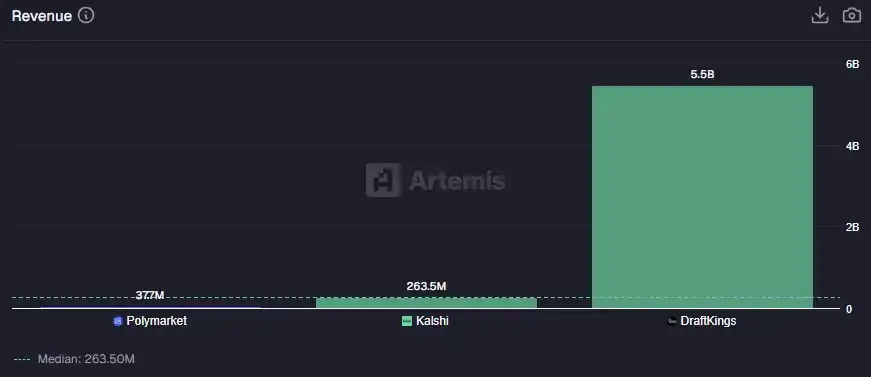
Revenue comparison of prediction markets. Polymarket's revenue data comes from Artemis; Kalshi’s revenue comes from public materials; DraftKings' LTM revenue comes from company financial reports.
The core of the gap lies in the take rate—often referred to as "hold" in sports betting contexts.
DraftKings: takes 10.57% on every dollar wagered. This is typical for sports betting models—setting prices, offering odds, and managing risk for substantial shares of profit.
Kalshi: extracts 2.91%, a level that’s lower and aligns more with its positioning as a financialized exchange model.
Polymarket: only 0.15%. With $24.6 billion in trading volume, the revenue being captured is quite limited.
The conclusion is straightforward: the divergence in prediction markets does not lie in "scale," but rather in "revenue structures."
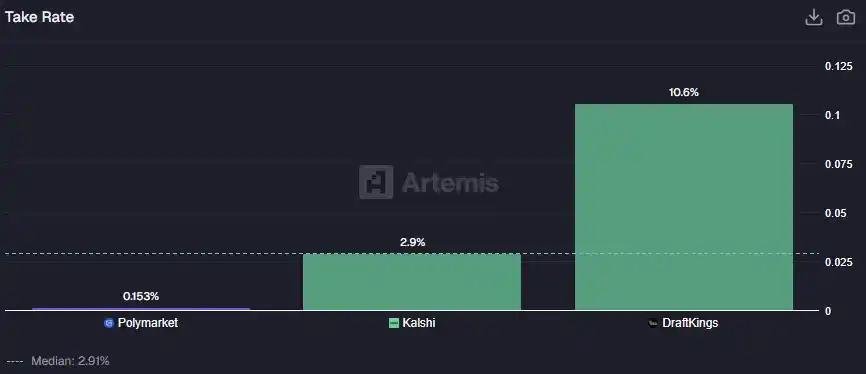
Take Rate = Last Twelve Months (LTM) revenue / trading volume.
This almost reenacts the logic of DEXs.
Polymarket does not focus on value capture but rather on providing infrastructure for prediction markets: matching buyers and sellers, and finalizing contracts on-chain. It does not hire odds makers, nor manages a balance sheet, nor stands on the opposite side of your bets. Efficiency is indeed remarkable, but monetization is not the current core objective.
However, investors clearly believe that Polymarket will eventually achieve monetization, as reflected by its valuation of about $9 billion, corresponding to a 240 times sales multiple (Sales Multiple);
Kalshi, with an estimated valuation of $11 billion and trading at $264 million in revenue, has about a 42 times multiple;
DraftKings has a sales multiple of only 2.9 times.
Venture capitalists are almost relentless in pouring money into these platforms, while at the same time, traditional players like DraftKings and Flutter Entertainment (which owns FanDuel) are seeing their stock prices continuously pressured.
This reinforces a familiar signal: capital is paying a premium for "potential future monetization," rather than trading current profits.
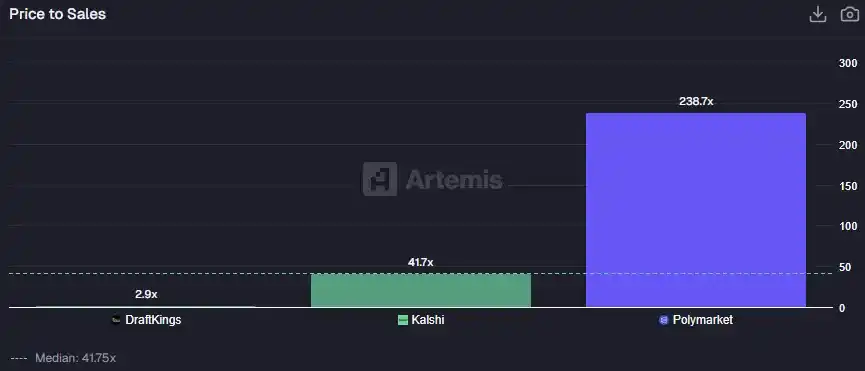
Kalshi and Polymarket's valuations are based on the latest round of private equity valuations; DraftKings' valuation comes from Yahoo Finance.
Polymarket's valuation implies one of two possibilities: either it will massively turn on monetization switches in the future, or it will evolve into something far greater than just "prediction markets." At over 200 times revenue multiples, what you are buying is not a mature business, but a call option on a new financial vernacular.
Perhaps Polymarket will become the default marketplace for hedging any real-world events; perhaps it will cover more sports, earnings reports, weather, or outcomes of various binary events; perhaps it will elevate its take rate from 0.15% to a higher level, and its revenue could suddenly leap to billions.
This is the purest form of the "convergence question": in the future, does it belong to regulated exchanges with clear take rates and compliance departments? Or to agreements where there is no need for licenses, where anyone can bet on anything anywhere, and "the house takes almost no cut"?
Convergence
A few years ago, we could not place DeFi and Fintech on the same table for direct comparison. But now, we are here.
The crypto world has built a financial infrastructure that can match Fintech in terms of trading volume, user scale, and asset size: the global reach of stablecoin channels exceeds that of traditional payment institutions; Aave's loan scale surpasses Klarna's; Polymarket's trading volume is comparable to DraftKings.
Technology is feasible, and products have found sufficiently large user bases. But the challenge lies in value capture.
In every category we examined, the conclusions are highly consistent: compared to traditional Fintech, the crypto system's take rates are lower, thus capturing less economic value.
What crypto builds is the most efficient and open infrastructure, at the cost of more broadly distributing value.
This is a bug or a feature, depending on your stance: if you believe that financial services will inevitably evolve into commoditized public utilities, then crypto has merely accelerated this unavoidable process; if you think companies must rely on revenue to survive, then most tokens face serious challenges in capturing value.
Regardless, convergence is already happening: banks are beginning pilot tokenized deposits; the New York Stock Exchange is researching tokenized stock trading; the total supply of stablecoins has hit a new high of over $30 billion.
Traditional Fintech giants have recognized the trend—they will not ignore it but will absorb it.
The questions for the next decade are actually quite simple: will crypto learn to repair toll booths, or will Fintech learn to walk the crypto route?
Our judgment is: both will happen.
免责声明:本文章仅代表作者个人观点,不代表本平台的立场和观点。本文章仅供信息分享,不构成对任何人的任何投资建议。用户与作者之间的任何争议,与本平台无关。如网页中刊载的文章或图片涉及侵权,请提供相关的权利证明和身份证明发送邮件到support@aicoin.com,本平台相关工作人员将会进行核查。


