Original Title: Bears In Control
Original Authors: Chris Beamish, CryptoVizArt, Antoine Colpaert, Glassnode
Original Translation: AididiaoJP, Foresight News
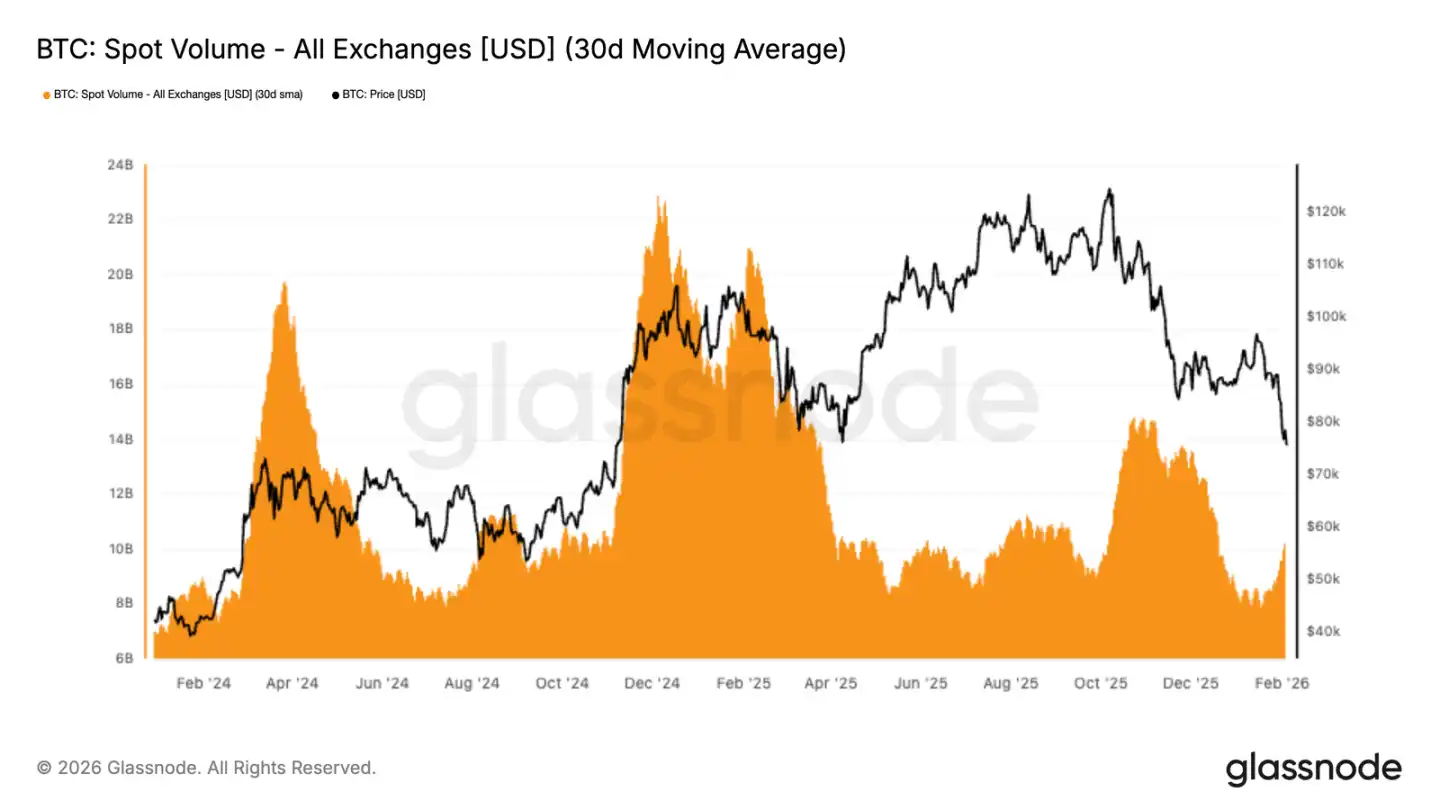
Bitcoin's spot trading volume remains sluggish. Despite the price dropping from $98,000 to $72,000, the 30-day average trading volume is still weak. This reflects insufficient market demand, with selling pressure not being effectively absorbed.
Core Points
· Bitcoin has confirmed a breakdown, with the price falling below the real market average, and market sentiment has turned cautious and defensive.
· On-chain data shows initial signs of accumulation in the $70,000 to $80,000 range, while a dense cost area has formed between $66,900 and $70,600, which may serve as a buffer against short-term selling pressure.
· The phenomenon of investors selling at a loss has intensified, as more holders are forced to stop-loss as prices continue to decline.
· The ongoing weakness in spot trading volume further indicates a lack of market absorption capacity, with selling pressure lacking effective digestion.
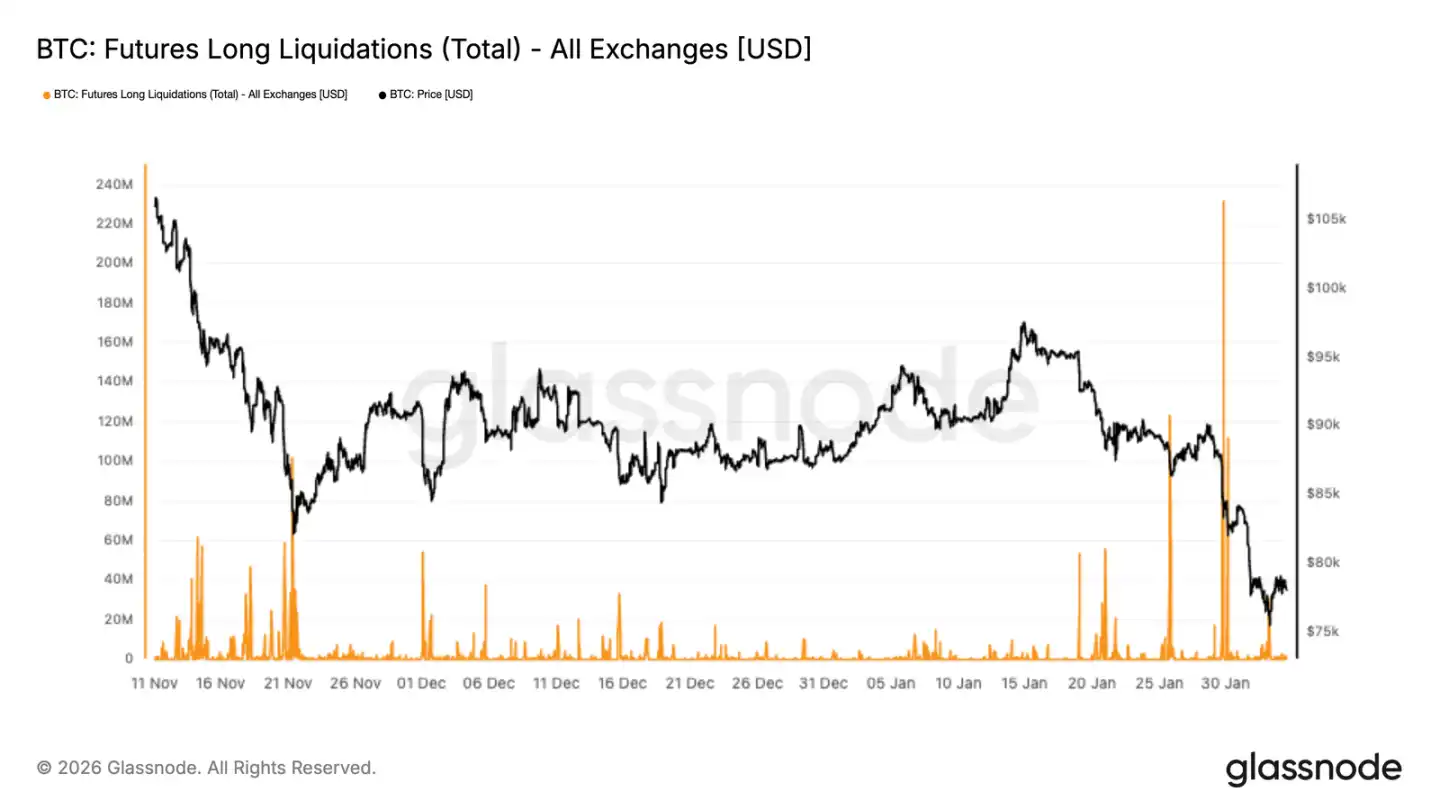
· The futures market has entered a phase of forced deleveraging, with large-scale long liquidations exacerbating market volatility and downward pressure.
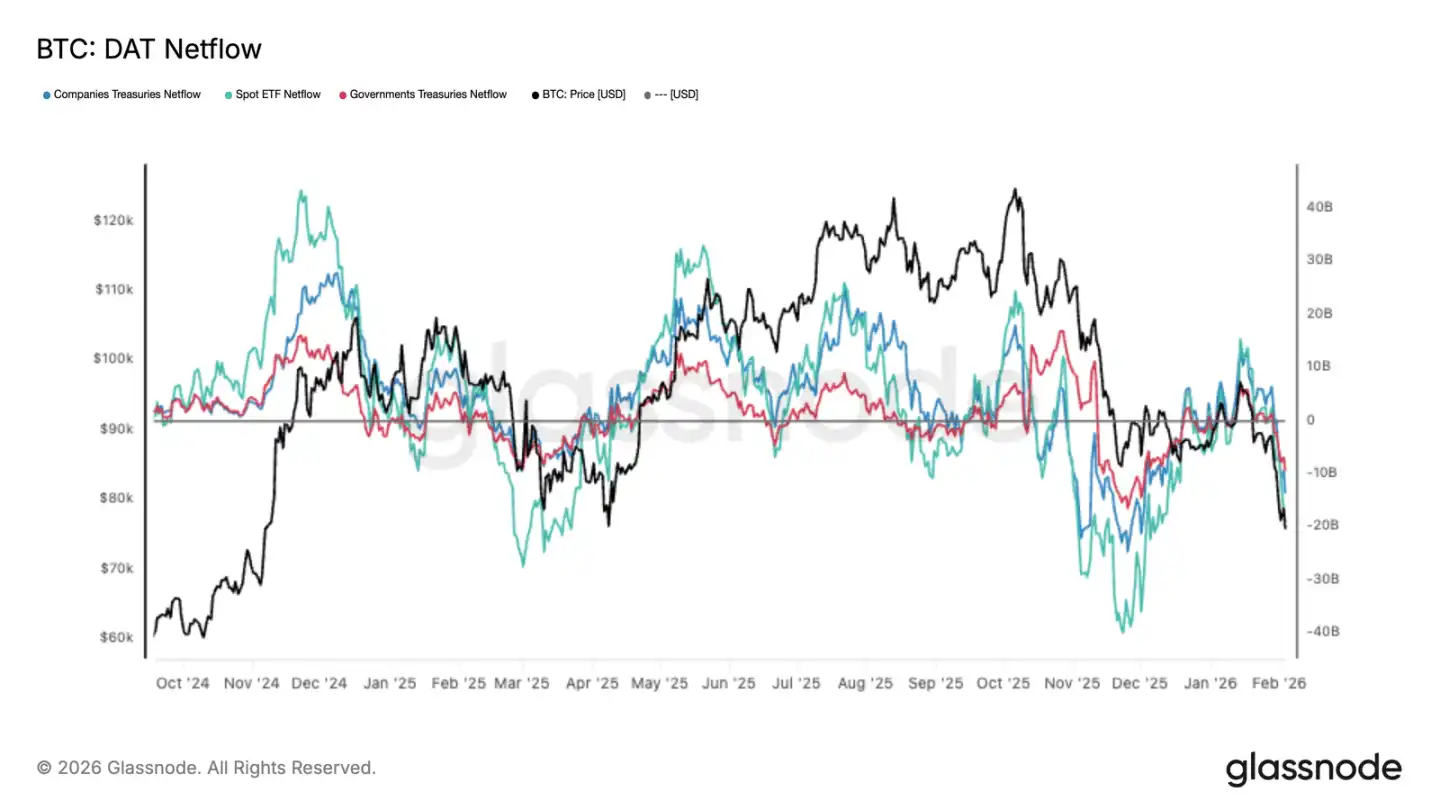
· Institutional capital inflows have significantly weakened, with net inflows into ETFs and related funds shrinking, failing to provide sustained buying support as seen in earlier bullish phases.
· The options market continues to reflect high expectations of downside risk, with implied volatility remaining elevated, and rising demand for put options indicating strong risk-averse sentiment.
· With market leverage being cleared and spot demand still weak, prices remain fragile, and any rebound may only be a technical correction rather than a trend reversal.
On-Chain Data Observation
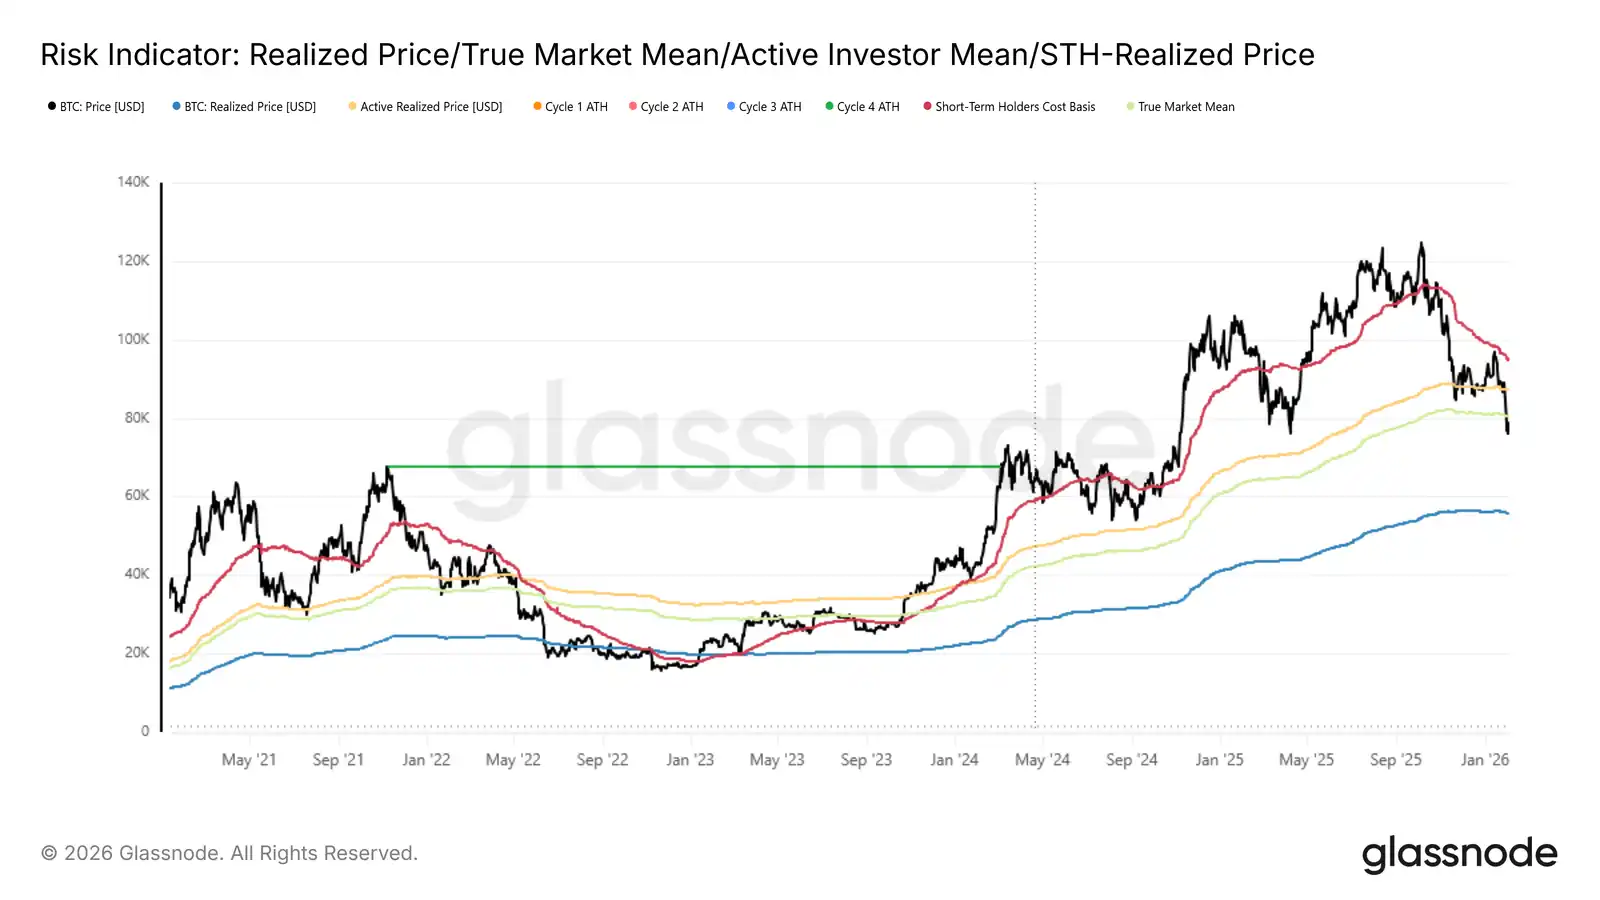
Following last week's analysis indicating that the market faced downside risks after failing to recover the short-term cost of $94,500, the price has now clearly fallen below the real market average.
Breaking Key Support
The real market average (the average cost of actively circulating holdings excluding long-term dormant tokens) has repeatedly served as a key support line during this adjustment.
The loss of this support confirms the deterioration of market structure since late November, with the current pattern resembling the transition from consolidation to deep adjustment seen in early 2022. Weak demand combined with ongoing selling pressure indicates that the market is in a fragile balance state.
In the medium term, the price volatility range is gradually narrowing. The upper resistance is near the real market average around $80,200, while the lower support is around the realized price of $55,800, a level that historically attracts long-term capital.
Potential Demand Area Analysis
As the market structure resets, attention turns to potential positions for stabilization on the downside. The following on-chain indicators help identify areas that may form a temporary bottom:
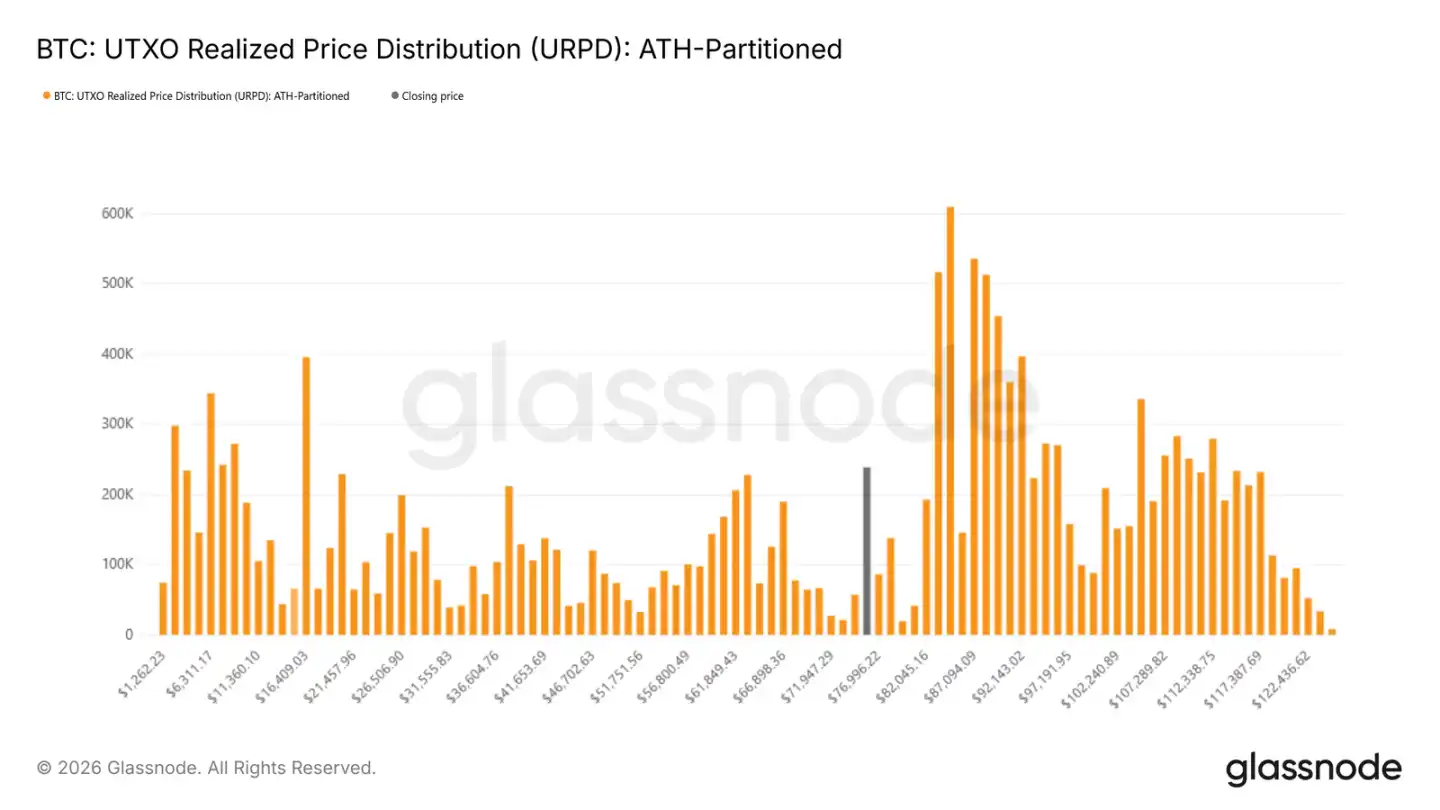
The UTXO realized price distribution shows significant accumulation by new investors in the $70,000 to $80,000 range, indicating that there is capital willing to buy on dips in this area. Below this, there is a dense holding area between $66,900 and $70,600, which historically has often become a short-term support zone.
Market Pressure Indicators
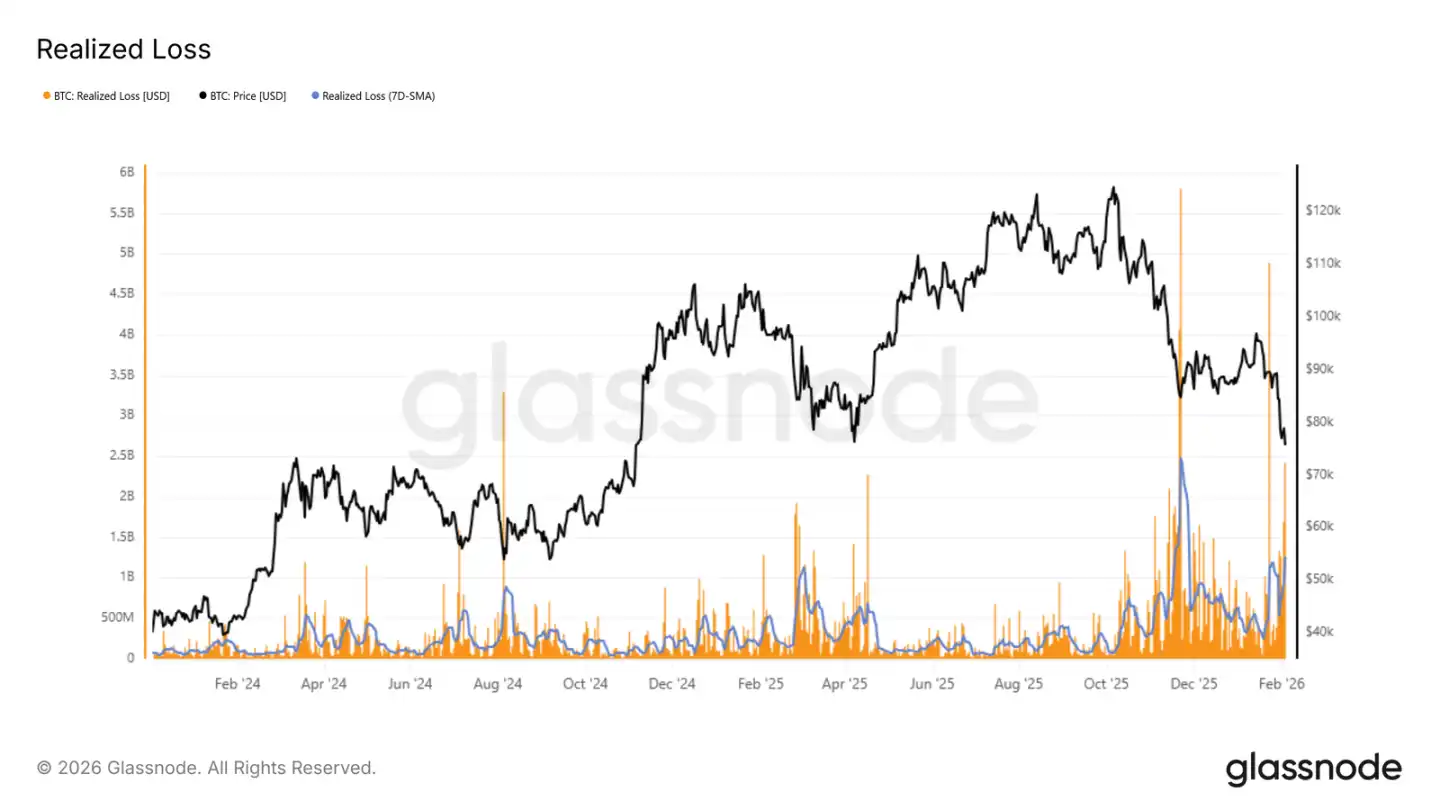
The realized loss indicator directly reflects the level of pressure on investors. Currently, the 7-day average realized loss has exceeded $1.26 billion per day, indicating that panic selling has increased after the market fell below key support.
Historical experience shows that peaks in realized losses often occur during the exhaustion phase of a sell-off. For example, during the recent rebound from $72,000, daily losses briefly exceeded $2.4 billion, and such extreme values often correspond to short-term turning points.
Comparison with Historical Cycles
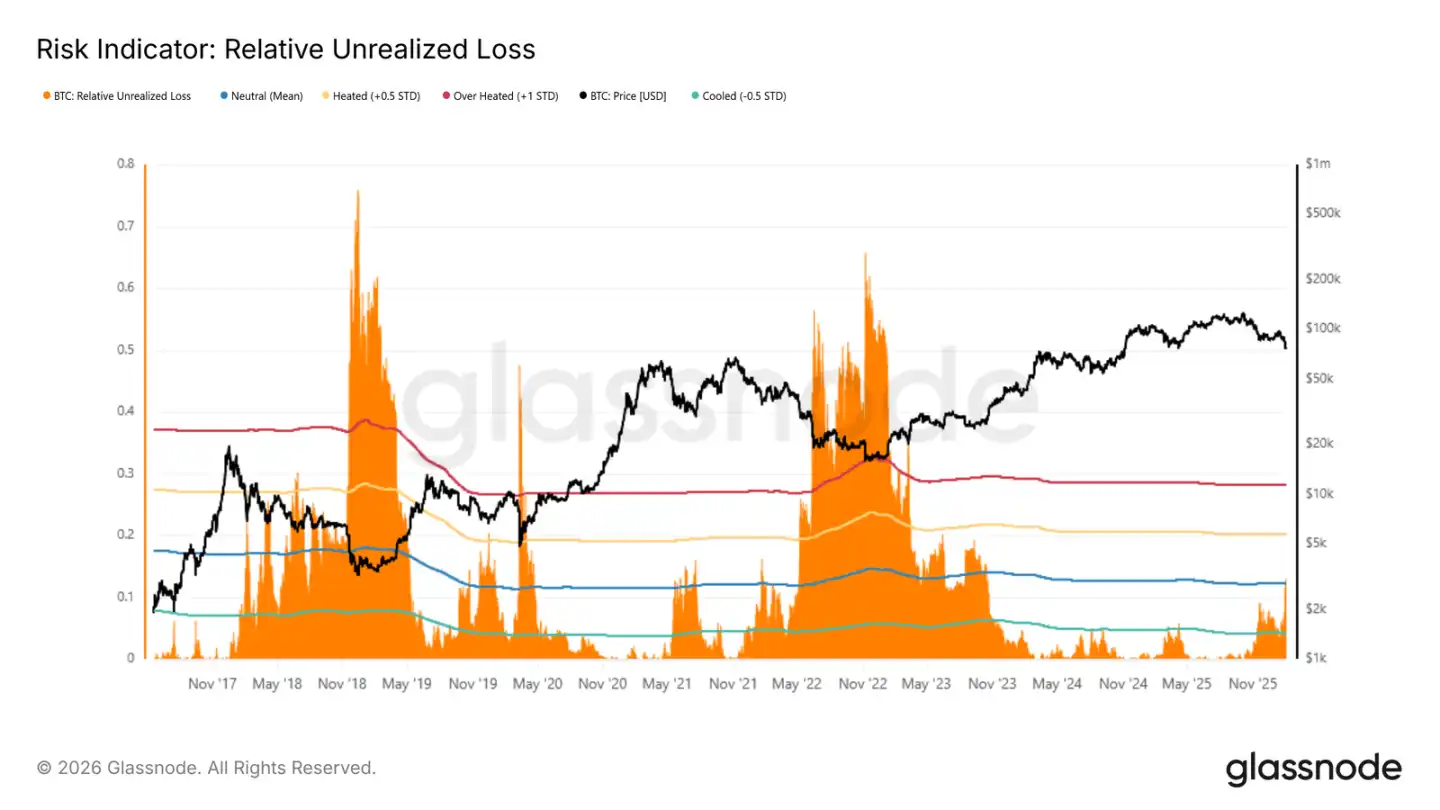
The relative unrealized loss indicator (the proportion of unrealized losses to total market capitalization) helps to compare market pressure across different cycles. Historical extreme values in bear markets typically exceed 30%, with the bottoms of the 2018 and 2022 cycles even reaching 65%-75%.
Currently, this indicator has risen above the long-term average (around 12%), indicating that investors with holding costs above the current price are under pressure. However, reaching historical extreme levels usually requires systemic risk events similar to the LUNA or FTX collapses.
Market Dynamics
Spot and futures trading volumes remain low, with the options market continuing to focus on downside protection.
Institutional Capital Turns to Net Outflow
As prices decline, the demand from major institutional investors has significantly weakened. Inflows into spot ETFs have slowed, and related capital from corporations and governments is also decreasing, indicating a declining willingness for new capital to enter.
This contrasts sharply with the previous bullish phase, where sustained capital inflows supported price increases. The current shift in capital flow further confirms the market's lack of new capital at current price levels.
Spot Trading Volume Remains Light
Despite the price dropping from $98,000 to $72,000, the 30-day average trading volume has not effectively increased. This indicates a lack of sufficient buying support during the decline.
Historically, true trend reversals are often accompanied by a significant increase in spot trading volume. The current volume has only slightly rebounded, indicating that market activity is still primarily focused on reducing positions and hedging rather than actively accumulating.
Insufficient liquidity makes the market more sensitive to selling pressure, with even moderate-sized sell-offs potentially triggering significant declines.
Futures Market Forced Liquidation
The derivatives market has seen large-scale long liquidations, setting a new record for this round of declines. This indicates that as prices fall, leveraged long positions are being forcibly cleared, exacerbating downward momentum.
Notably, liquidation activity was relatively mild during November-December, indicating that leverage was gradually being rebuilt. The recent surge marks the market's entry into a forced deleveraging phase, with forced liquidations becoming a major factor affecting prices.
Whether prices can stabilize going forward depends on the adequacy of the deleveraging process. A true recovery requires the intervention of spot buying; merely clearing positions is insufficient to create a sustained rebound.
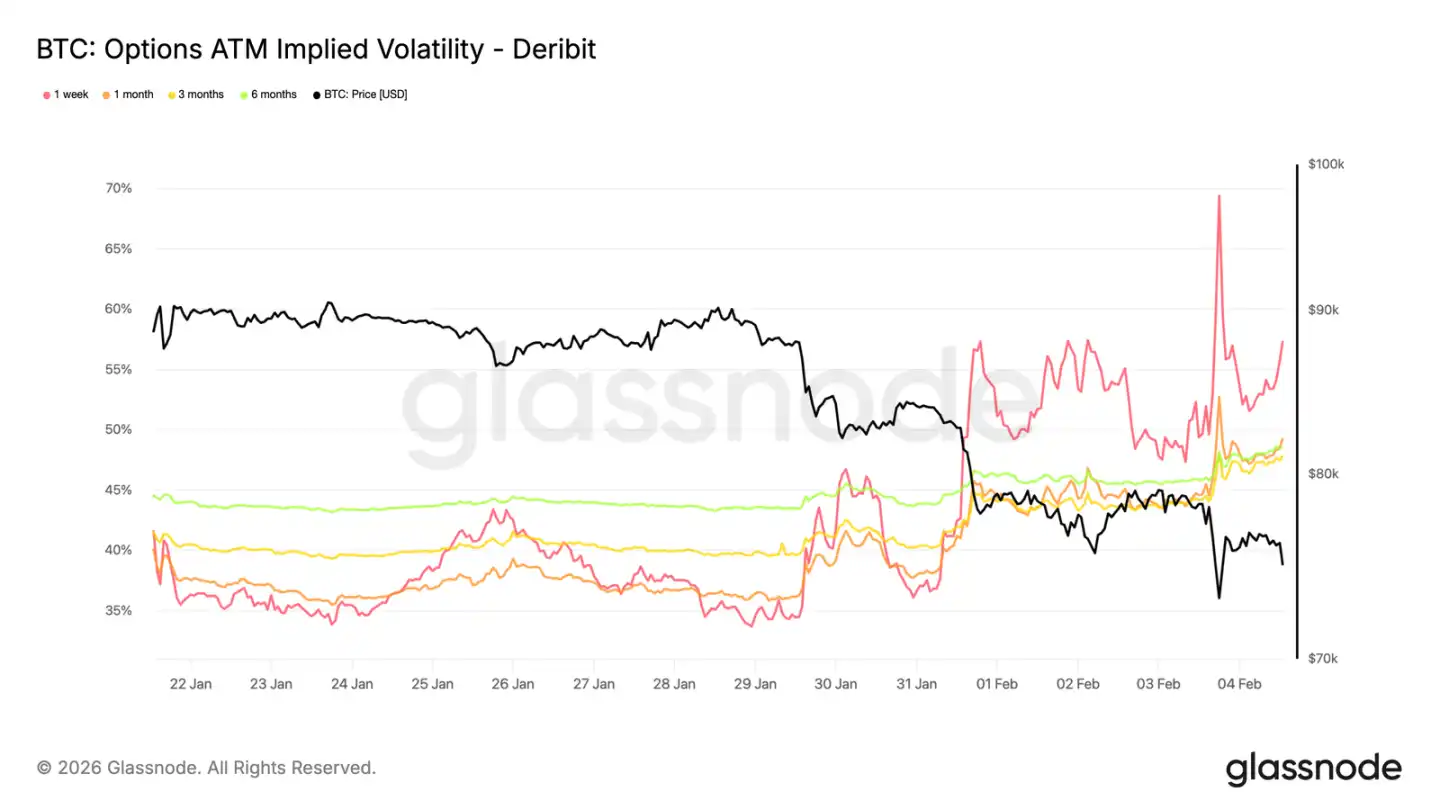
Short-Term Volatility Remains High
As prices test the previous high of $73,000 (now turned support), short-term implied volatility has risen to around 70%. The volatility level over the past week has increased by about 20 volatility points compared to two weeks ago, with the entire volatility curve shifting upward.
Short-term implied volatility remains above recent actual volatility, indicating that investors are willing to pay a premium for short-term protection. This repricing is particularly evident in recent contracts, reflecting concentrated risk.
This more reflects a demand for protection against sudden declines rather than a clear directional judgment. Traders are reluctant to sell large amounts of short-term options, keeping the cost of downside protection elevated.
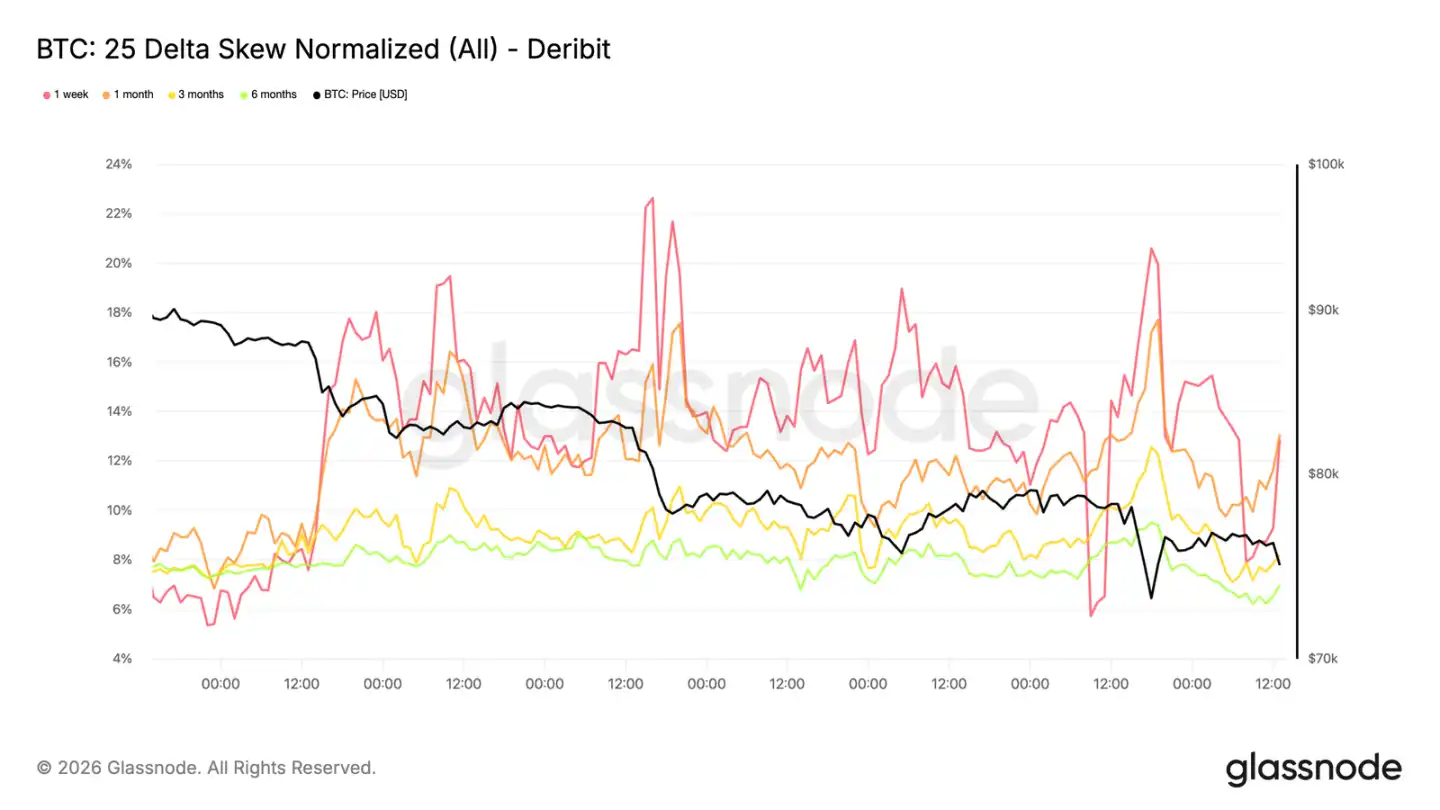
Demand for Put Options Continues to Increase
The repricing of volatility shows a clear directional characteristic. The skew of put options relative to call options has widened again, indicating that the market is more focused on downside risks rather than rebound opportunities.
Even if prices remain above $73,000, the flow of options capital is still concentrated on protective positions, causing the implied volatility distribution to skew negatively, reinforcing the market's defensive tone.
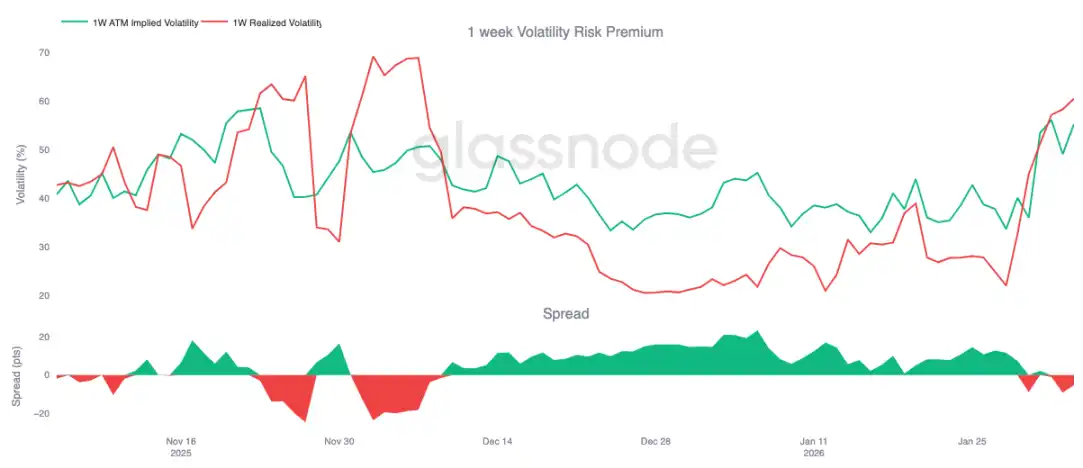
Volatility Risk Premium Turns Negative
The 1-week volatility risk premium has turned negative for the first time since early December, currently around -5, whereas a month ago it was around +23.
A negative risk premium means that implied volatility is lower than actual volatility. For option sellers, this means that the benefits of time decay turn into losses, forcing them to engage in more frequent hedging operations, which in turn increases short-term market pressure.
In this environment, options trading no longer stabilizes the market but may instead exacerbate price volatility.
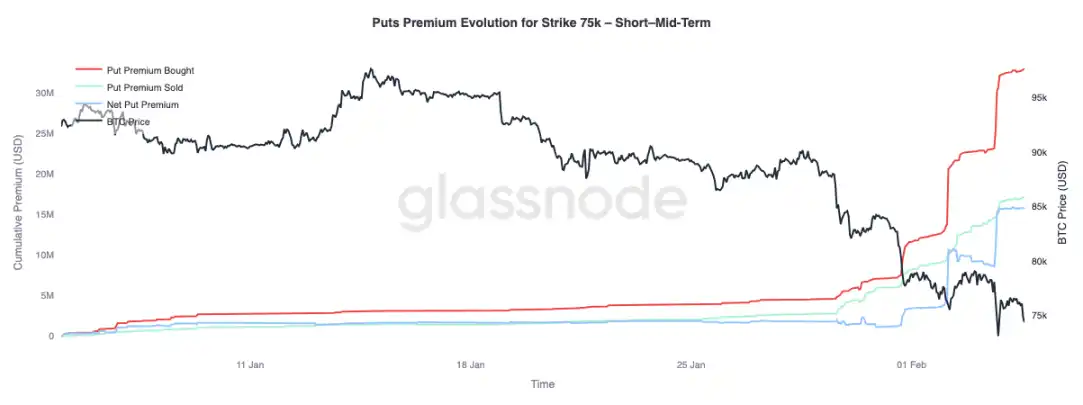
Changes in $75,000 Put Option Premium
The $75,000 strike put option has become a focal point for the market, with this level being tested repeatedly. The net buying premium for put options has significantly increased, progressing in three phases, each time synchronized with price declines and a lack of effective rebounds.
In longer-dated options (over 3 months), the situation is different: selling premiums have begun to exceed buying premiums, indicating that traders are willing to sell high volatility in forward contracts while continuing to pay premiums for short-term protection.
Summary
After failing to recover the key level of $94,500, Bitcoin has fallen below the real market average of $80,200, entering a defensive state. As prices drop to the $70,000 range, unrealized profits shrink, and realized losses increase. Although there are initial signs of accumulation in the $70,000-$80,000 range and a dense holding area forming between $66,900-$70,600, ongoing loss selling indicates that market sentiment remains cautious.
In the derivatives market, selling pressure shows disordered characteristics, and large-scale long liquidations confirm the process of leverage reset. While this helps to clear speculative bubbles, it is insufficient to form a solid bottom. The options market reflects increasing uncertainty, with rising demand for put options and high volatility indicating that investors are preparing for continued fluctuations.
The key to future trends still lies in spot demand. If we do not see an increase in spot participation and sustained capital inflows, the market will continue to face downward pressure, and any rebound may lack sustainability. Before fundamental improvements occur, risks remain skewed to the downside, and a true recovery requires time, sufficient turnover of positions, and a substantial restoration of buyer confidence.
免责声明:本文章仅代表作者个人观点,不代表本平台的立场和观点。本文章仅供信息分享,不构成对任何人的任何投资建议。用户与作者之间的任何争议,与本平台无关。如网页中刊载的文章或图片涉及侵权,请提供相关的权利证明和身份证明发送邮件到support@aicoin.com,本平台相关工作人员将会进行核查。


