The price of Bitcoin plummeted to around $78,000 yesterday, and as panic spread in the market, two closely watched long-term indicators simultaneously issued rare signals—Bitcoin may be in a historically undervalued range.
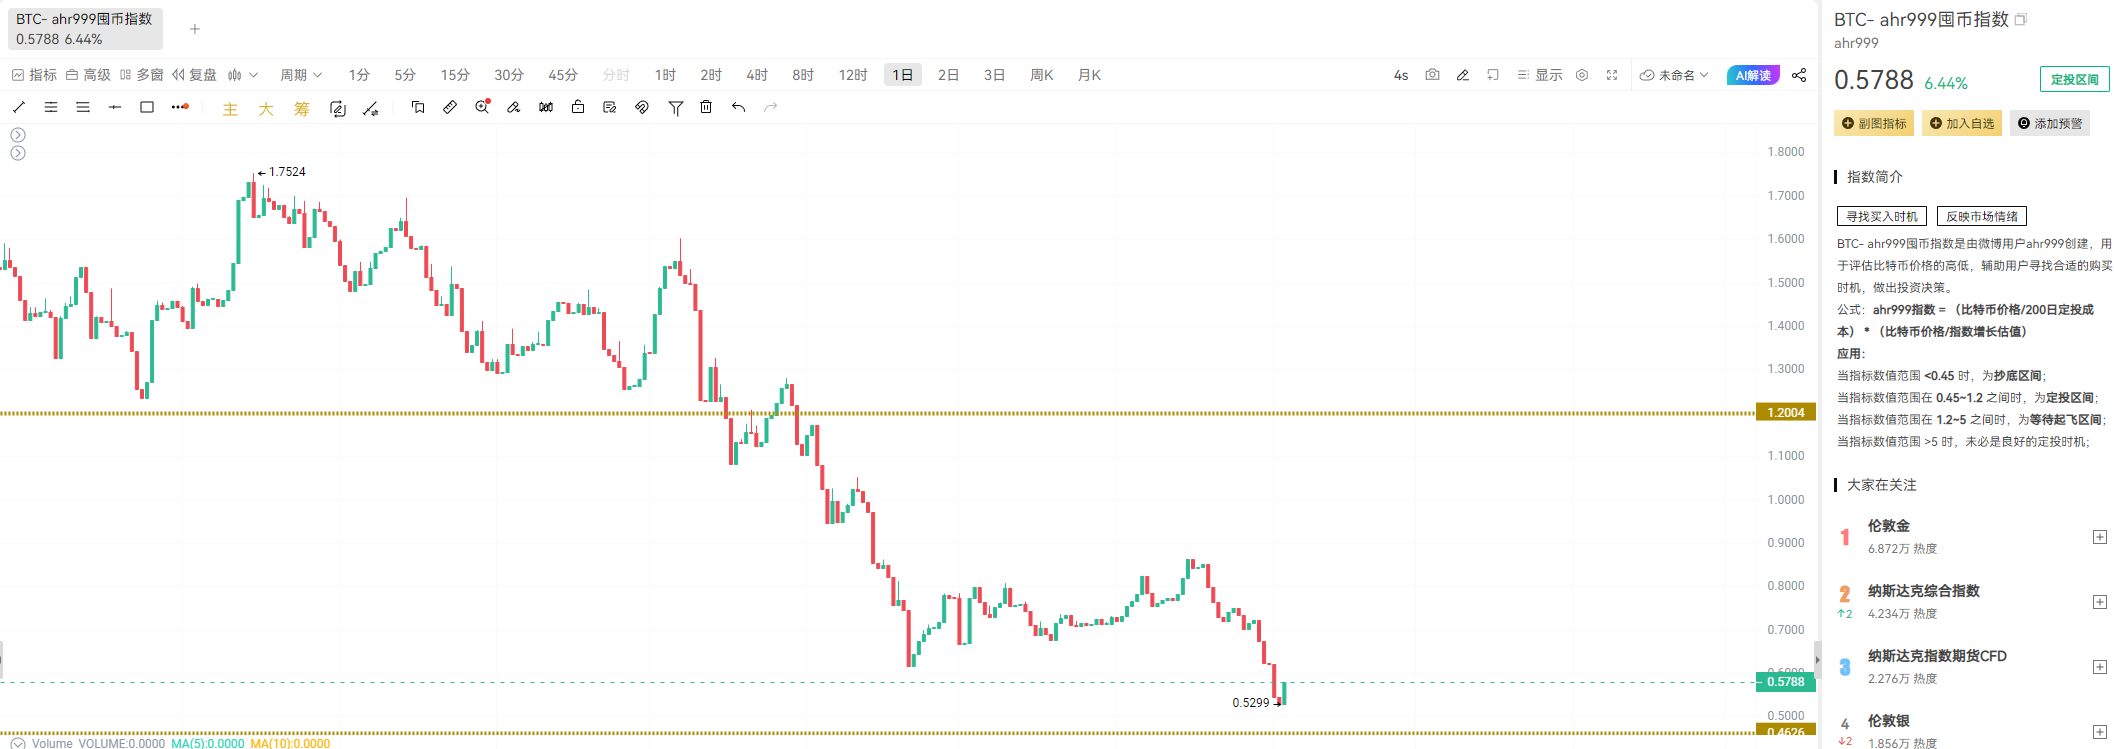
On February 1, 2026, the Bitcoin Ahr999 indicator fell below the "buying line" of 0.5, marking the first time it has done so in 839 days since October 2023.
At the same time, the Bitcoin rainbow chart also entered the "fire sale" zone, and this combination of signals historically indicates the emergence of long-term investment opportunities.

1. Key Indicator Movements
The market is undergoing a rapid adjustment. The sharp drop on February 1 caused Bitcoin to briefly fall below $75,000, reaching its lowest level since April 2025.
● The total market capitalization evaporated by about $500 billion in just five days, with Bitcoin slipping to 13th place in the global asset market capitalization rankings. The Fear and Greed Index dropped to 14 points, indicating that market sentiment has entered the "extreme fear" zone.
● The Ahr999 indicator fell to around 0.5 on February 1, marking the first time it has dropped below the critical level of 0.5 since October 16, 2023.
● This indicator is calculated by dividing the Bitcoin price by the 200-day dollar-cost averaging and then multiplying it by the Bitcoin price divided by the index growth valuation. Historically, this indicator being below 0.45 is often seen as an excellent buying opportunity.
2. Rainbow Chart Synchronization Signal
● Almost simultaneously, the Bitcoin rainbow chart also entered the blue "fire sale" zone, representing extreme undervaluation. This long-term logarithmic valuation tool displays Bitcoin's price movements over the years through colored bands, with each color representing different phases in the market cycle.
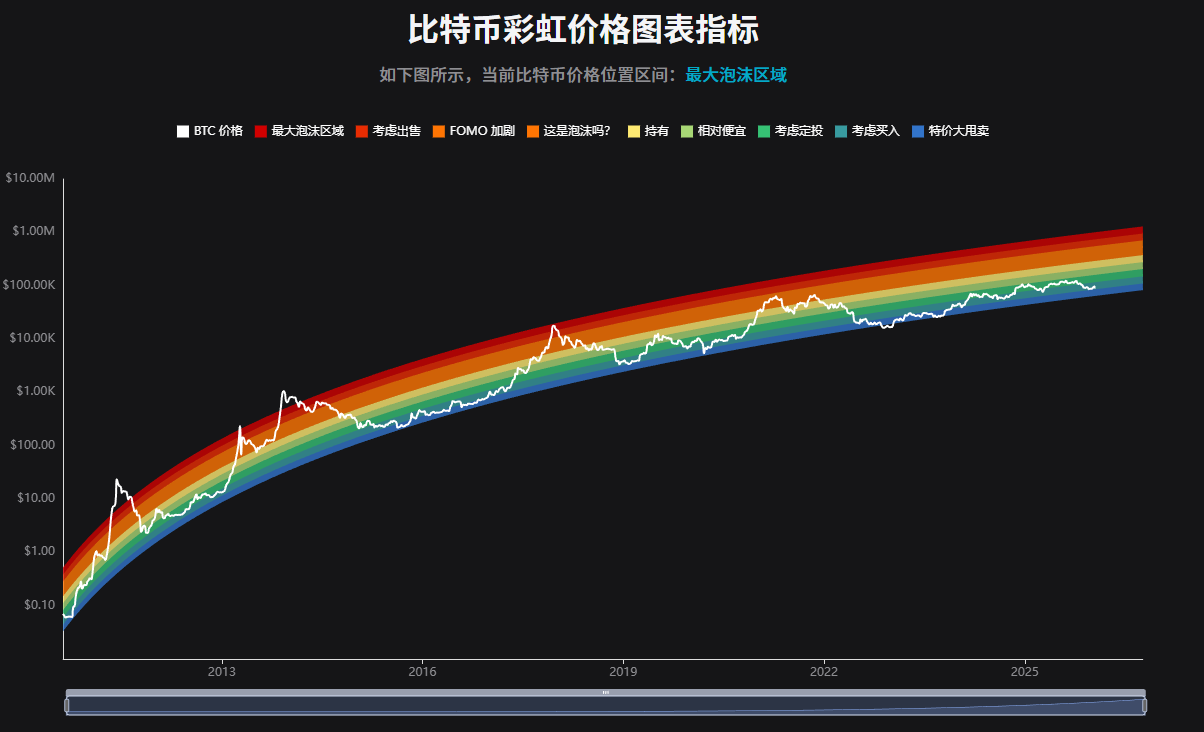
● The deep blue area on the rainbow chart is referred to as the "fire sale," indicating that the price has fallen into an extremely undervalued range, typically providing rare buying opportunities for long-term investors.
● The current Bitcoin price has fallen below the 100-week moving average of approximately $85,000, and traders are closely monitoring the next key support level at $75,000.
3. Market Sell-off Pressure Analysis
● Multiple factors are behind this market decline. Ki Young Ju, CEO of crypto analytics firm CryptoQuant, pointed out that the continuous decline in Bitcoin is mainly due to persistent selling pressure and a lack of new capital inflows.
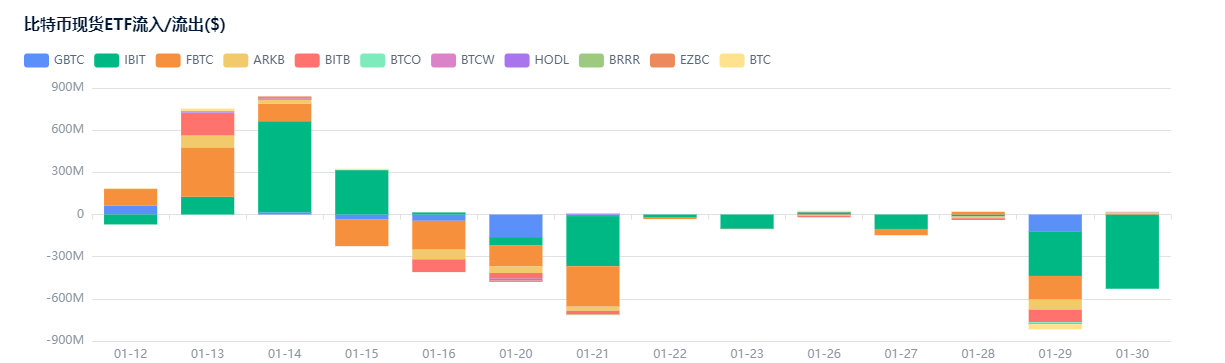
● Data shows that the Bitcoin ETF sector is experiencing negative growth. On a monthly basis, spot Bitcoin ETFs have recorded capital outflows three times. From November 2025 to January 2026, capital outflows approached $6.2 billion.
● Early Bitcoin holders have realized significant unrealized profits due to aggressive buying from companies like ETFs and Strategy, and they have started to take profits since early last year. QCP Capital believes that Bitcoin's drop below $80,000 is related to the confirmation of the new Federal Reserve Chairman Kevin Walsh, which triggered a new wave of liquidations.
4. Divergence in Institutional Views
In light of the current market conditions, there are significant divergences in the views of various institutional analysts.
● Standard Chartered has significantly lowered its Bitcoin forecast, reducing its 2026 target from $300,000 to $150,000. Geoff Kendrick, the bank's global head of digital asset research, stated that corporate-level Bitcoin purchases "have come to an end," and future increases will mainly rely on ETF capital inflows.
● In contrast to Standard Chartered's cautious stance, Citi Research has a central forecast for Bitcoin in 2026 aimed at $143,000. Analysts noted that ETF-driven demand is seen as structural rather than cyclical tailwinds.
● Galaxy research head Alex Thorn described 2026 as "too chaotic to predict," but he remains confident that Bitcoin will reach $250,000 by 2027.
● Bernstein takes a middle-ground position, believing that the crypto market is still in a short-term bear cycle but expects a reversal within 2026 (or the first half). Analysts predict that Bitcoin prices may bottom out in the $60,000 range near the previous cycle's peak and gradually establish a higher price center.
5. On-chain Data Interpretation
On-chain data provides a unique perspective for understanding the current market. Glassnode analysts pointed out that as Bitcoin's price fell to $78,600, key on-chain pricing models showed:
● The cost basis for short-term holders is $95,400, the average cost for active investors is $87,300, the real market average price is $80,500, and the realized price is $55,900.
● Meanwhile, Bitcoin whales are actively increasing their holdings. Bitfinex data shows that despite the unfavorable market environment, the number of addresses holding large amounts of Bitcoin continues to grow.
● Notably, a dormant wallet from the "Satoshi era" that had been inactive for 13 years transferred 10,000 Bitcoins. Investor Mr. Crypto Whale pointed out that early whales starting to sell is rarely coincidental and is usually a strategic move.
6. Operational Strategy Recommendations
In light of the dual indicator signals, investors should adopt a cautious strategy. Analysts remind that while the area near the 0.45 buying line is historically a good entry point, it does not mean that a rapid price increase will occur in the short term.
● In extreme market conditions, indicators still have room to drop, as historical lows have reached 0.24-0.28. It is currently more suitable to "start dollar-cost averaging" rather than going all-in to catch the bottom.
● Although the rainbow chart indicates that the current price is in the "fire sale" zone, if Bitcoin truly enters a bear market, there is still a high probability of reaching the bottom of the blue zone, and dropping below or approaching $70,000 may not be too far off.
● QCP Capital pointed out that the next few trading sessions may be crucial for determining the market direction in the second quarter of 2026. Analysts believe that if the price continues to close below $74,000, the risk of a deeper decline will increase; conversely, a decisive breakthrough above $80,000 could provide short-term relief and reduce volatility.
As Bitcoin hovers near key support levels, the behavior of large and small investors has shown a clear divergence: on-chain data indicates that whale addresses are still accumulating, while retail investors continue to sell.
Market attention is focused on the upcoming key options expiration date, with approximately $23 billion in Bitcoin options set to expire at the end of February, which could serve as a catalyst for market direction.
Matrixport analysis suggests that Bitcoin may need a new or updated narrative to form a lasting bottom and re-attract the interest of traditional financial institutions. Historically, Bitcoin has reshaped its narrative multiple times, and the current calm is likely cyclical rather than structural.
Join our community to discuss and grow stronger together!
Official Telegram community: https://t.me/aicoincn
AiCoin Chinese Twitter: https://x.com/AiCoinzh
OKX benefits group: https://aicoin.com/link/chat?cid=l61eM4owQ
Binance benefits group: https://aicoin.com/link/chat?cid=ynr7d1P6Z
免责声明:本文章仅代表作者个人观点,不代表本平台的立场和观点。本文章仅供信息分享,不构成对任何人的任何投资建议。用户与作者之间的任何争议,与本平台无关。如网页中刊载的文章或图片涉及侵权,请提供相关的权利证明和身份证明发送邮件到support@aicoin.com,本平台相关工作人员将会进行核查。


