Written by: Maher, Foresight News
Wintermute stated last week that $85,000 is a key point for BTC and will choose a direction soon; unfortunately, that direction is not upward but significantly downward.
On February 2, BTC briefly dipped to $75,700, ETH fell to $2,220, and various altcoins remained in a downward trend. In terms of liquidation data, according to Coinglass, $435 million was liquidated in the past 12 hours, with $324 million in long positions liquidated.
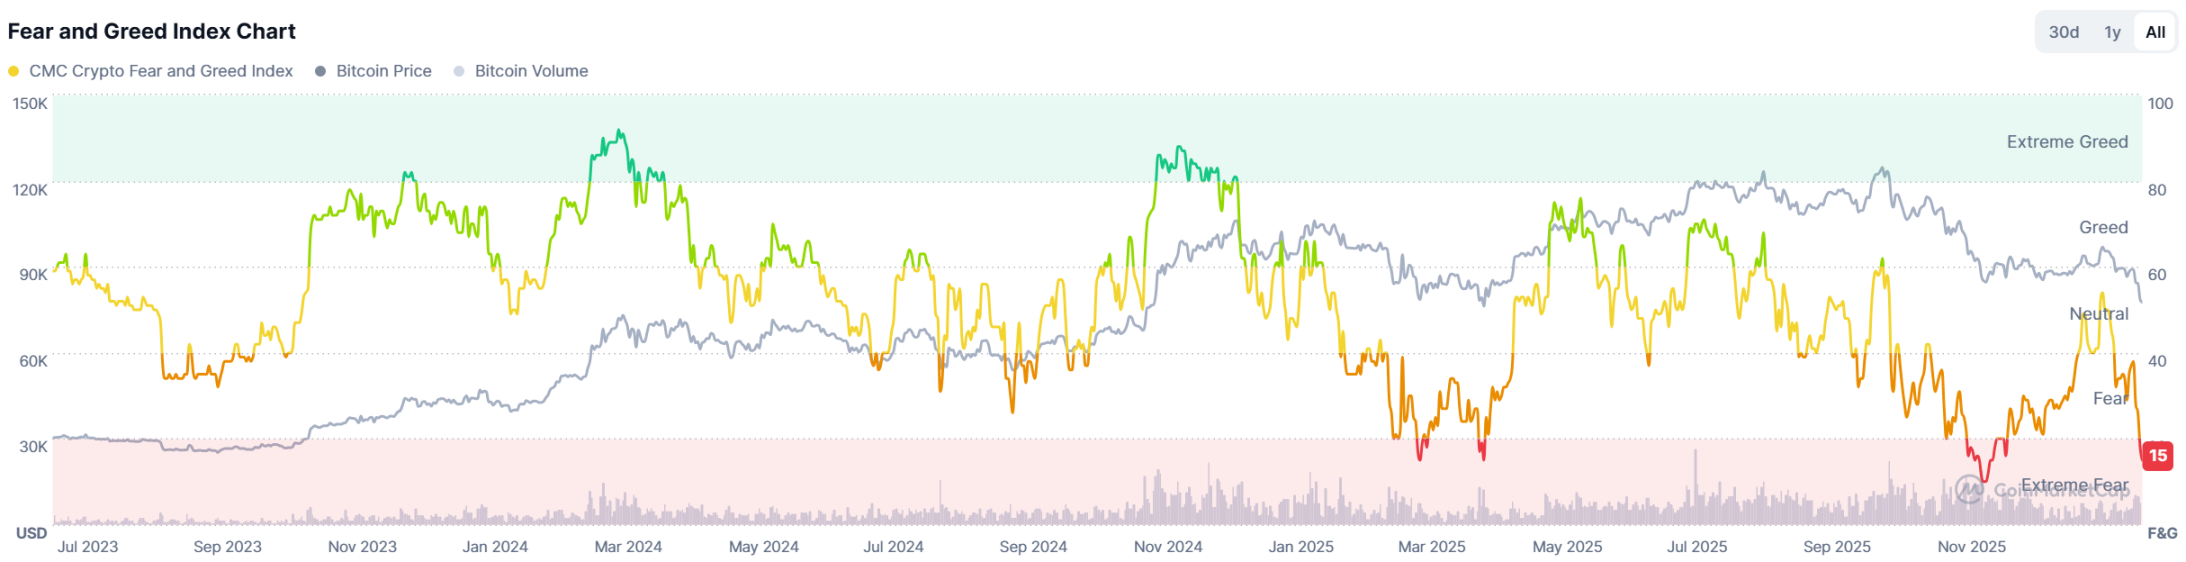
The market fear index is at 15, and market sentiment has once again plunged into extreme fear.
After the market turned bearish, where exactly is the bottom range for BTC? Five major data indicators reveal the answer.
Data Survey: 30% of Users Believe BTC's Bottom Range is Between $60,000 and $75,000
On January 30, Foresight News conducted a market confidence survey among investors. On that day, the market survey indicated that BTC was priced at $84,000, which subsequently fell sharply over the following days; therefore, the results of this data survey are for reference only.
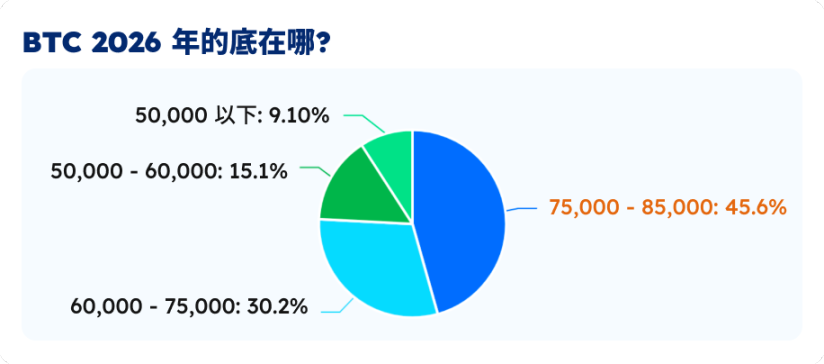
The voting survey showed (1,189 participants) that the majority of respondents (45.6%) believe that BTC's bottom price in 2026 will be between $75,000 and $85,000. Another 30.2% of respondents believe the bottom price will be between $60,000 and $75,000.
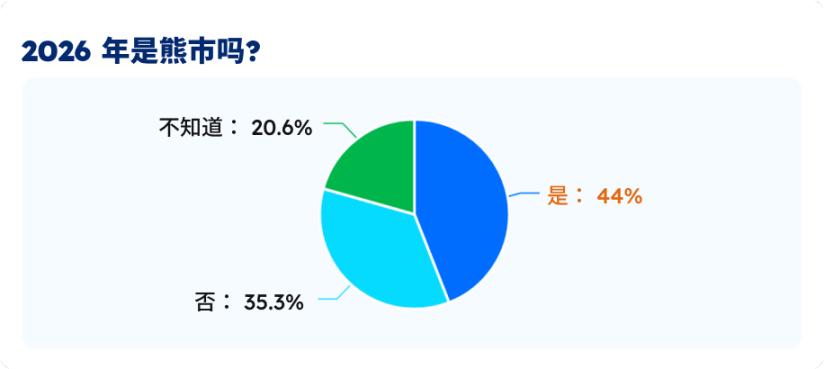
44% of respondents believe that 2026 will be a bear market, while 35.3% disagree, believing it will not be a bear market. Another 20.6% of respondents expressed uncertainty.
Nearly half of the respondents (47.2%) chose to dollar-cost average and hold Bitcoin long-term. Another 25% of respondents chose to liquidate their positions and switch to stablecoin investments or wait and see the market. 17.5% of respondents are looking for altcoins for value investment.

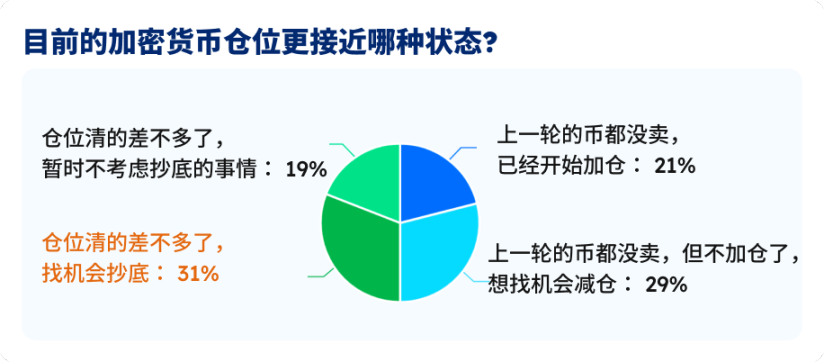
Currently, among the surveyed users, 31% indicated that they have mostly cleared their positions but are still looking for opportunities to buy the dip. 29% stated that they did not sell their coins in the last round but are temporarily not increasing their positions, wanting to find opportunities to reduce their holdings. 21% of respondents indicated that they did not sell their coins in the last round and have already started to increase their positions.
Glassnode Shows BTC On-Chain Cost at $55,900
Bitcoin has fallen below $78,000, and Glassnode updated the key price distribution for Bitcoin on-chain as follows: the cost basis for short-term holders (STH), reflecting the average holding price of new buyers/traders in recent months, is $95,400.
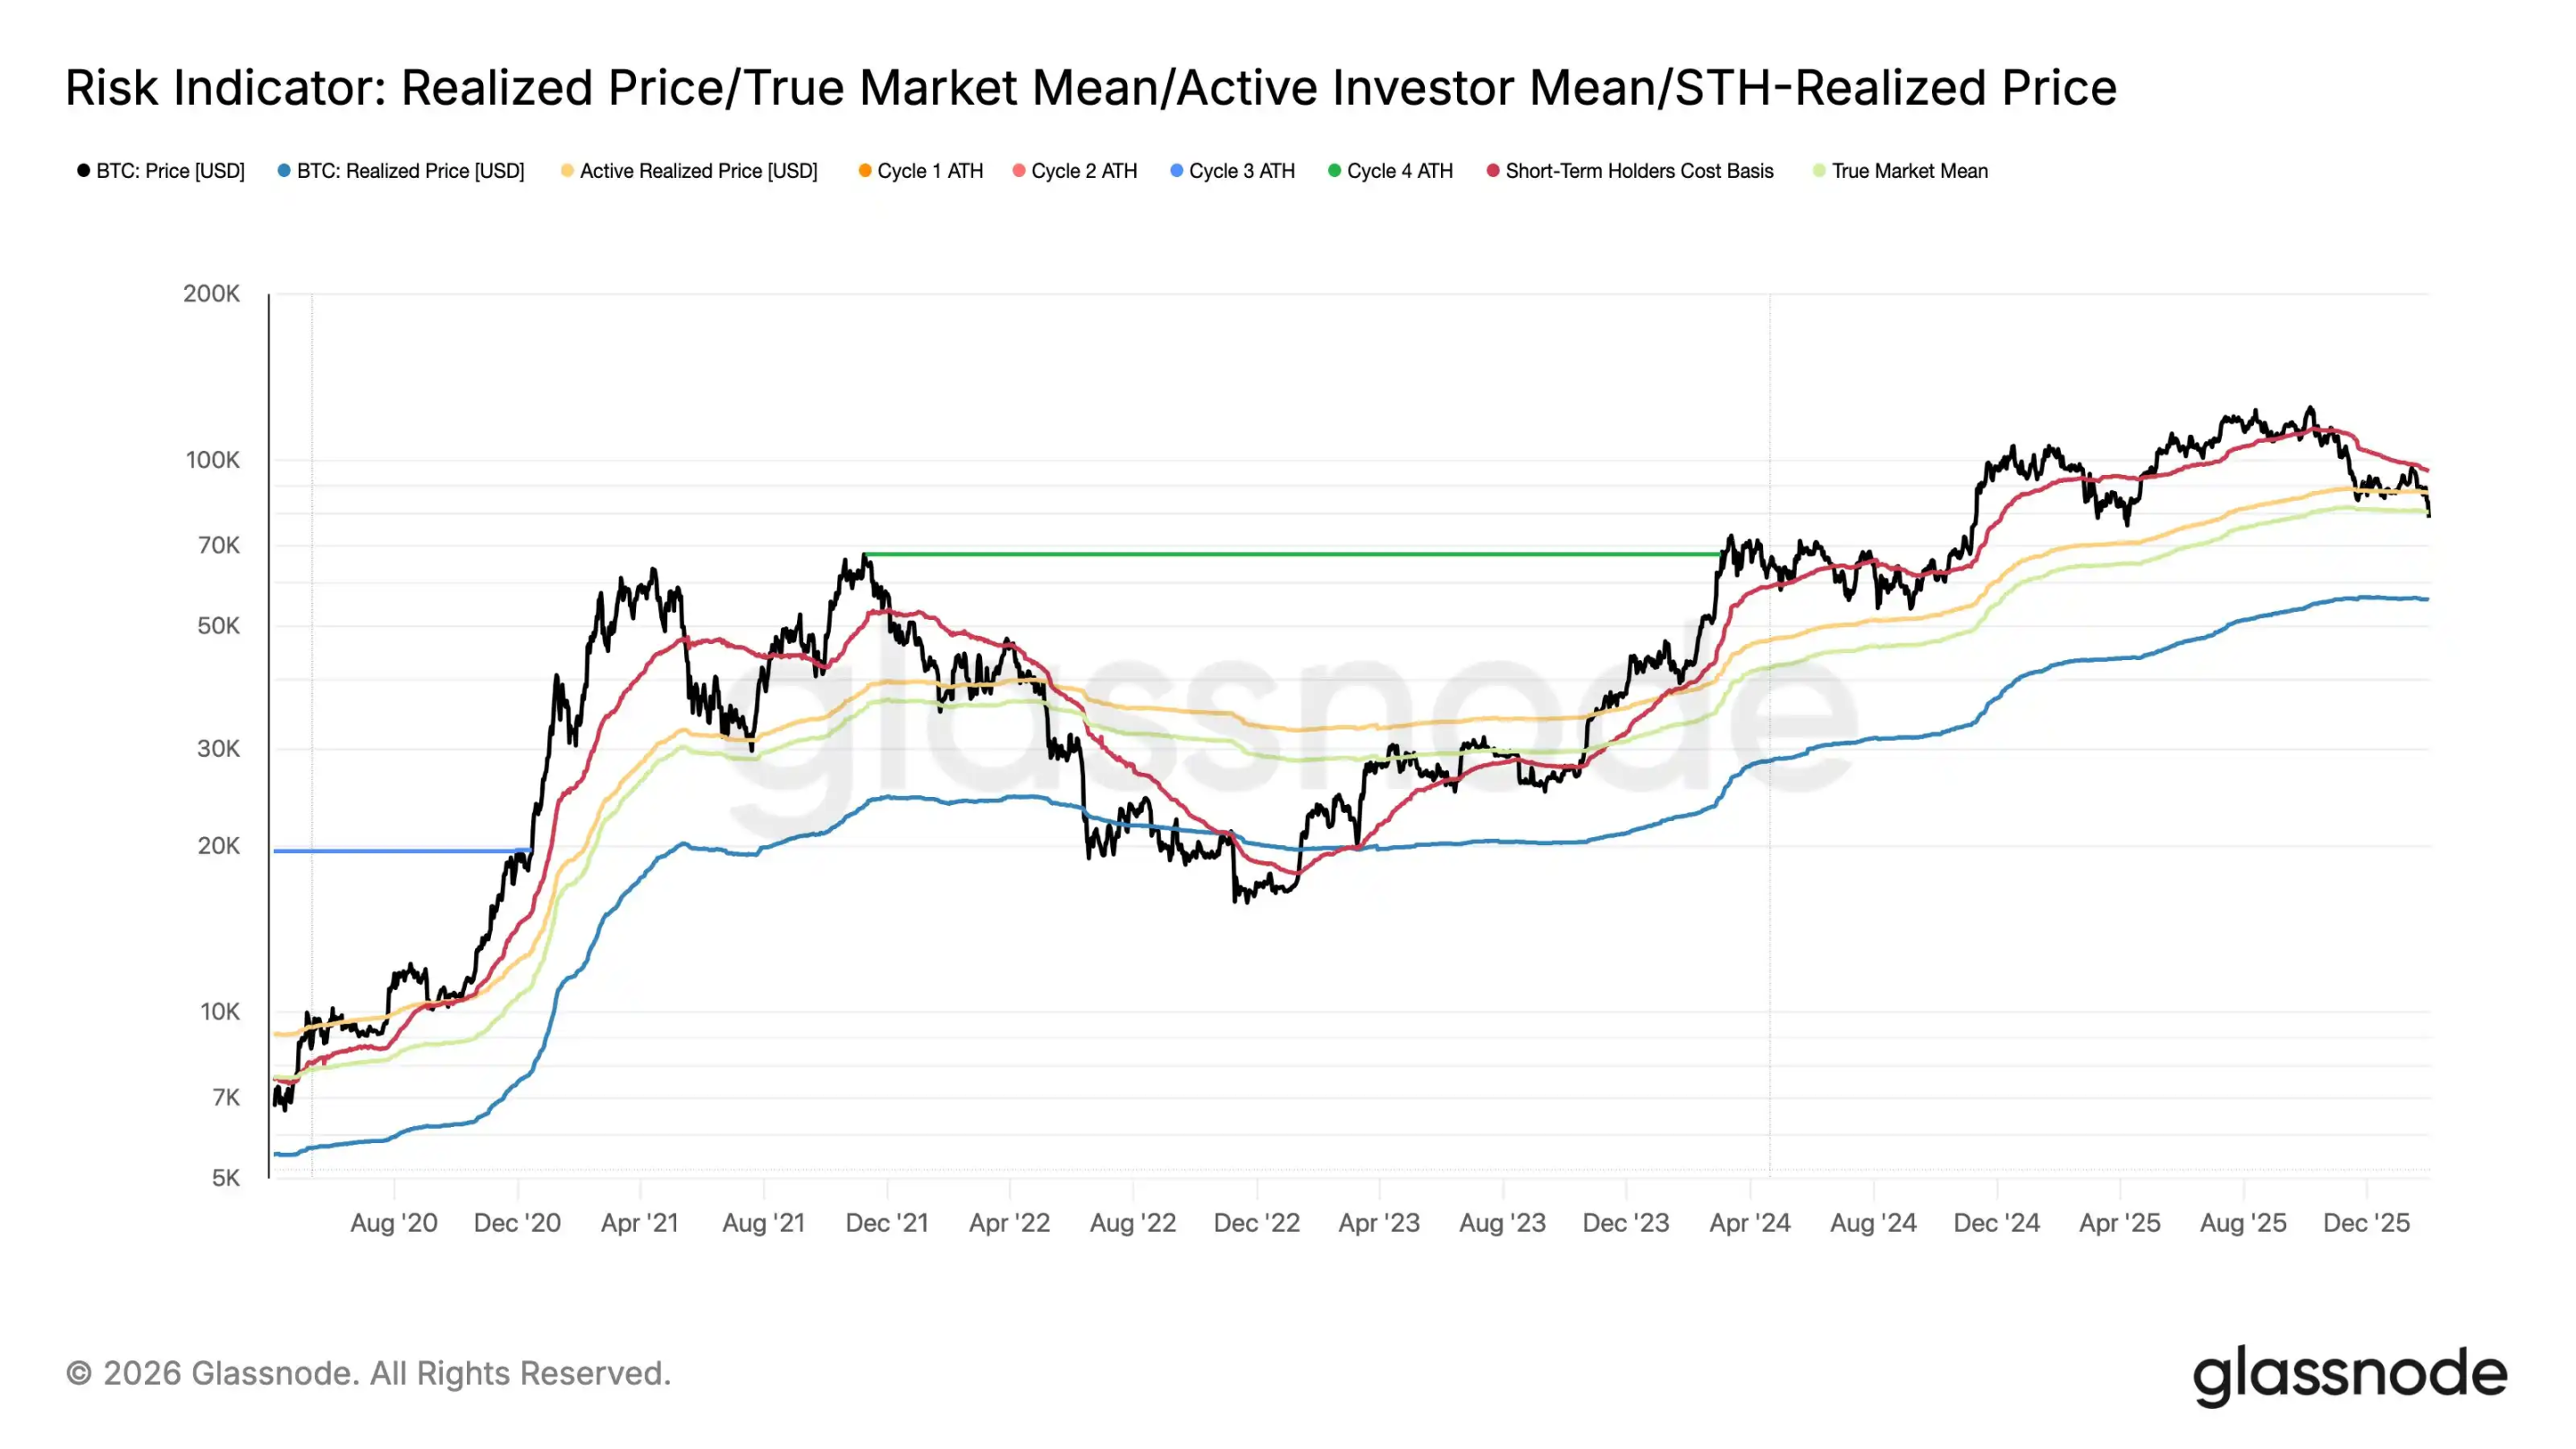
The average investment amount for active investors, the average holding cost of traders currently "in the market," is $87,300; the real market average, focusing on the cost of actual traders in the secondary market, is $80,500. The transaction price, representing the average cost basis of all coins in the network, is $55,900.
This means that when the BTC price is below $80,500, the price you bought is lower than the recent cost price of other traders. If BTC falls below $55,900, it indicates that your purchase price is lower than the average cost of the entire network.
During the 2022 bear market cycle, BTC's price once fell below the average cost basis of the entire network. In this cycle, whether BTC will fall below $55,900 remains uncertain, influenced by macro liquidity, spot ETFs, and other factors.
AHR999 Indicator Shows Accumulation Signal
The AHR999 indicator was invented years ago by Weibo user ahr999 to assess the short-term return and price deviation of BTC. The calculation formula for this indicator is (current price / 200-day dollar-cost average) × (current price / index growth valuation), where the index growth valuation is based on a fitted curve of historical prices and block heights, representing the long-term "fair value." Historical experience shows: AHR999 of 0.45 is a low-price buying zone; 0.45-1.2 is suitable for dollar-cost averaging; >1.2 is a high-price zone.
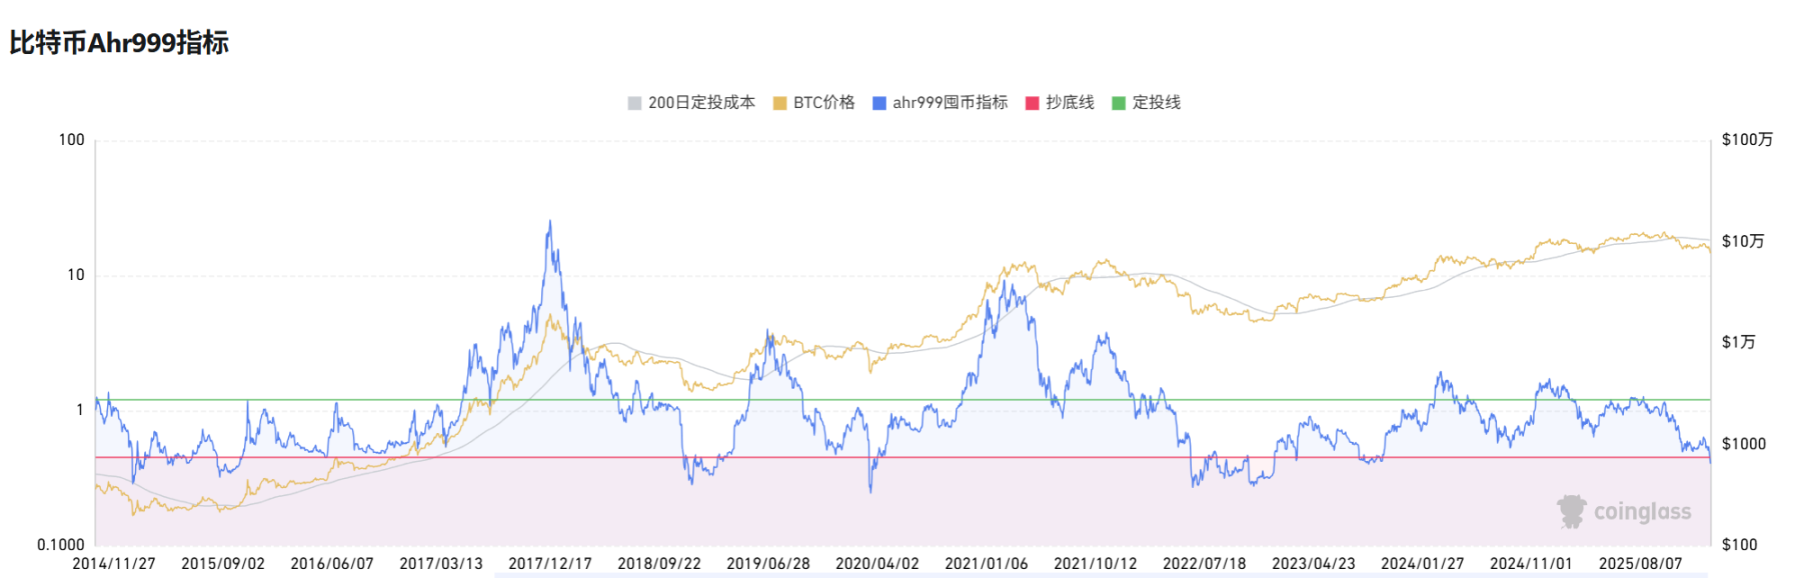
On February 1, 2026, AHR999 first fell below 0.45, marking the first occurrence in 839 days since October 16, 2023, indicating a potential market bottom. The current drop below the threshold suggests that BTC's price is significantly below long-term growth expectations, similar to the end of the bear market in 2023. This signal strongly suggests buying the dip, but it needs to be confirmed with trading volume to avoid false breakouts. Buying strategy: If AHR999 stabilizes below 0.45, one can buy in batches below $76,000, aiming to reduce positions when it rebounds above 1.2.
Willy Woo Indicator Shows BTC's Iron Bottom at $45,000
The well-known analyst Willy Woo developed the CVDD model, which states that when Bitcoin is transferred from an old investor who bought at $1 to a new investor who buys at $100,000, the new investor will assess the value of these Bitcoins at a higher bottom price, which helps elevate the recognized bottom price of the entire Bitcoin supply globally. Active custody rotation (i.e., Bitcoin frequently transferring between different investors or custodians) may also indicate that investors place great importance on these Bitcoins.
When many whales transfer BTC to new Bitcoin wallet addresses, the market bottom price is raised.
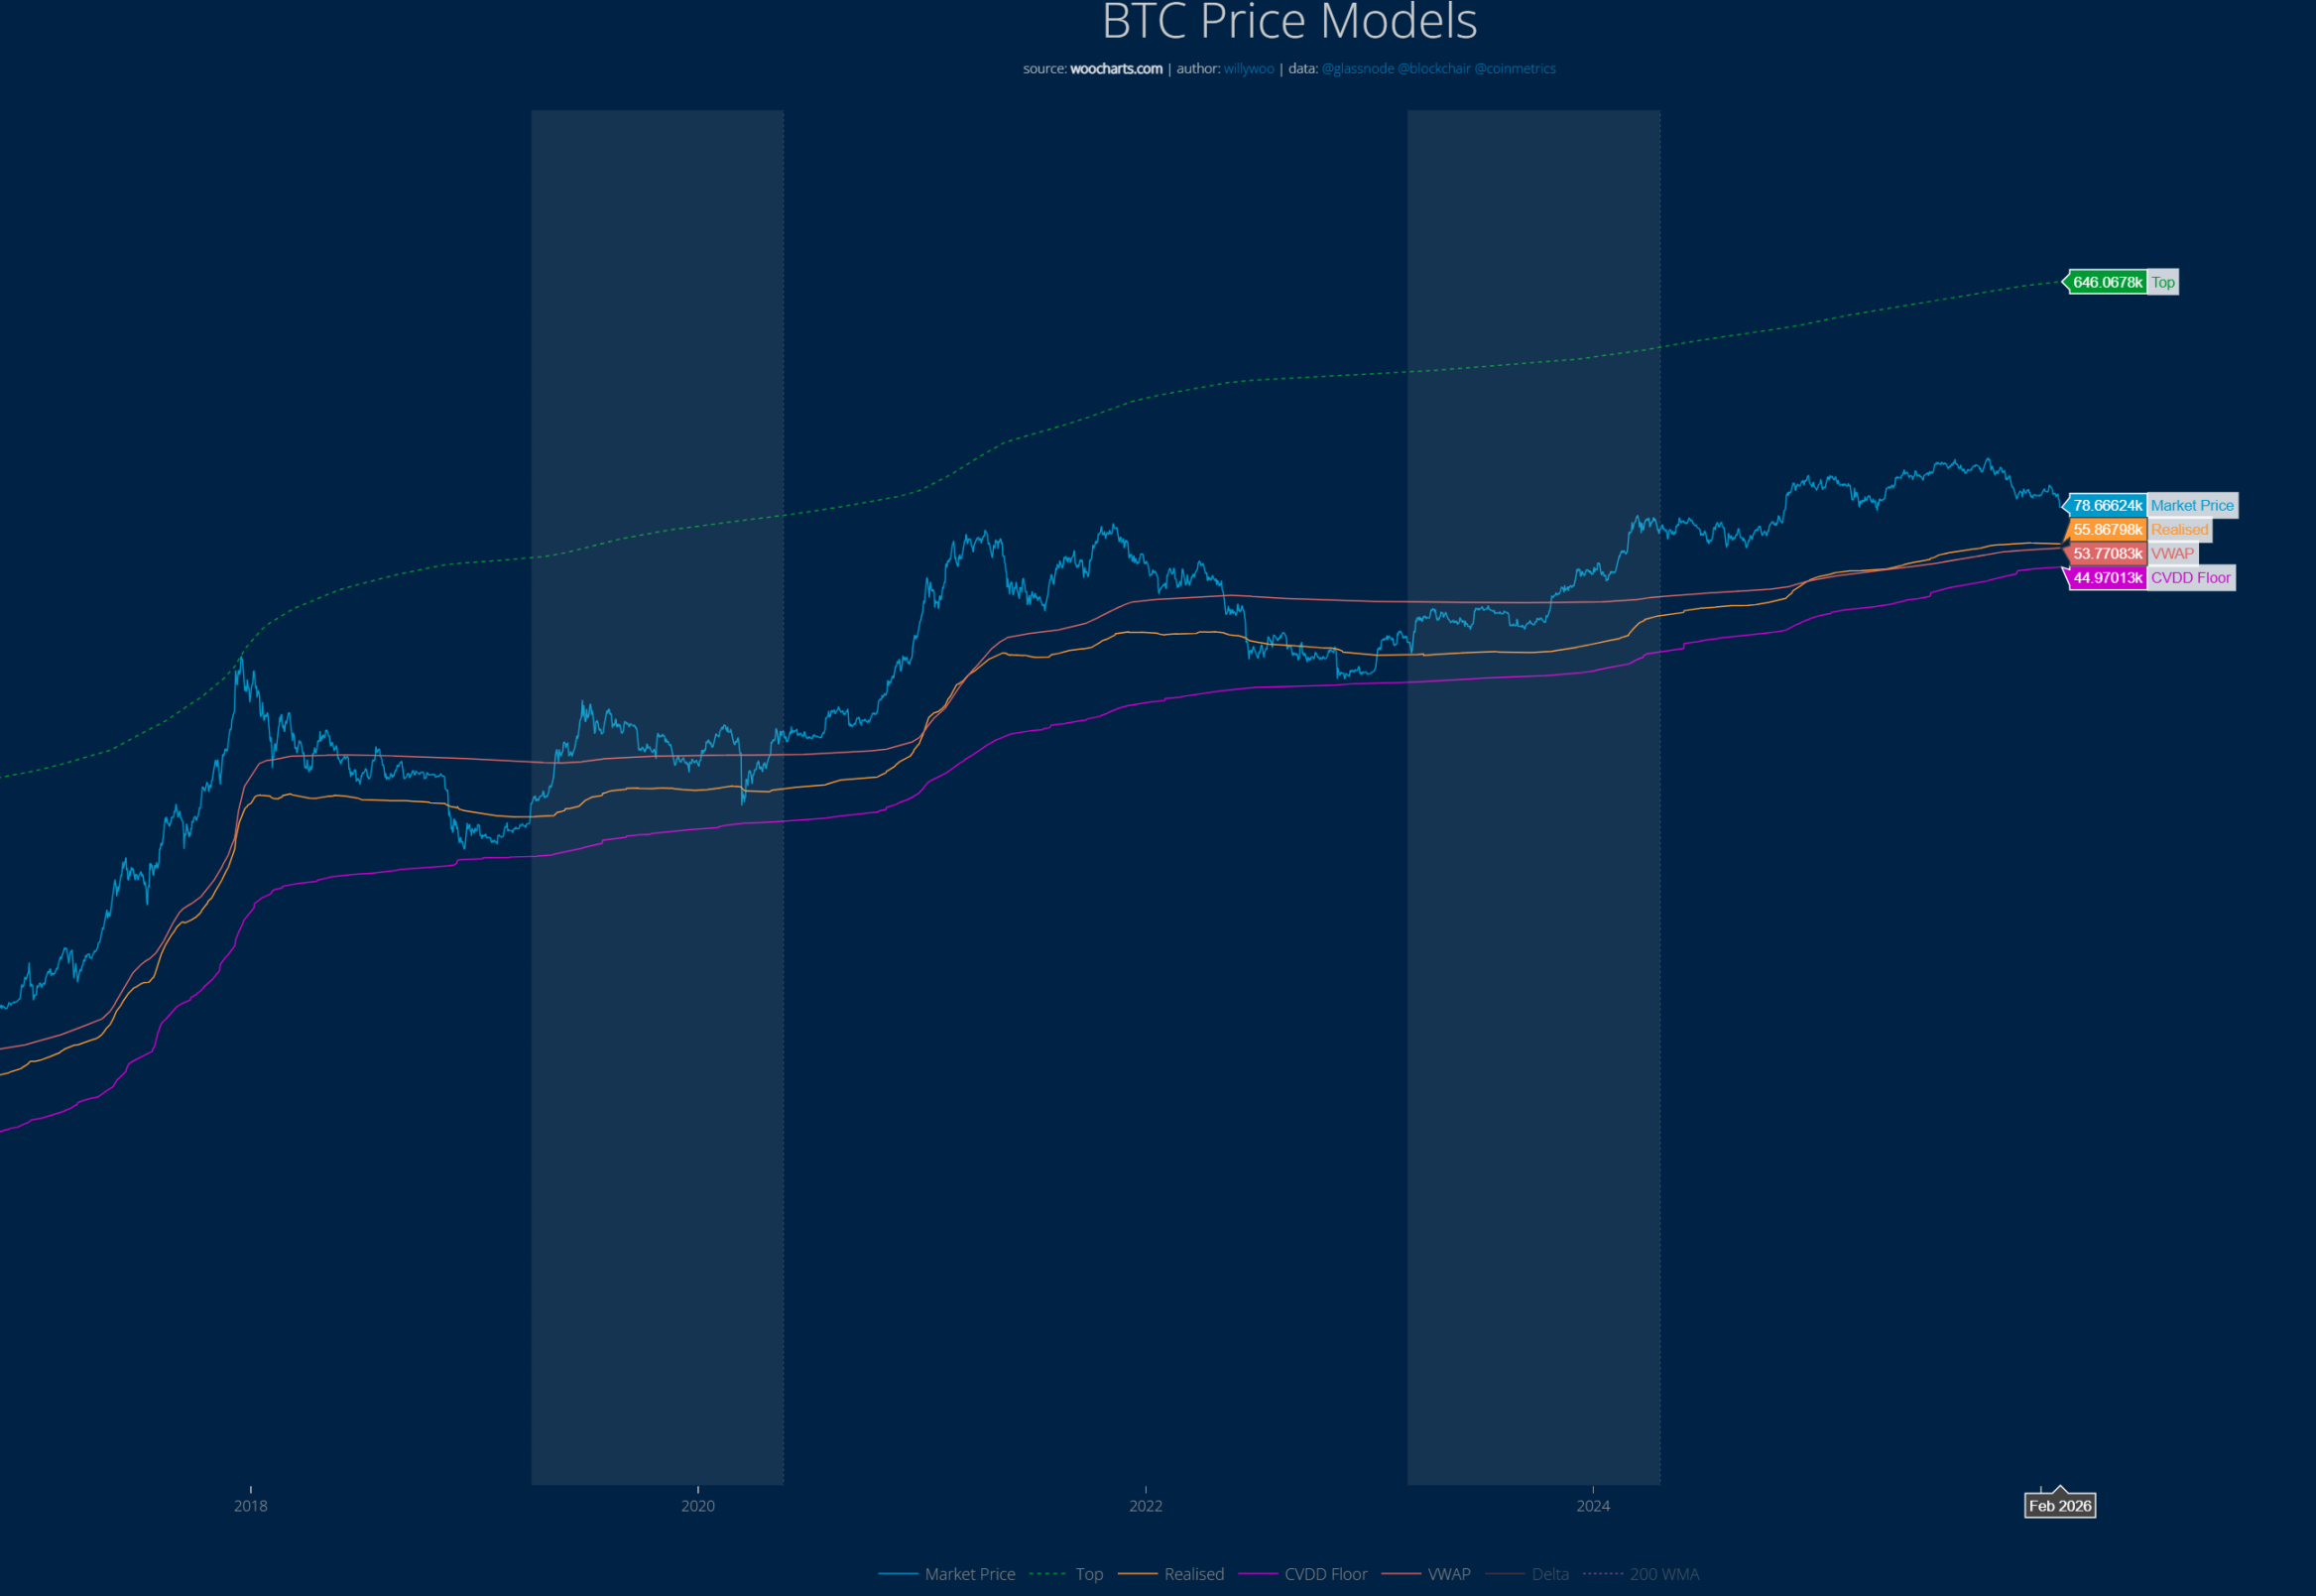
BTC's price has never fallen below the red line (CVDD model). Currently, the CVDD indicator shows its iron bottom at around $45,000. In past cycles, BTC once fell below the yellow line shown in the chart, which currently ranges from $53,000 to $56,000.
Strategy Bitcoin Cost Price at $76,000
As of February 2, the well-known Bitcoin hoarder Strategy has a total holding value of approximately $54.2 billion, holding 712,647 BTC, with an average holding cost of about $76,040.
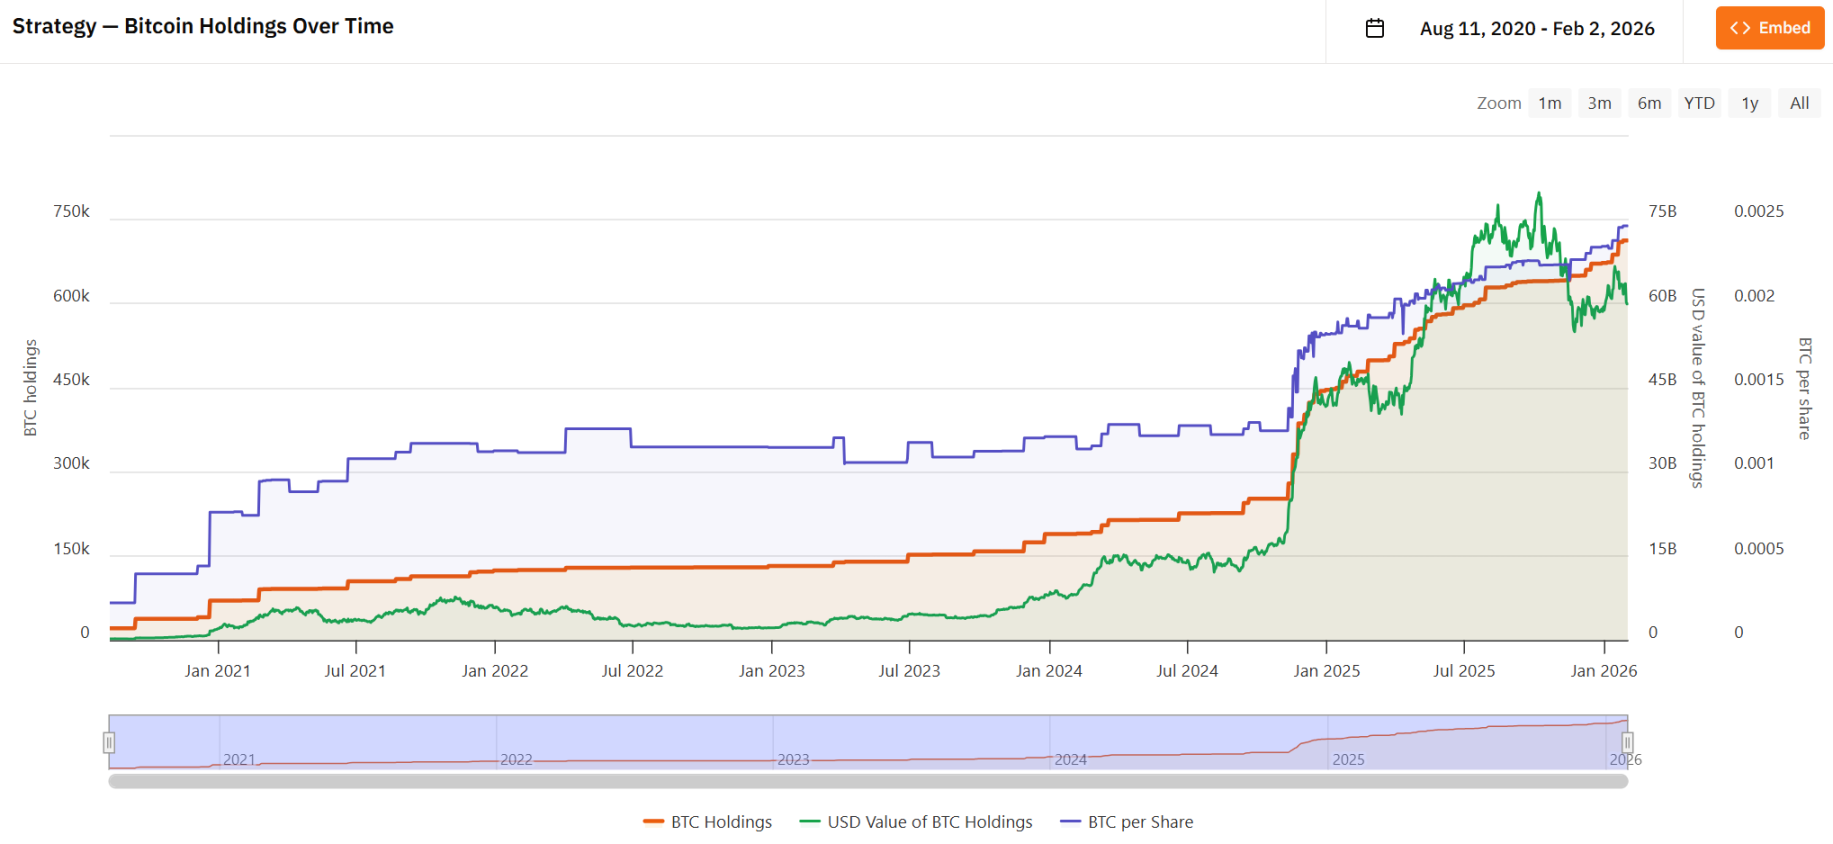
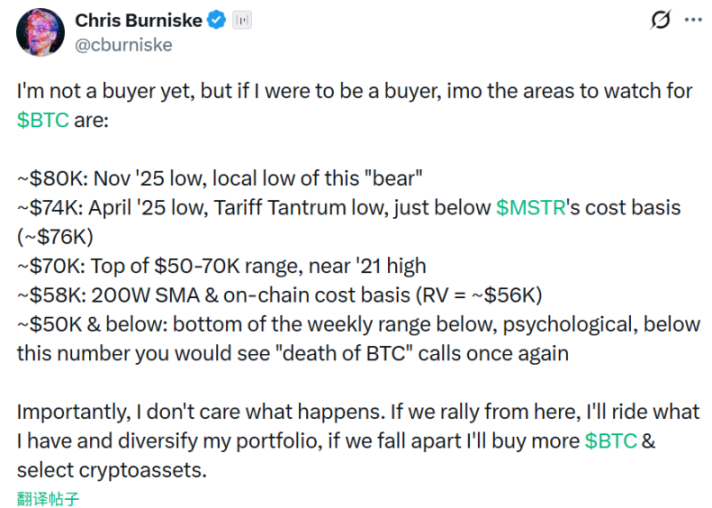
Historically, the average cost price below this level indicates the bottom range. Placeholder partner Chris previously stated that the $74,000 to $76,000 price line is very noteworthy.
免责声明:本文章仅代表作者个人观点,不代表本平台的立场和观点。本文章仅供信息分享,不构成对任何人的任何投资建议。用户与作者之间的任何争议,与本平台无关。如网页中刊载的文章或图片涉及侵权,请提供相关的权利证明和身份证明发送邮件到support@aicoin.com,本平台相关工作人员将会进行核查。