Bitcoin Market Chat: This Downtrend, Should We Take a Breath and Keep Watching?
First, let's look at the technical aspects, we'll go from big to small:
Daily Chart (Looking at the Big Direction): The bears are clearly in control. The price is firmly pressed below all commonly used moving averages (like the 5-day, 10-day, and 20-day lines), moving neatly downward. The MACD is below zero, the green bars are quite long, and the RSI has dropped to 22.5, indicating clear overselling. In simple terms, the drop has been too sharp and too fast. Yesterday (February 1st), that spike indicates someone wanted to bottom fish around $76,000-$77,000, but today's rebound lacks strength; whether it can stabilize remains to be seen.
4-Hour Chart (Looking at Mid-Term Rhythm): Similar to the daily chart, the bears are in charge. Every time the price slightly rebounds and tries to touch the 5-day moving average, it gets pushed back immediately, as if there’s a wall pressing down. The MACD is also underwater; although the green bars are a bit shorter, it’s still too early to turn red, indicating a pause after a drop.
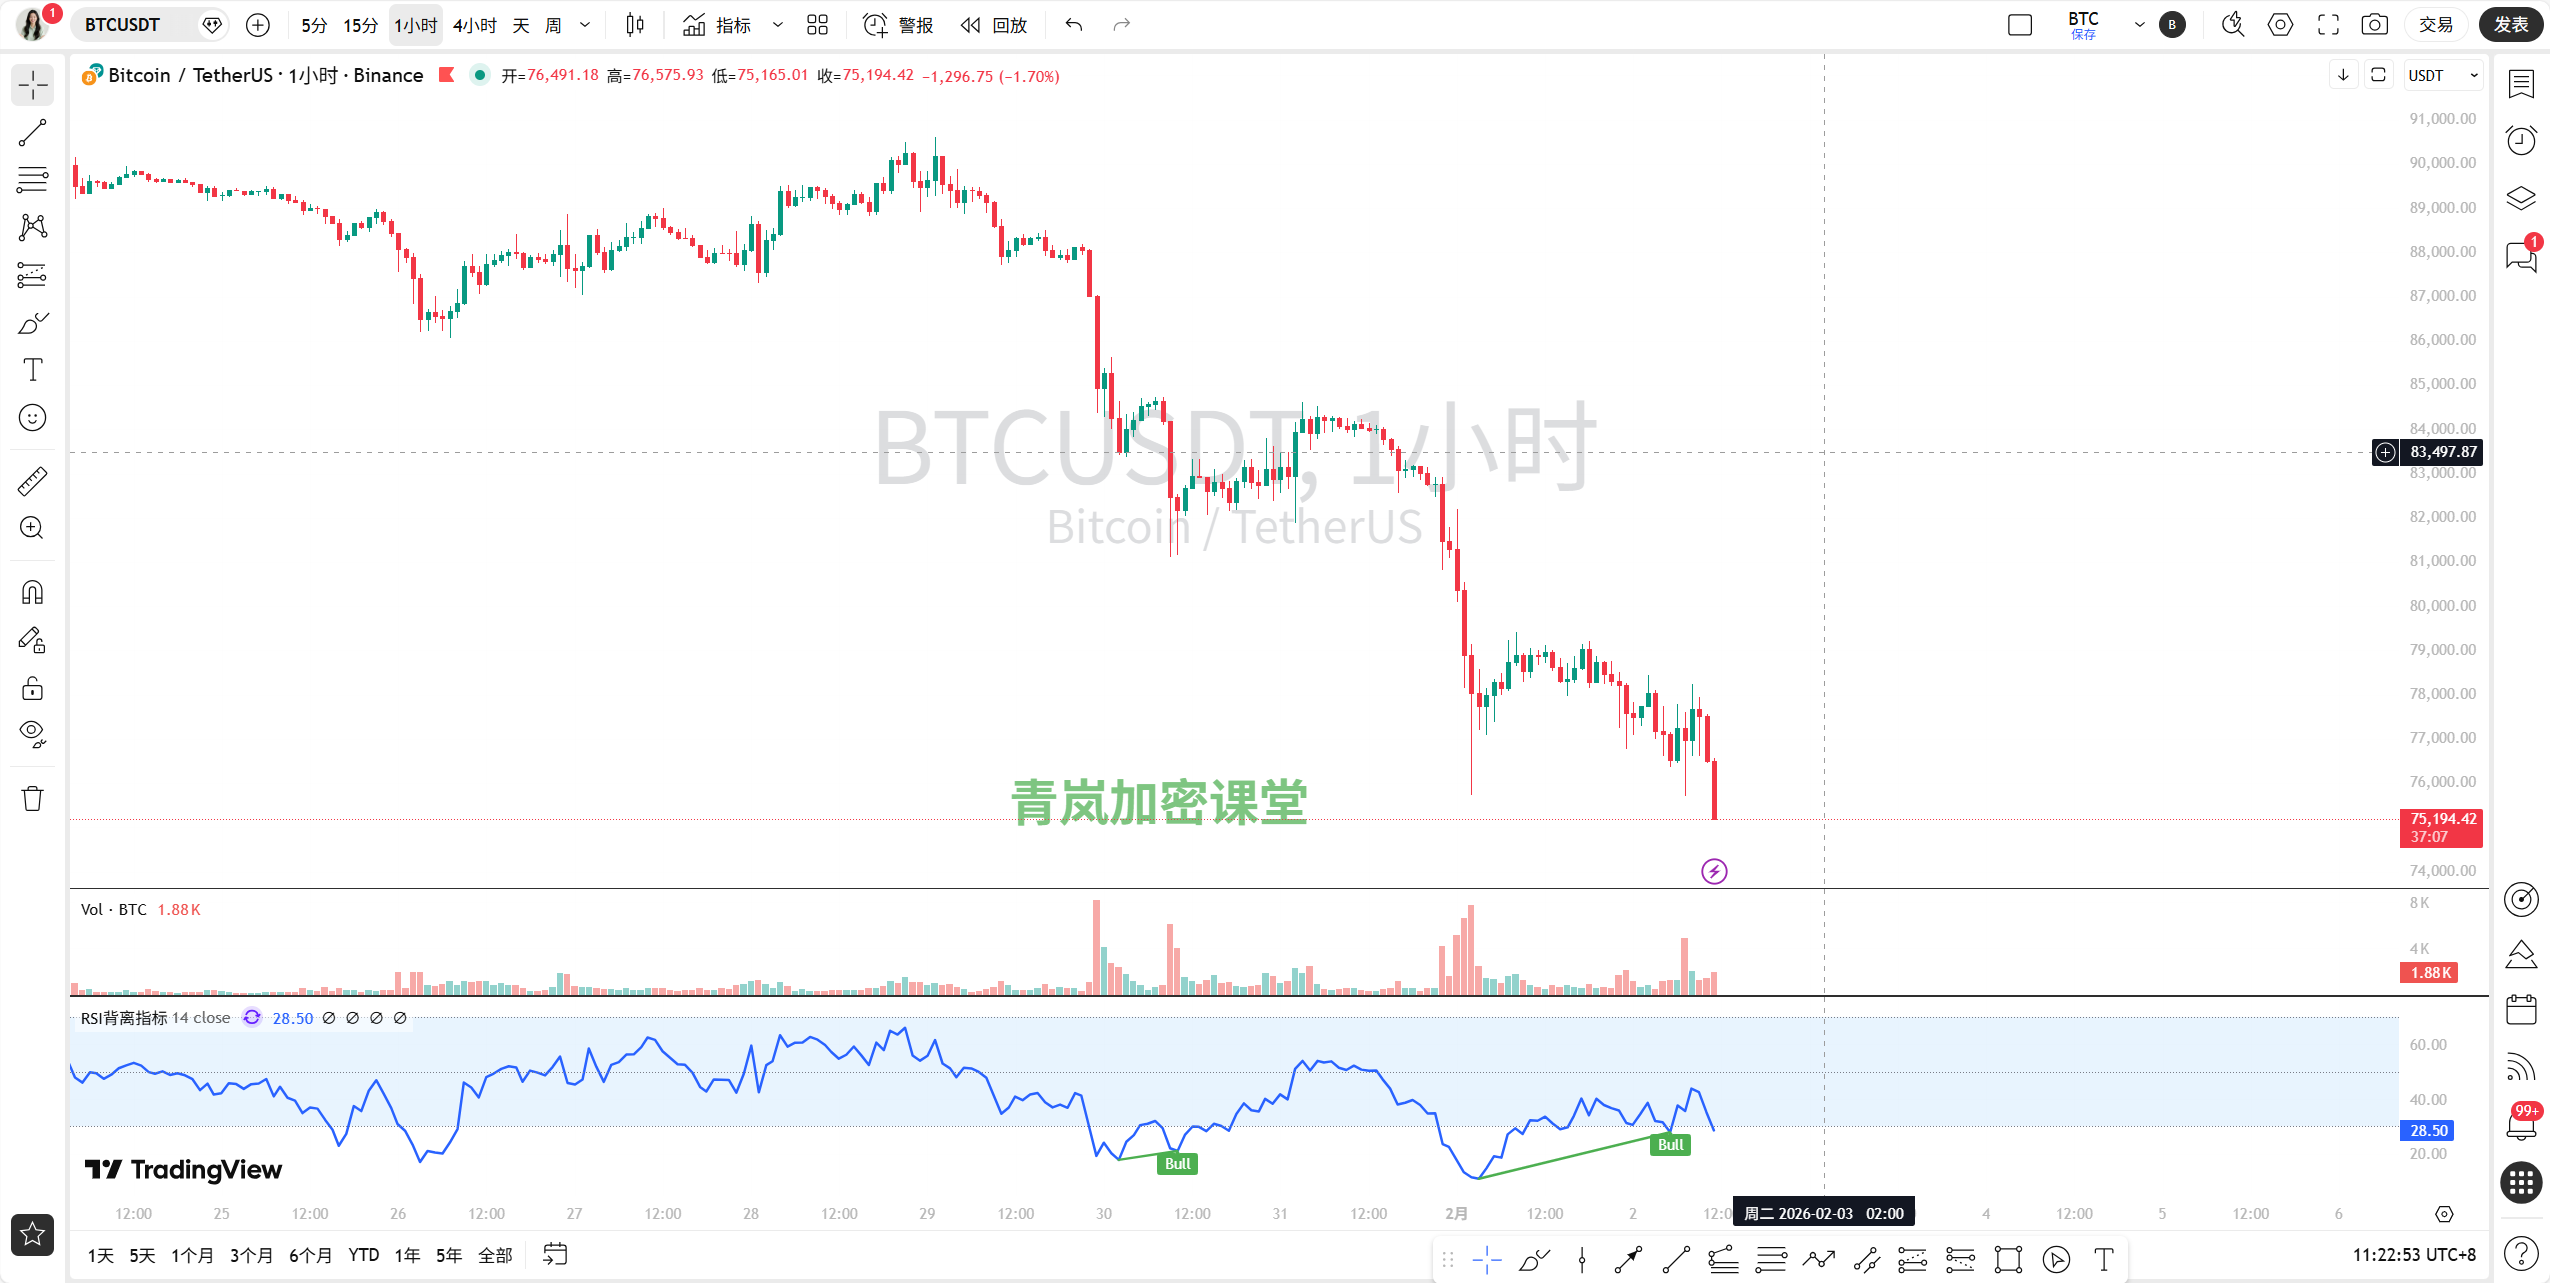
1-Hour Chart (Looking at Short-Term Moves): This is interesting. The price is stuck between $76,000 and $78,000, bouncing up and down, forming a small box. The MACD seems to want to cross bullishly, but lacks strength; the RSI is hovering around 35, neither strong nor weak. This indicates that after the sharp drop, both bulls and bears are temporarily at a stalemate here, but neither side is willing to give in, making the balance quite fragile.
15-Minute Chart (Looking at Market Activity): This shows the most real-time action, bouncing around in a small range, direction unclear. It indicates that both bulls and bears are engaged in close combat within this "small box," with no clear winner yet.
Now, looking at the news, it’s like “rubbing salt in the wound”:
Cold Winds from Outside: It’s heard that the Federal Reserve might appoint a more “hawkish” (favoring tighter monetary policy) chair, causing the market to panic, worried that money will become more expensive and tighter in the future. Gold and U.S. stocks have fallen, and Bitcoin, as a “risk asset,” naturally struggles to escape.
Internal Deleveraging: Hundreds of millions of dollars were liquidated overnight, with most of the liquidations coming from those who borrowed money to go long (bullish). This is like throwing a bucket of ice water on an overheated market, washing out many impatient “gamblers.”
Concerns About Big Players Holding Up: The market is murmuring about companies like MicroStrategy, which borrowed a lot of money to buy Bitcoin, possibly being forced to sell due to falling prices. Although the CEO says “keep buying,” this concern itself makes potential buyers hesitant to act.
So, how should we view and act on this now?
The core message is: the overall trend is still downward, and the short-term rebound is just a “breather” after a sharp drop; don’t mistake it for a reversal. There are plenty of bad news, and no good news in sight.
In terms of operations, here’s how to think:
If you’re itching to trade short-term (high risk): Focus on that “small box” on the 1-hour chart ($76,000-$78,000). Near $78,000 (also a 4-hour resistance level), you can try a small short position, setting a stop loss above $78,500; near the previous low around $76,000, you can try a small long position for a rebound, but you must place a stop loss below $75,500. Remember, this is like picking up chestnuts from the fire; take profits quickly, don’t linger!
If you prefer stability and don’t want to fuss (recommended): Then watch more and act less, or simply consider only looking for short opportunities. Because the overall trend is down, following the trend is safer. You can patiently wait for the price to rebound to around $78,000-$78,500, and if it shows signs of stalling (like a failed breakout), then consider entering a short position, targeting $76,000 first, and if that breaks, look for lower levels.
Key Levels to Remember: Above, the key resistance level is $78,500-$79,000; if it breaks through with volume, the short-term downward rhythm may change. Below, the lifeline is $76,000-$75,500; if it fails to hold here, the downward space may open up again.
The Qinglan Crypto Classroom is now in session! BTC's four cycles + dual perspectives on news impact, guiding you to catch the rhythm of the crypto market. More quantitative breakdowns on how real-time news affects market sentiment have been updated in my Qinglan Crypto Classroom, www.qinglan.org
Lastly, a word of caution:
In the face of trends, don’t always think about being the “brave warrior catching flying knives.” The market is educating everyone with sharp drops; at this time, what’s more important than being brave is surviving longer. Control your hands, preserve your capital, and wait for clearer opportunities. Let’s maintain patience together!
(The above is for discussion purposes only and does not constitute any investment advice.)
免责声明:本文章仅代表作者个人观点,不代表本平台的立场和观点。本文章仅供信息分享,不构成对任何人的任何投资建议。用户与作者之间的任何争议,与本平台无关。如网页中刊载的文章或图片涉及侵权,请提供相关的权利证明和身份证明发送邮件到support@aicoin.com,本平台相关工作人员将会进行核查。


