Bitcoin One-Hour Level Market Analysis
1. Trend Structure
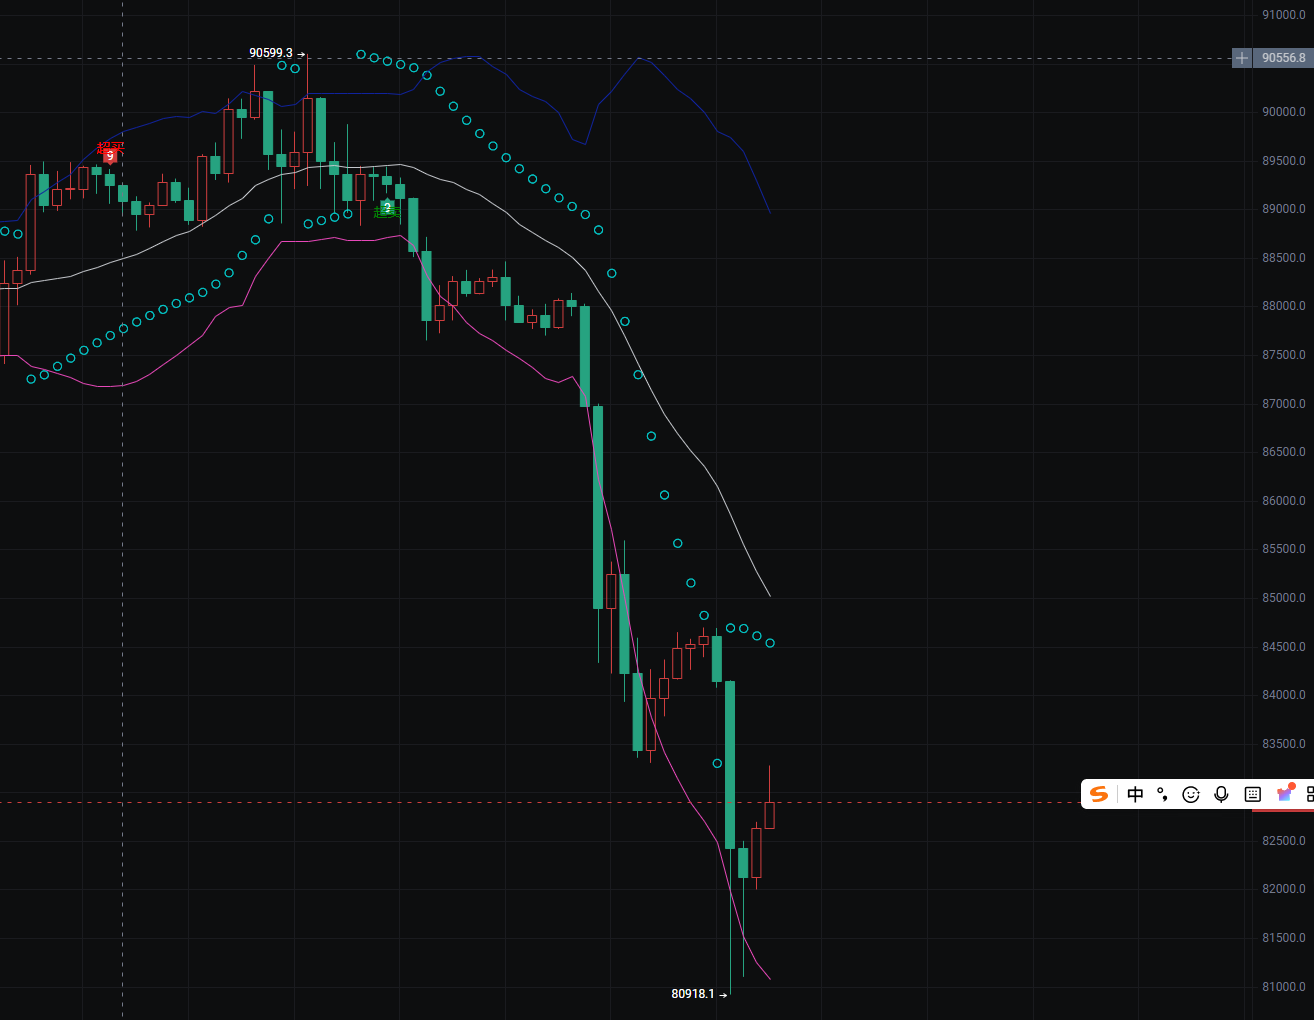
Previous Stage: The price formed a clear double top pattern around 90,000, reaching a high of 90,599.3 before facing pressure and falling back, which is an important reversal signal.
Accelerated Downward Stage: After breaking key support, the price experienced a rapid drop with consecutive large bearish candles, plunging directly from around 90,000 to a low of 80,918.1, with a short-term decline exceeding 10%, indicative of panic selling.
Current Status: After reaching the low, there was a slight rebound, but the strength of the rebound is weak, currently in a phase of oscillation and repair after an oversold condition.
2. Indicator Signals
Bollinger Bands: The price has completely broken below the lower Bollinger Band, and the lower band is continuously turning downwards, indicating that it is currently in a very weak one-sided downward trend.
Moving Average System: Short-term moving averages (white, purple) show a steep downward divergence, with the price consistently running below the moving averages, indicating that bearish forces completely dominate the market.
Auxiliary Indicators (Dots next to K-line): Continuous appearance of short-selling signal dots during the decline further validates the persistence of the trend.
3. Key Support and Resistance
Support Level: The current low of 80,918.1 is an important psychological support in the short term. If this level is effectively broken, the next target may look towards the 80,000 round number.
Resistance Level: The recent rebound resistance is in the 84,000–85,000 range (the consolidation platform during the previous decline), with further resistance at the 88,000–90,000 area of previous dense trading.
4. Trading Perspective Response Ideas
Short-term Traders: In a clear downward trend, avoid blindly bottom-fishing and wait for a clear stop-loss signal (such as a long lower shadow at the bottom, a bullish candle breaking through the short-term moving average, etc.).
Trend Traders: You can attempt to short in line with the trend at the rebound resistance level, with stop-loss set above the resistance level.
Risk Warning: This kind of sharp decline has significant volatility, requiring strict control of positions and stop-losses, and be wary of risks from sudden oversold rebounds.
1. Short-term Trading (Intraday / Very Short-term)
Core Idea: Do not guess the bottom, only act on clear rebound or continuation signals.
Long Conditions: If the price stabilizes above 82,000 and a bullish candle with volume breaks through the short-term moving average (e.g., the 20-period moving average on the hourly chart), you can try a small long position, with a stop-loss below 81,500, targeting 83,500–84,000.
Short Conditions: If the price rebounds to the 83,500–84,000 range and meets resistance (showing a bearish candle pressure signal), you can short in line with the trend, with a stop-loss above 84,500, targeting 82,000–81,000.
Key Reminder: Oversold rebounds after sharp declines often have limited strength and duration, so be sure to enter and exit quickly, with strict stop-losses to avoid holding positions.
2. Trend Trading (Swing / Medium to Long-term)
Core Idea: Follow the bearish trend, do not bottom-fish against the trend.
Short Strategy: Wait for the price to rebound to the key resistance area of 84,000–85,000 (previous decline continuation platform). If a pressure signal appears (such as a bearish candle with reduced volume, indicator divergence), you can build a short position in batches, with a stop-loss set above 85,500, targeting first at the 80,000 round number, and if broken, look down to 78,000.
Wait-and-See Strategy: If the price directly breaks below the low of 80,918, do not rush to short, wait for a confirmation of a pullback before entering, to avoid being trapped in a "false short" scenario.
3. Risk Control (Applicable to All Strategies)
Position Management: In such a highly volatile market, it is recommended to control the position size of a single asset to within 5% of total capital to avoid heavy positions at once.
Stop-loss Discipline: Any entry must have a clear stop-loss level set, with the stop-loss range suggested to be within 1.5%–2% of the entry price.
Signal Filtering: Only enter when there is a clear K-line reversal pattern (such as morning star, engulfing pattern) or indicator resonance, and avoid ambiguous trades.
Ethereum One-Hour Level Market Analysis
1. Trend Structure
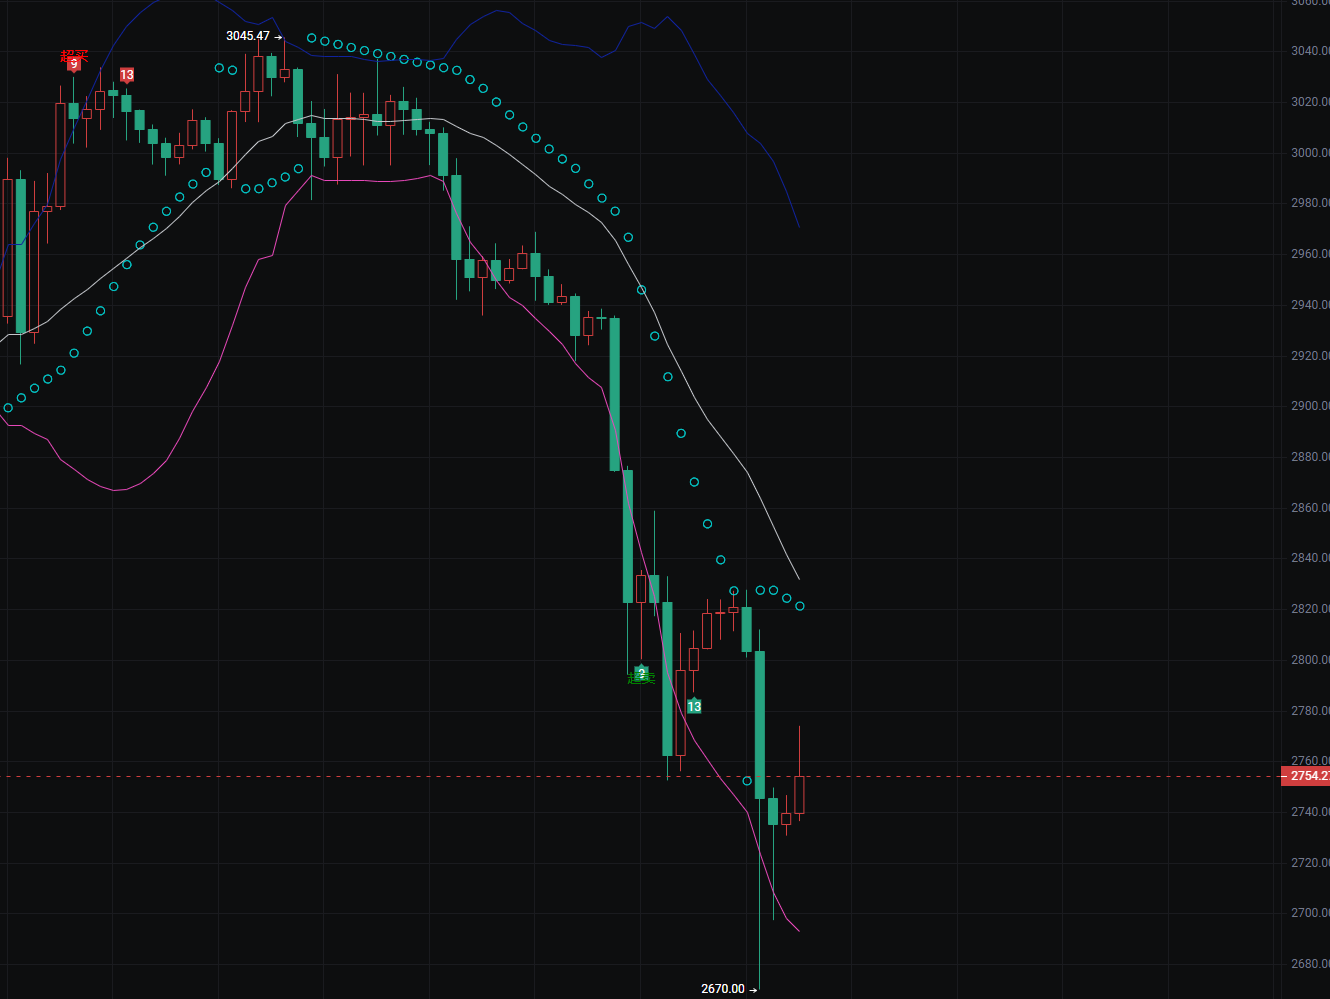
Previous Stage: The price formed a clear top pressure signal around 3045.47, then began to oscillate and fall back, which is an early sign of trend reversal.
Accelerated Downward Stage: After breaking key support, the price experienced a rapid drop with consecutive large bearish candles, plunging directly from around 3000 to a low of 2672.98, with a short-term decline close to 12%, indicative of a typical panic selling trend.
Current Status: After reaching the low, there was a weak rebound, but the strength of the rebound is very limited, still in a weak oscillation repair phase after being oversold.
2. Indicator Signals
Bollinger Bands: The price has completely broken below the lower Bollinger Band, and the lower band is continuously turning downwards, indicating that it is currently in a very weak one-sided downward trend.
Moving Average System: Short-term moving averages (white, purple) show a steep downward divergence, with the price consistently running below the moving averages, with bearish forces completely dominating the market.
Auxiliary Signals (Dots next to K-line): Continuous appearance of short-selling signal dots during the decline further validates the persistence of the bearish trend.
3. Key Support and Resistance
Support Level: The current low of 2672.98 is an important psychological support in the short term. If this level is effectively broken, the next target may look towards the 2600 round number.
Resistance Level: The recent rebound resistance is in the 2800–2850 range (the previous decline continuation platform), with further resistance at the 2950–3000 area of previous dense trading.
4. Trading Strategy Suggestions
Short-term Traders: Do not blindly bottom-fish, wait for the price to stabilize above 2750 and show a bullish candle with volume breaking through the short-term moving average, then you can try a small long position, with a stop-loss below 2700, targeting 2800–2850. If the rebound meets resistance in the 2800–2850 range, you can short in line with the trend, with a stop-loss above 2900, targeting 2700–2670.
Trend Traders: Wait for the price to rebound to the key resistance area of 2850–2900, if a pressure signal appears (such as a bearish candle with reduced volume, indicator divergence), you can build a short position in batches, with a stop-loss set above 2950, targeting first at the 2600 round number.
Risk Control: This kind of sharp decline has significant volatility, it is recommended to control the position size of a single asset to within 5% of total capital, and any entry must have a clear stop-loss level set, with the stop-loss range controlled within 1.5%–2% of the entry price.
(Note: 📣 Due to the limited timeliness and depth of information on public platforms, the market is ever-changing. Key turning points, precise operational strategies, and sudden risk warnings need to be synchronized in real-time on (Video Account - Big Bear X). Here, you can obtain: real-time strategy push, in-depth analysis support, interactive Q&A, risk warnings and optimization suggestions for personal holdings. 🚨 Remember: The market always rewards those who act faster and have more accurate information! Be a winner in the minority.)
免责声明:本文章仅代表作者个人观点,不代表本平台的立场和观点。本文章仅供信息分享,不构成对任何人的任何投资建议。用户与作者之间的任何争议,与本平台无关。如网页中刊载的文章或图片涉及侵权,请提供相关的权利证明和身份证明发送邮件到support@aicoin.com,本平台相关工作人员将会进行核查。