Ethereum one-hour technical analysis:
1. Price Trend
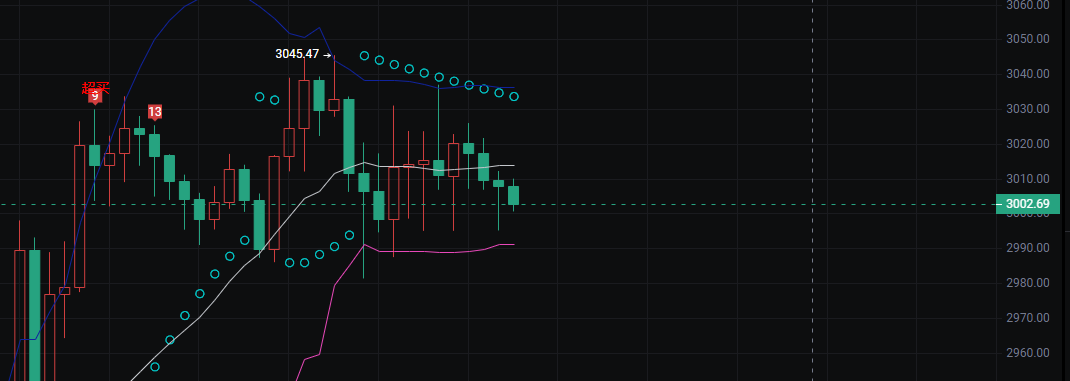
The price previously surged to 3045.47 but encountered resistance and fell back. It has now broken below the short-term support level and is in a correction phase.
The latest price of 3002.69 has retraced to the lower edge of the previous fluctuation range, providing some short-term support, but if it breaks below, it may further decline.
2. Indicator Signals
Blue Moving Average (similar to Bollinger Band upper limit / MA20): The price has fallen from above this moving average to below it, indicating a weakening of short-term bullish momentum and a weakening market.
White Moving Average (short-term moving average, such as MA5/MA10): The price has fallen below this moving average, and the moving average has started to flatten and turn downwards, signaling short-term weakness.
Pink Indicator Line: After previously following the price increase, it is currently in a flattening state, showing that bullish strength is waning, with no clear reversal signal.
Blue Small Circles: These are typically signal points for trend indicators. They appeared during the previous price increase, and the number of circles has decreased during the current correction phase, confirming the weakening trend.
3. Key Support and Resistance
Support Level: The current price near the 3000 round number is an important psychological support. If it breaks below, the next support is around the previous low of 2980.
Resistance Level: The short-term resistance above is in the 3020–3030 range (previous fluctuation platform), with strong resistance at the previous high of 3045.47.
4. Future Trend Projection
Bearish Scenario: If the price cannot stabilize above the 3000 support level and breaks below, it may test the 2980 support, or even decline further.
Bullish Scenario: If it can stabilize above 3000 and regain 3020, there is a chance to retest the previous high of 3045.
Key price level references and strategy suggestions
Price Range
Nature
Strategy Suggestions
3045.47
Strong resistance level
If the price rebounds to this level and encounters resistance, consider reducing positions or shorting; if it breaks through with volume, consider going long.
3020–3030
Short-term resistance
If the price rebounds to this range and shows signs of pressure (such as long upper shadows, increased volume with stagnation), consider taking profits or reducing positions.
3000–3005
Core support
If the price stabilizes and rises in this range (such as showing bullish engulfing patterns, low-volume doji, etc.), consider buying low or adding positions; if it effectively breaks below, stop-loss and exit are necessary.
2980
Strong support level
If it falls to this position, observe for stabilization signals; if present, consider buying in batches.
One-hour Bitcoin market analysis
1. Trend Judgment
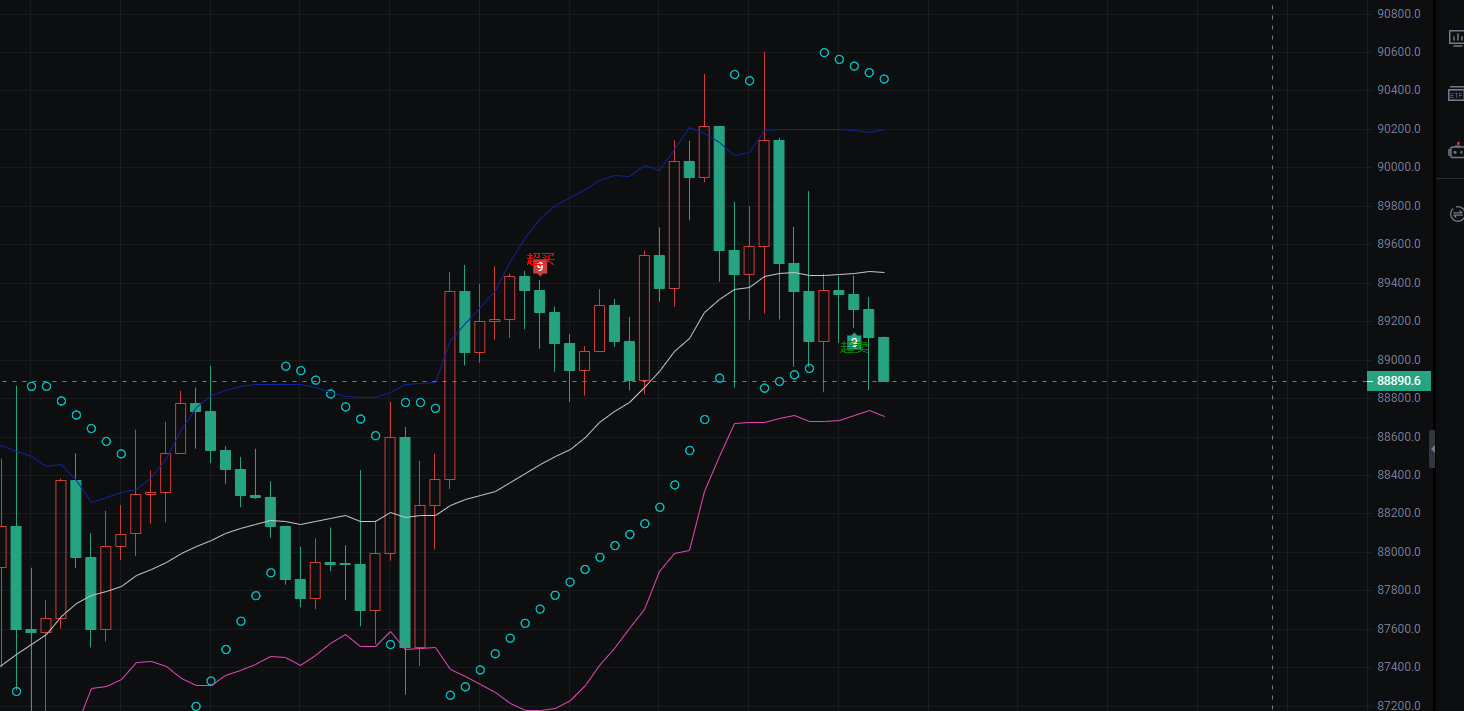
The price previously experienced a surge starting from around 87200, peaking near 90600 before encountering resistance and falling back.
The latest price is 89013.0, which has fallen below the short-term moving average and is currently in a correction phase.
Overall, this is a technical pullback after an upward trend, but if the support level is lost, it may weaken further.
2. Indicator Signals
Blue Moving Average (medium to long-term trend line): The price has fallen from above this moving average to below it, indicating a weakening of short-term bullish momentum and cautious market sentiment.
White Moving Average (short-term moving average): The price has fallen below this moving average, and the moving average has started to turn downwards, signaling clear short-term weakness.
Pink Indicator Line: After previously following the price increase, it is currently in a flattening state, showing that bullish strength is waning, with no clear reversal signal.
Blue Small Circles: A large number of circles appeared during the upward phase, and their number has significantly decreased during the correction phase, confirming the weakening of the short-term trend.
3. Key Support and Resistance
Support Level
- 88800–89000: This is the lower edge of the previous fluctuation platform and the current core support range. If it breaks below, strong support is around 88000.
Resistance Level
89500–90000: This is the previous dense trading area and the main resistance range for short-term rebounds.
90600: The previous high point, an important resistance level for bulls.
4. Future Projection
Bearish Scenario: If the price cannot stabilize above 88800 and effectively breaks below, it may test the 88000 support.
Bullish Scenario: If it can stabilize and rise near 89000, and regain 90000, there is a chance to challenge the previous high of 90600.
Key price levels and strategy comparison table
Price Range
Nature
Strategy Suggestions
90600
Strong resistance level
If the price rebounds to this level and encounters resistance, consider reducing positions or shorting; if it breaks through with volume and stabilizes, consider going long.
89500–90000
Short-term resistance
If the price rebounds to this range and shows signs of pressure (such as long upper shadows, increased volume with stagnation), consider taking profits or reducing positions.
88800–89000
Core support
If the price stabilizes and rises in this range (such as showing bullish engulfing patterns, low-volume doji, etc.), consider buying low or adding positions; if it effectively breaks below, stop-loss and exit are necessary.
88000
Strong support level
If it falls to this position, observe for stabilization signals; if present, consider buying in batches.
免责声明:本文章仅代表作者个人观点,不代表本平台的立场和观点。本文章仅供信息分享,不构成对任何人的任何投资建议。用户与作者之间的任何争议,与本平台无关。如网页中刊载的文章或图片涉及侵权,请提供相关的权利证明和身份证明发送邮件到support@aicoin.com,本平台相关工作人员将会进行核查。