📊 Bitcoin One-Hour Chart Overall Trend Analysis
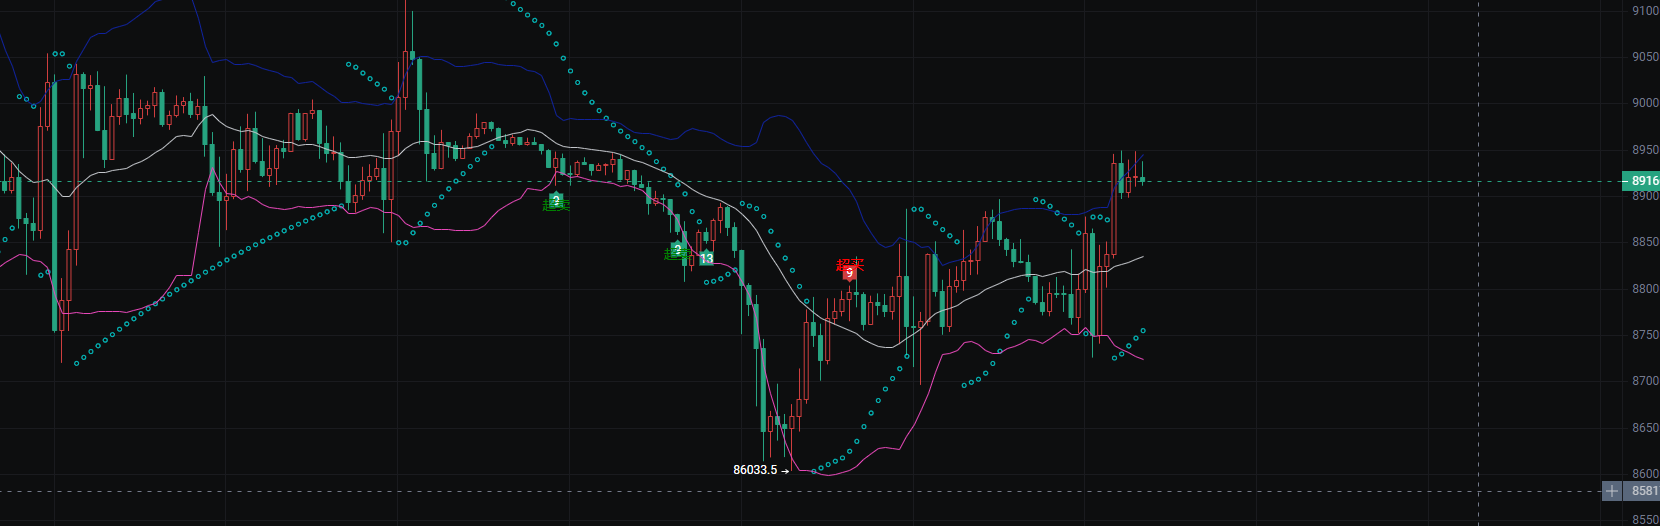
Previous Trend: The price has retreated from a high, experiencing a clear downtrend, with a low point reaching 86033.5.
Current Status: After hitting the low, the price has started to rebound and is currently in a recovery phase.
Key Price: The current price is 89146.7, having moved away from the bottom area.
🛠️ Indicator Signal Interpretation
Bollinger Bands
The price touched the lower band during the decline and then began to rebound, which is a potential short-term bottom signal.
The price has now returned to the middle band of the Bollinger Bands, indicating that market sentiment has recovered from extreme pessimism.
The opening between the upper and lower bands has narrowed after the previous decline, suggesting that short-term volatility is decreasing.
Candlestick Patterns
Recently, there have been consecutive bullish candles, showing that bullish strength is gradually increasing.
The price found support around 88000, then broke upward, forming a small double bottom pattern.
🎯 Key Points for Future Attention
Resistance Level: The upper 90000 round number is an important psychological and technical resistance level. If it can be effectively broken, the rebound trend is likely to continue.
Support Level: The lower 88000 and the previous low of 86033.5 are key supports. If a pullback breaks below these levels, one should be cautious of a second bottom risk.
Indicator Tracking: Monitor the support strength of the middle band of the Bollinger Bands. If the price can stabilize above the middle band, it can be seen as a bullish signal.
🎯 Key Price Levels and Operational References
Type
Price Range
Technical Significance
Operational Reference
Core Support Level
88000
The starting point of the recent rebound, also where the middle band of the Bollinger Bands is located.
If a pullback reaches this level and finds support, it can be seen as a short-term buying opportunity.
Strong Support Level
86033.5
The lowest point of this round of decline, the neckline of the double bottom pattern.
If this level is effectively broken, the rebound trend will be declared over, and one should be cautious of a second bottom.
Core Resistance Level
90000
A psychological round number, also the previous platform resistance area.
If it breaks out with volume and stabilizes, one can look for higher targets, aiming for 91000-92000.
Strong Resistance Level
92000
The upper edge of the previous fluctuation range, near the upper band of the Bollinger Bands.
When reaching this level, one should pay attention to volume. If it encounters resistance and falls back, consider reducing positions.
📌 Indicator Tracking Tips: Bollinger Bands: The current price is hovering near the middle band. If it can continue to stabilize above the middle band (above 88000), it is bullish; if it loses the middle band, it may weaken in the short term. Volume Changes: When breaking 90000, observe whether there is accompanying trading volume. A breakout with volume is an effective signal.
📊 Ethereum One-Hour Chart Overall Trend Analysis
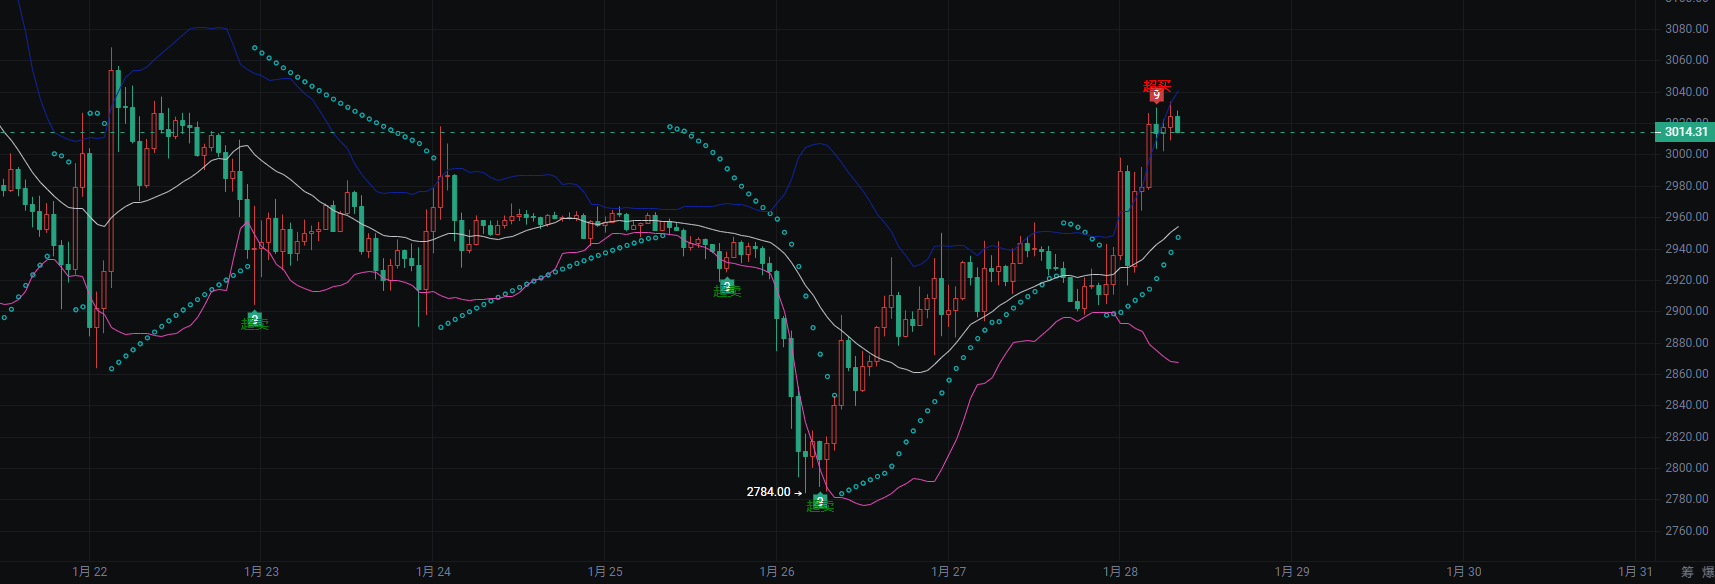
Previous Phase: The price experienced a deep correction, reaching a low of 2784.00, and then stabilized at a low, forming a clear bottom pattern.
Current Status: Starting from the bottom, the price has made a strong rebound, and recently there has been an accelerated rise, with the current price approaching the 3000 round number.
🛠️ Indicator Signal Interpretation
Bollinger Bands
The price touched the lower band while probing the bottom and then quickly rebounded, which is a typical signal of an oversold rebound.
The price has now broken above the upper band of the Bollinger Bands, indicating strong bullish momentum in the short term, entering a strong upward phase.
The opening of the Bollinger Bands is rapidly expanding, indicating a significant increase in market volatility, with a trending market unfolding.
Candlestick Patterns
Recently, there have been consecutive large bullish candles, indicating strong bullish momentum and very excited market sentiment.
Since the price rebounded from the bottom, there has been almost no deep pullback, indicating a short squeeze type of rise.
🎯 Key Points for Future Attention
Resistance Level: The upper 3000 is an important psychological round number and also a previous area of high trading volume, likely to trigger profit-taking here.
Support Level: The lower 2950 is the platform support for the recent rise and also where the middle band of the Bollinger Bands is located. If a pullback reaches this level and finds support, the upward trend is likely to continue; if it effectively breaks below, one should be cautious of short-term pullback risks.
Indicator Tracking: After the price breaks the upper band, one should pay attention to whether there will be a "pullback confirmation" action. If it can stabilize above 2950, it is a healthy strong consolidation; if it directly falls back and breaks below the middle band, it may signal a short-term top.
🎯 Key Price Levels and Operational References
Type
Price Range
Technical Significance
Operational Reference
Core Support Level
2950
The platform support for the recent rise, also where the middle band of the Bollinger Bands is located.
If a pullback reaches this level and finds support, it can be seen as a buying opportunity, continuing to look bullish.
Strong Support Level
2900
An important consolidation platform during the rebound.
If this level is effectively broken, the short-term upward trend may end, and one should reduce positions in a timely manner.
Ultimate Support Level
2784.00
The lowest point of this round of decline.
If it pulls back to this level, it is an important buying point for the medium to long term.
Core Resistance Level
3000
A psychological round number and also a previous area of high trading volume.
If it reaches this level and volume is insufficient, consider partial profit-taking; if it breaks out with volume, look for higher targets.
Strong Resistance Level
3050
The upper edge of the previous fluctuation range.
If the price reaches this level, be cautious of a significant pullback risk, and consider reducing positions or taking profits.
📌 Indicator Tracking Tips
Bollinger Bands: The current price has broken above the upper band, indicating a strong state, but one should pay attention to whether there will be a "top of the upper band + price pullback to the middle band" action. If it can stabilize above the middle band (2950), the trend will continue; otherwise, be cautious of a pullback.
Volume Changes: When approaching the 3000 level, pay attention to whether trading volume continues to increase. A breakout with volume is an effective signal; if volume decreases, a pullback may occur. If it directly falls back and breaks below the middle band, it may signal a short-term top.
Daily, we share more real-time trading strategies through internal channels. If you have been operating without direction for a long time or have been losing for a long time, please contact the teacher in the Telegram channel—Big Bear https://t.me/BTDX9045
免责声明:本文章仅代表作者个人观点,不代表本平台的立场和观点。本文章仅供信息分享,不构成对任何人的任何投资建议。用户与作者之间的任何争议,与本平台无关。如网页中刊载的文章或图片涉及侵权,请提供相关的权利证明和身份证明发送邮件到support@aicoin.com,本平台相关工作人员将会进行核查。