What to know : Historical silver tops have consistently clustered in the first half of the year. The bitcoin to silver ratio has declined toward levels last observed near bitcoin’s 2022 cycle low.
In every historic bull market across all asset classes, there is a persistent temptation to call the top.
Investors often look for validation by drawing parallels to famous contrarian calls, most notably Michael Burry’s housing market warning in 2007.
This tendency becomes more pronounced as prices accelerate and volatility increases, which is currently the environment in the silver market.
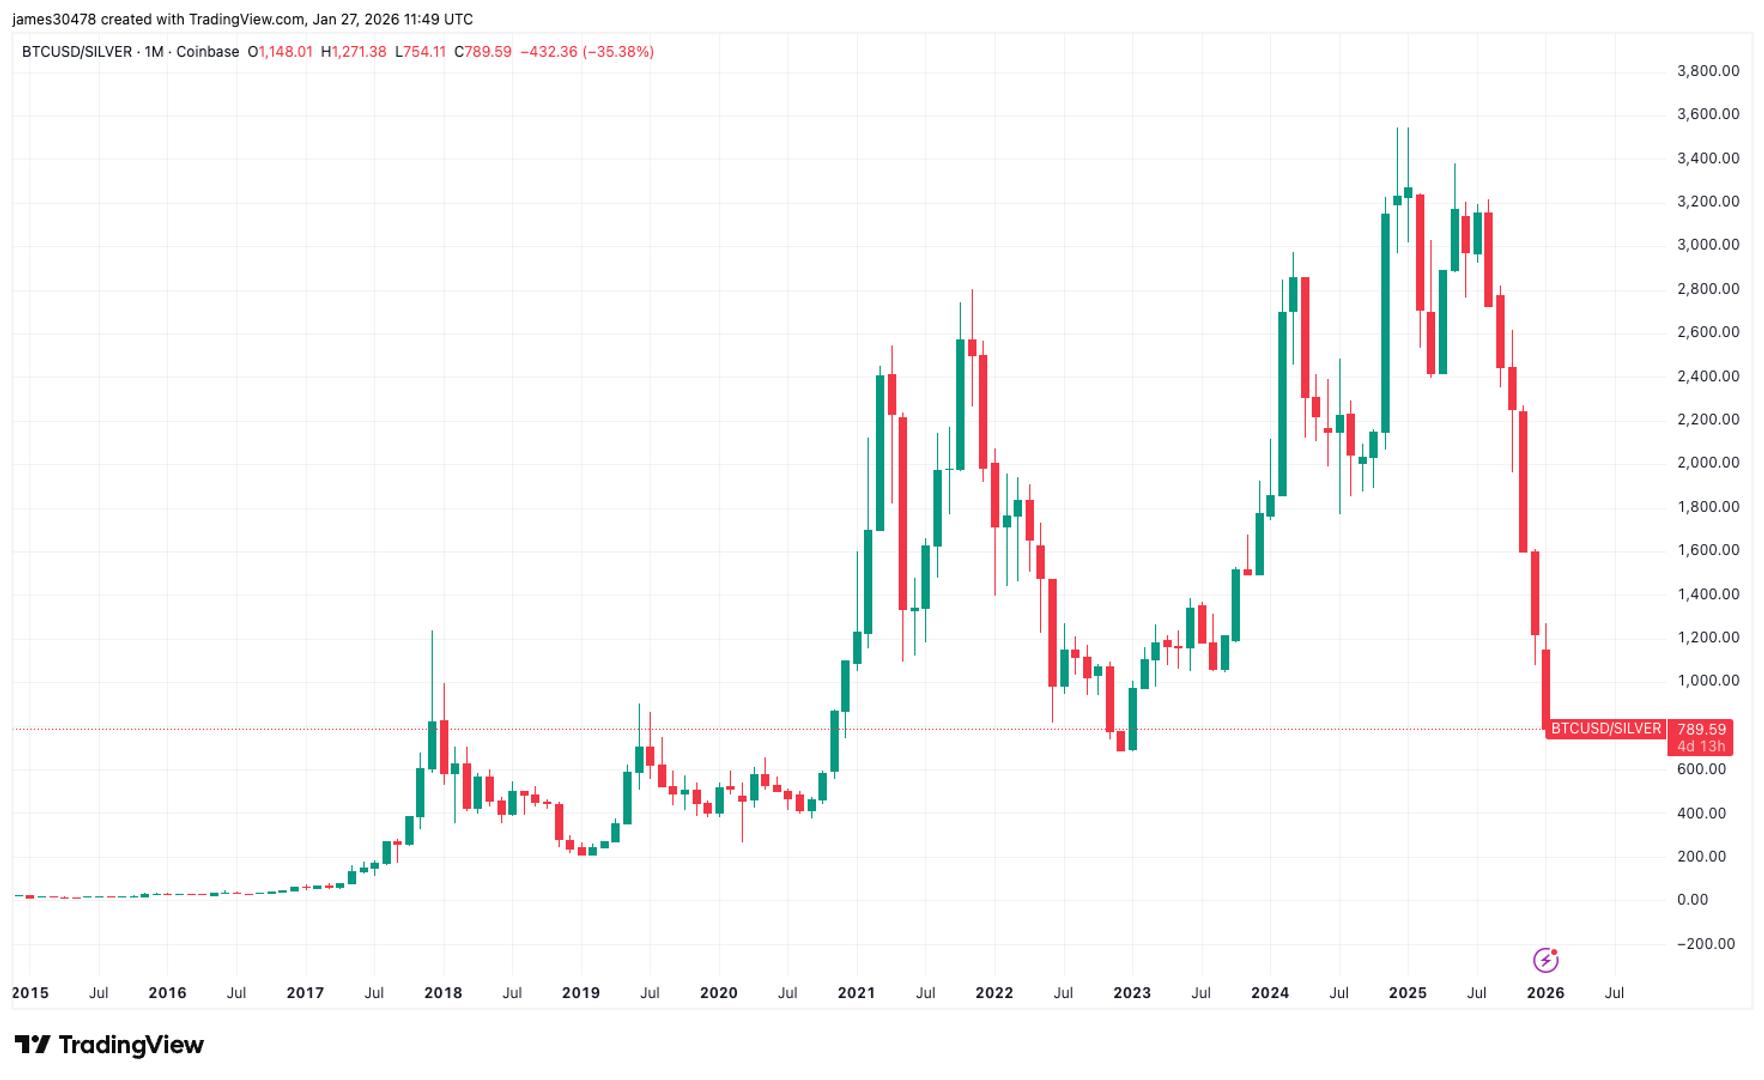
Bitcoin to silver ratio
The bitcoin to silver ratio currently stands near 780. This is now below the 2017 peak when bitcoin hit $20,000 and now close to the level seen in November 2022, when bitcoin bottomed near $15,500 as the ratio fell to around 700. Such convergence suggests silver may be entering a more vulnerable phase relative to bitcoin.
Silver has surged nearly 300% over the past year. On Monday, silver fell almost 15% after rising by a similar amount earlier in the session, briefly reaching highs near $117 per ounce before pulling back to around $112.
Previous local tops in silver have tended to cluster around the early part of the calendar year, with most occurring in the first half of the year. Notable examples include February 1974 and January 1980 which marked a clear blow off top at $47, February 1983, May 1987, February 1998, April 2004, May 2006, March 2008, and April 2011 at $50 which was also a blow off phase.
This historical pattern raises a potential red flag on silver's price action, if history is repeating itself, the precious metal may have reached its cycle peak, or even a blow off top.
免责声明:本文章仅代表作者个人观点,不代表本平台的立场和观点。本文章仅供信息分享,不构成对任何人的任何投资建议。用户与作者之间的任何争议,与本平台无关。如网页中刊载的文章或图片涉及侵权,请提供相关的权利证明和身份证明发送邮件到support@aicoin.com,本平台相关工作人员将会进行核查。


