What to know : The 100-week moving average at $87,145 remains the main line of defense. Below this, the cost basis of U.S. spot bitcoin ETF buyers at $84,099 has provided support during recent consolidation. A sustained break below $80,000 would likely open the door to a revisit of the April 2025 low near $76,000.
Bitcoin fell to as low as $86,000 when CME futures opened on Sunday after the weekend pause. It's since recovered slightly, though the market structure remains firmly in a downtrend.
This initial drop created a pricing gap extending as high as $89,265. A CME gap forms when bitcoin’s spot price moves while CME futures are closed. Historically, bitcoin has shown a tendency to revisit these gaps.
Bitcoin last made an all time high on Oct. 6, 111 days ago, and is now down roughly 30% from that peak, reinforcing the bearish momentum.
A break below $80,000 would probably introduce a revisit of April 2025 levels, when bitcoin traded as low as $76,000 during the selloff linked to President Donald Trump’s tariff drive.
For now, the key level holding the market together is the 100-week moving average, which represents the average closing price over the that period and is often viewed as a long-term structural support. Since the local bottom on Nov. 21 at $80,000, the price has consistently held this level, which is currently near $87,145.
Bitcoin has already dropped below the 50-day moving average of just over $90,000. This indicator is commonly used to gauge short-term trend direction.
Below current levels, several notable support zones emerge. The Difficulty Regression Model, an estimate of bitcoin’s average production cost based on mining difficulty, sits near $89,300. Historically, commodities tend to gravitate toward or trade below their production cost during bear markets.
Further down, the aggregate cost basis of U.S. spot bitcoin exchange-traded fund buyers is $84,099, a level that has acted as support for several months. Onchain data shows the 2024 average exchange withdrawal price, effectively the cost basis of 2024 buyers, at $82,713.
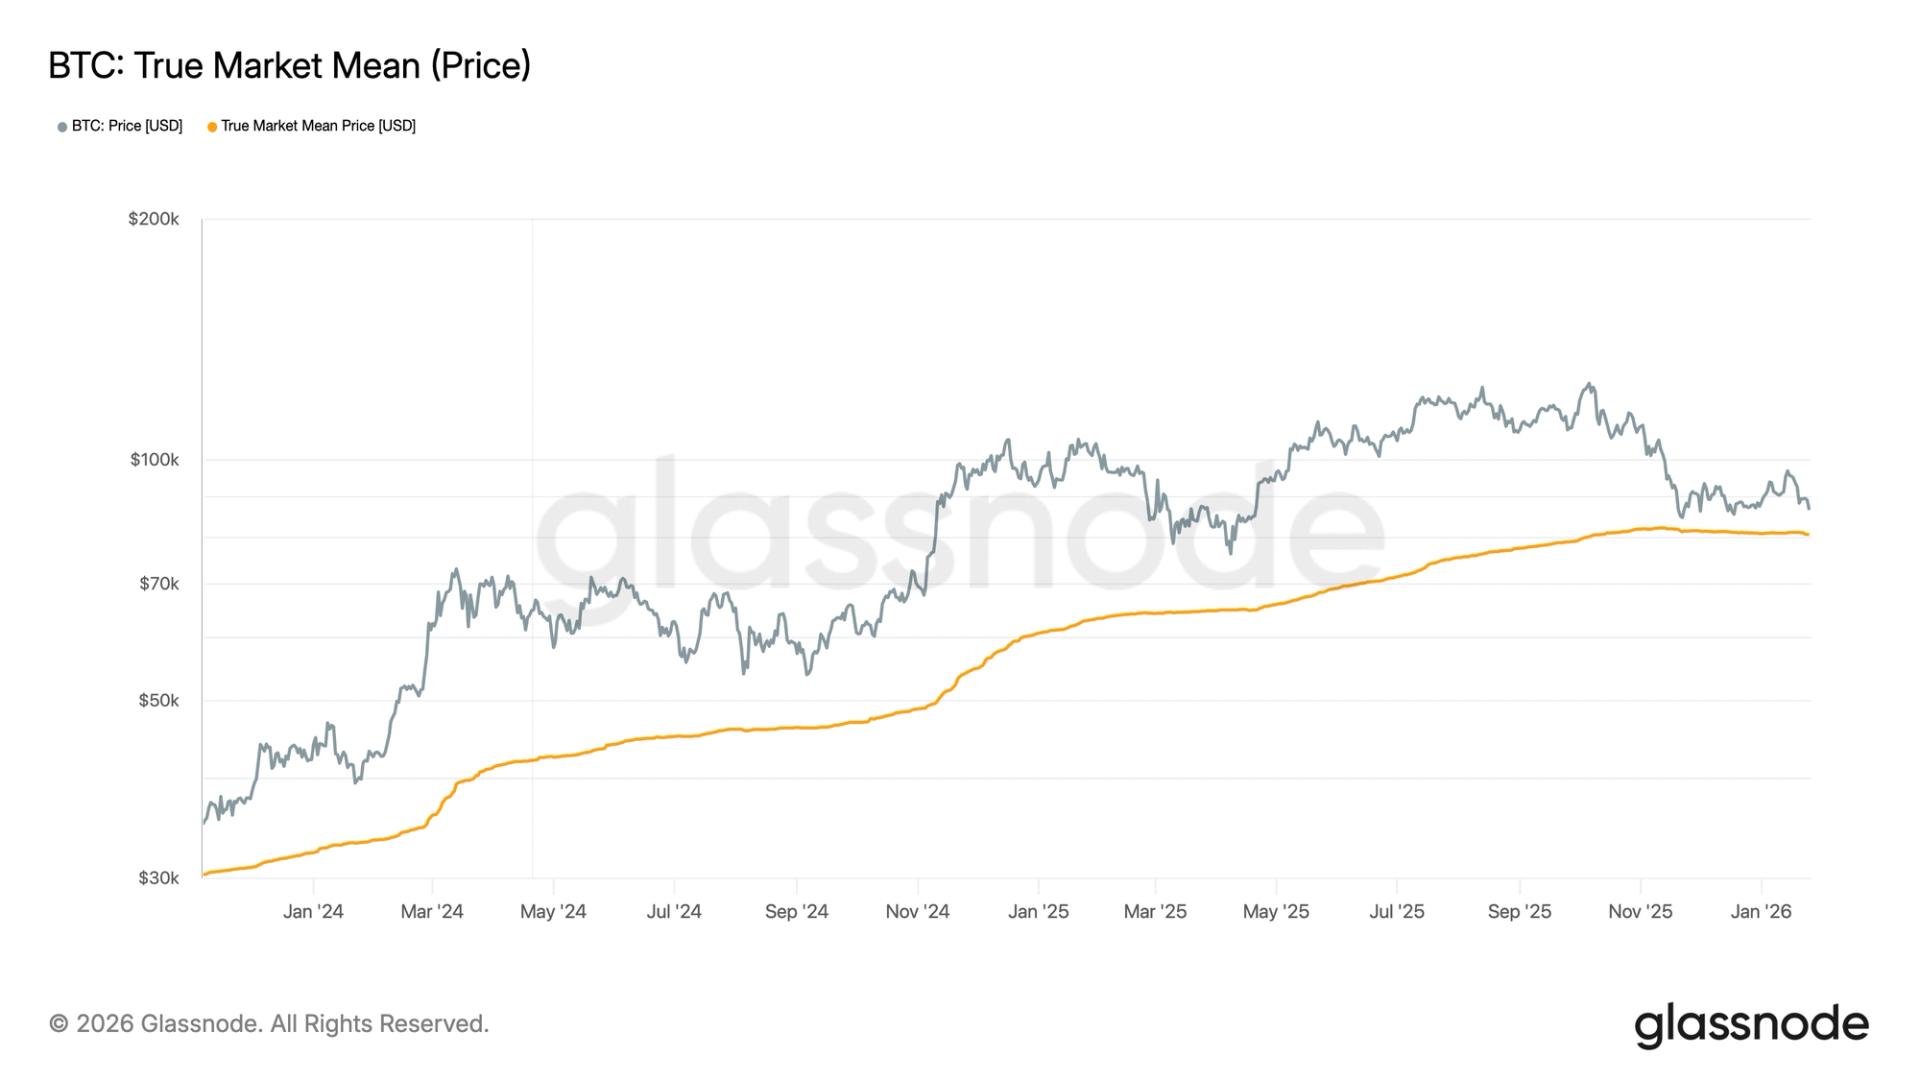
Finally, the True Market Mean Price, calculated using Investor Cap divided by Active Supply, sits just above $80,000, aligning closely with the November low and reinforcing its importance as a potential mean-reversion level.
免责声明:本文章仅代表作者个人观点,不代表本平台的立场和观点。本文章仅供信息分享,不构成对任何人的任何投资建议。用户与作者之间的任何争议,与本平台无关。如网页中刊载的文章或图片涉及侵权,请提供相关的权利证明和身份证明发送邮件到support@aicoin.com,本平台相关工作人员将会进行核查。


