Arguably one of the most important charts in finance.
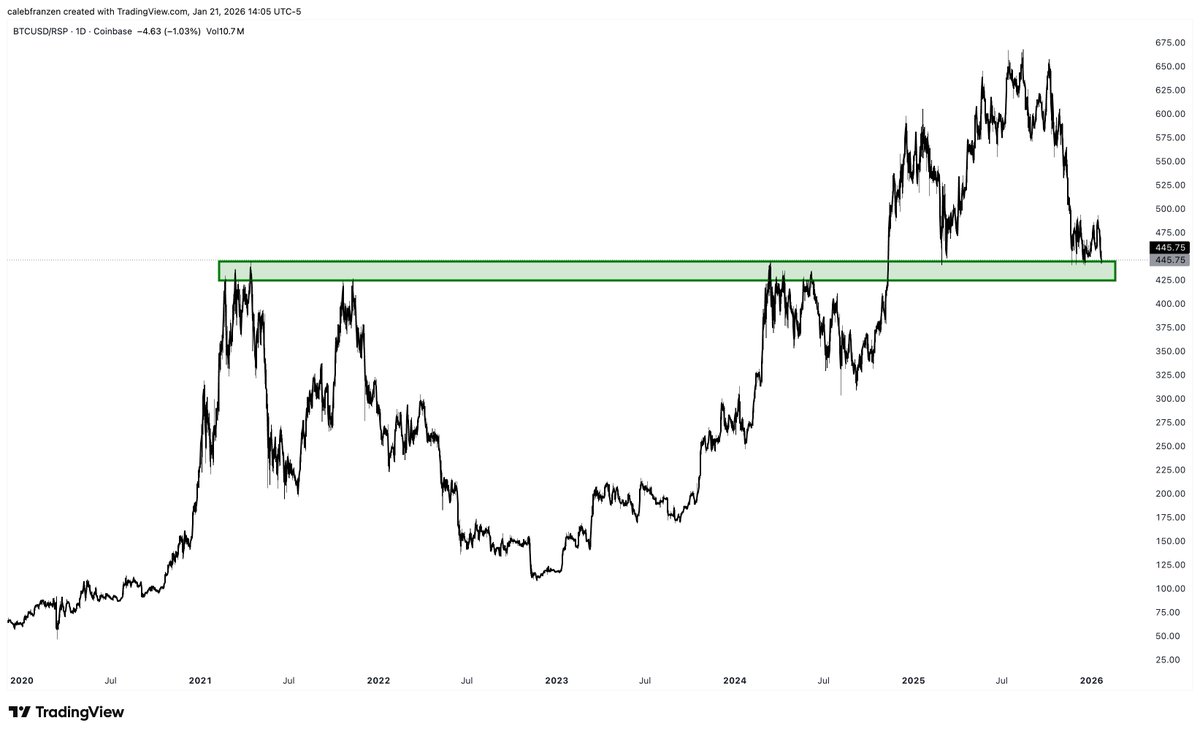
This is Bitcoin relative to the equal-weight S&P 500 (BTC/RSP).
In other words, BTC's performance vs. the avg stock.
It's currently retesting the 2021 cycle highs.
Flipped it into support in Q1'25 & made new highs.
But now, it looks extremely heavy and it's been unable to produce a meaningful low on this zone for the past few months.
In fact, it could have its lowest daily close today... which would be the lowest close since November 10, 2024.
Break this level and I think it confirms the bear market.
免责声明:本文章仅代表作者个人观点,不代表本平台的立场和观点。本文章仅供信息分享,不构成对任何人的任何投资建议。用户与作者之间的任何争议,与本平台无关。如网页中刊载的文章或图片涉及侵权,请提供相关的权利证明和身份证明发送邮件到support@aicoin.com,本平台相关工作人员将会进行核查。


