The market stabilized and rebounded after a nearly 30% correction by the end of 2025, but a new round of offensive and defensive battles has quietly begun near the 365-day moving average.
Bitcoin has risen 21% since November 21, but has not yet successfully reclaimed the critical 365-day moving average. This is strikingly similar to its performance during the 2022 bear market—when Bitcoin also rebounded after breaking below that average, only to be blocked and restart its downward trend as it approached.
The narrative of Bitcoin's "four-year halving cycle" is facing widespread skepticism from institutional researchers, as the market enters a complex game interwoven with technical indicators, on-chain data, institutional capital flows, and policy expectations.
1. Market Status and Core Controversies
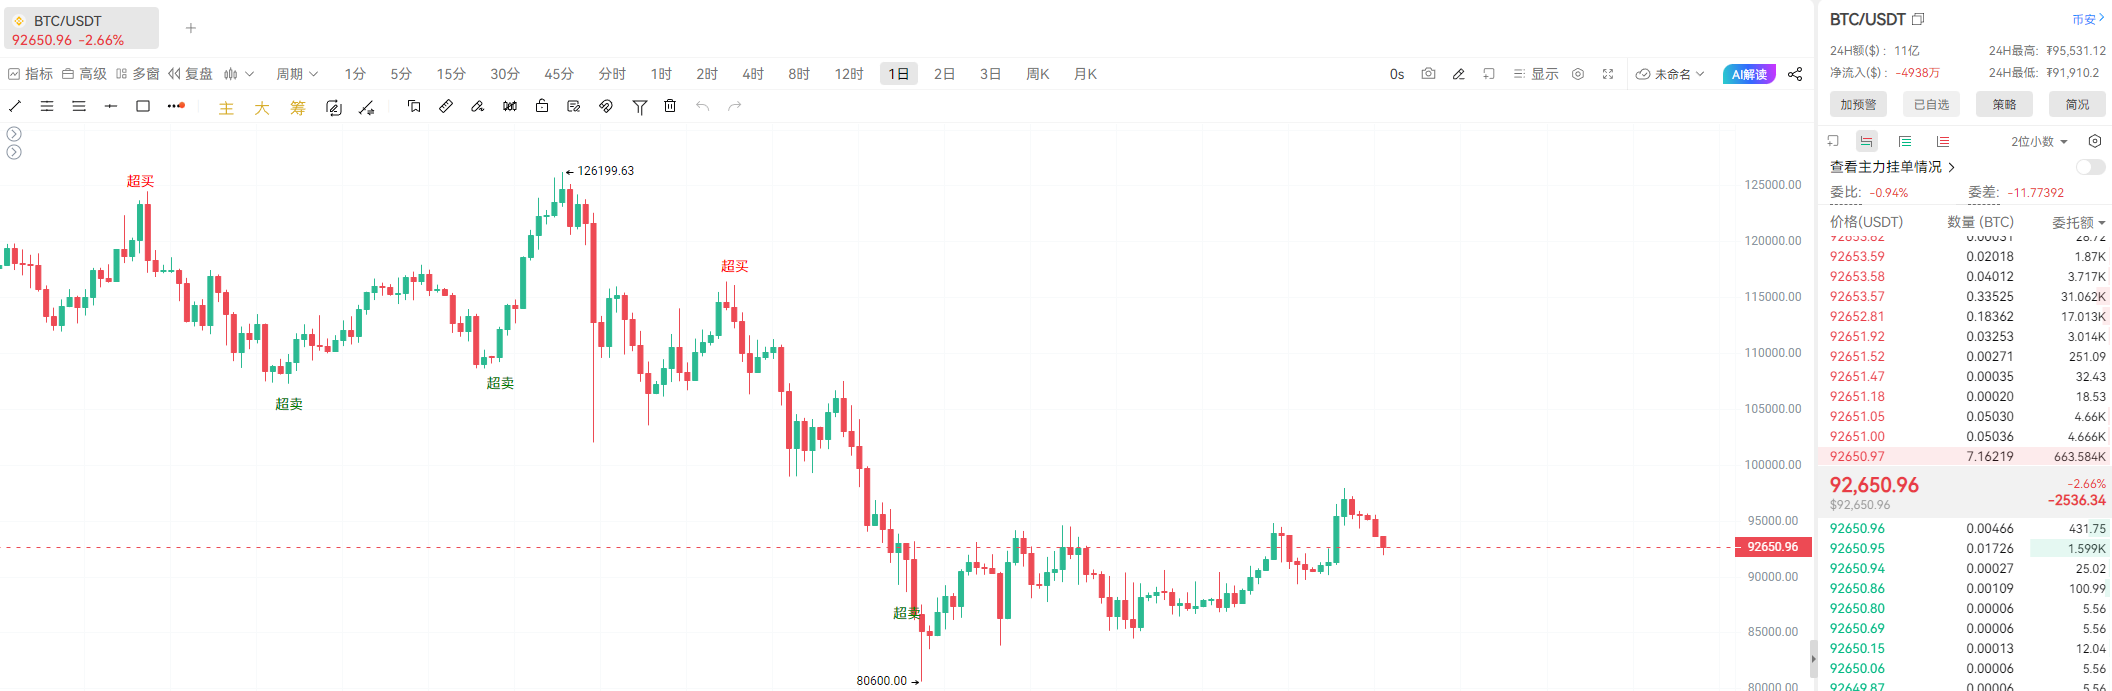
● The current trading price of Bitcoin is around $92,000, down about 26% from the October 2025 high of $126,000. The core disagreement in the market stems from different interpretations of the recent rebound: Is it a dead cat bounce in a bear market, or the starting point of a new upward trend?
● CryptoQuant analyst Julio Moreno pointed out that Bitcoin has confirmed its entry into a bear market since November. Its "Bull Market Score Index," which measures market health, turned negative in early November, tracking indicators such as network activity, investor profitability, and asset demand.
● However, a report released by Glassnode on January 9 provided a more nuanced picture: the market showed signs of structural stability in early 2026, with profit-taking pressure significantly reduced. By the end of December 2025, realized profits had sharply decreased from over $1 billion daily during the fourth quarter peak to $183.8 million daily.
● Meanwhile, subtle changes in market sentiment are corroborated in the options market. At the beginning of the new year, market activity shifted from systematic selling to actively accumulating upward volatility, with purchases of call options accounting for 30.8% of total options activity. This shift indicates that some traders are moving from defensive hedging to bullish participation.
2. Key Divergence Points: Five Areas of Struggle
● Technical Watershed. The 365-day moving average is the core of the current tug-of-war between bulls and bears. Bitcoin's price is currently approaching this long-term average. Historical experience shows that whether it can maintain a position above this average is key to distinguishing between a technical rebound and a trend reversal.
● On-chain Supply and Demand. Although profit-taking pressure has eased, the selling pressure from above remains heavy. A key observation indicator is the cost basis model for short-term holders. The current price has rebounded to near the mean of this model, around $99,100.
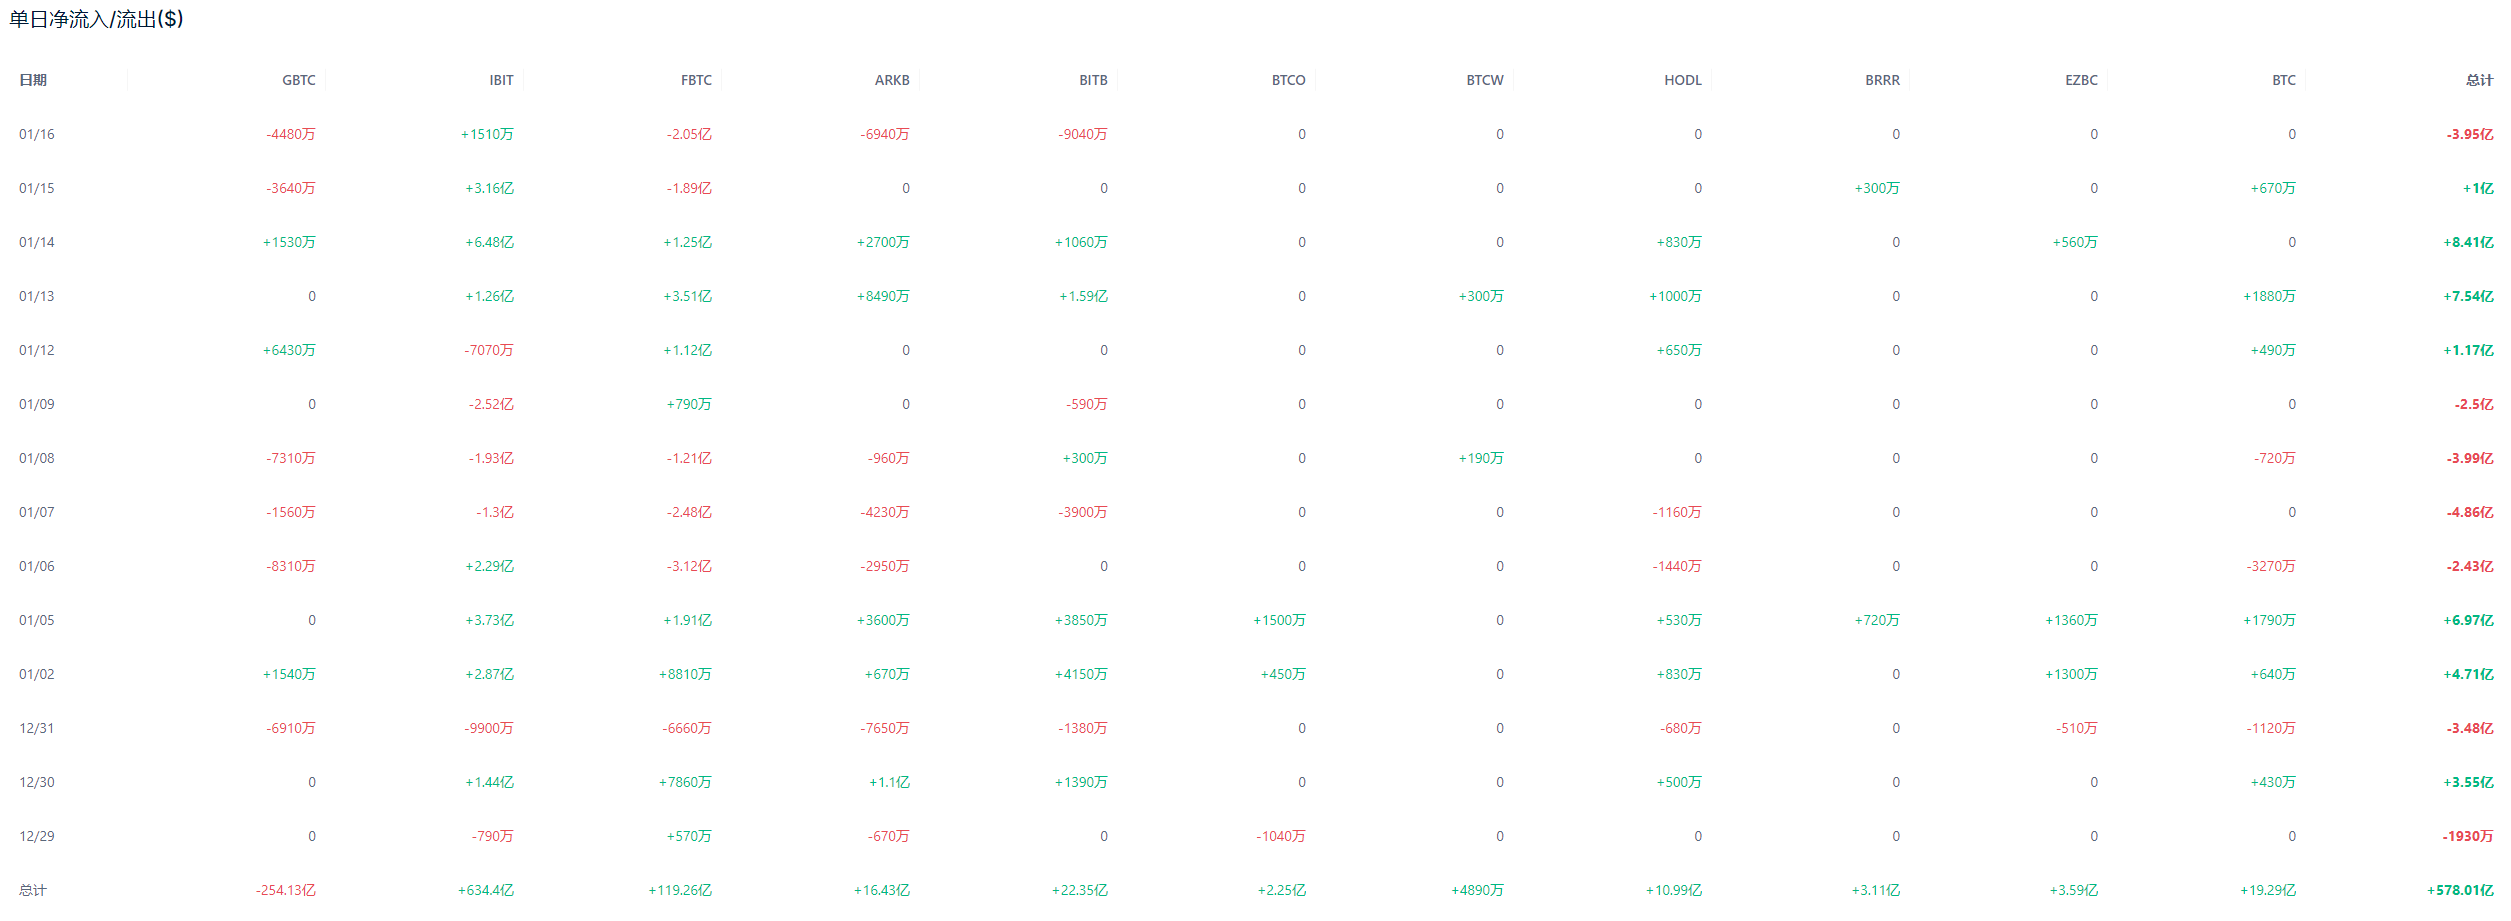
● Institutional Behavior. In November 2025, there was a net outflow of $3.4 billion from the U.S. spot Bitcoin ETF. However, this trend seems to be changing. In recent weeks, ETF capital flows have clearly shifted to net inflows, with institutional participants transitioning from net distributors to marginal accumulators.
● Cycle Theory. The traditional four-year halving cycle model is facing unprecedented challenges. Ryan Yoon, a senior analyst at Tiger Research, believes that the price drivers for Bitcoin have shifted from internal supply data to a game of policy and liquidity expectations such as "covert currency expansion."
● Regulatory Policy. In the first quarter of 2026, the U.S. is expected to pass the "Clarity Act." Broader cryptocurrency legislation is also expected to be signed at the beginning of the year, providing unprecedented regulatory certainty for the market.
3. Bearish Camp: Data Points to Continued Bear Market
● CryptoQuant's research provides systematic support for bearish views. Its analysis predicts that the bottom of the bear market may fall in the range of $56,000 to $60,000, based on Bitcoin's realized price and historical cycle patterns.
● Although this decline is significant, it is narrower compared to the 70% to 80% declines seen in previous bear markets, which may indicate market maturity.
● In terms of on-chain data, all five major indicators compiled by ChainCatcher on December 22 lit up warning signals. These indicators show that market demand growth primarily relies on leverage rather than spot buying, ETF capital inflows are slowing, and medium-sized investors holding 100 to 1,000 BTC are reducing their positions.
● If Bitcoin's price continues to be constrained below the cost basis of short-term holders, confidence-based demand may continue to decrease, significantly increasing the risk of a deeper bear market extension.
4. Bullish Camp: Structural Support and Long-term Positives
● In stark contrast to the caution of bears, K33 Research clearly holds a constructive bullish attitude for 2026 in its "2025 Annual Review" report, predicting that Bitcoin will outperform stock indices and gold.
This optimistic expectation is built on multiple structural positives.
● At the macro level, the market generally expects that if Trump is re-elected, he will appoint a dovish Federal Reserve chair to replace tightening policies with expansionary ones.
● On the regulatory front, the "Clarity Act" is expected to pass in the first quarter of 2026, and broader cryptocurrency legislation is also expected to be signed at the beginning of the year. This will clear the final barriers for large-scale institutional entry.
● The explosion of institutional participation is seen as the core driving force for 2026. Morgan Stanley plans to allow investment advisors to allocate 0-4% of Bitcoin ETFs for clients starting January 1, 2026. Retail broker E*Trade's crypto trading service is also expected to launch in the first half of 2026.
5. Potential Catalysts and Risk Outlook
● Looking ahead to 2026, the market faces a series of key catalysts and risks that could determine its direction. The biggest potential positive comes from the opening of the U.S. 401(k) retirement plans. The market will see a massive potential buying spree based on different allocation weights of 1% to 5%, injecting unprecedented long-term stable funds into Bitcoin.
● At the same time, corporate treasury allocations to Bitcoin are gradually shifting from sporadic, opportunistic behavior to structural demand. Glassnode points out that although current accumulation remains irregular and highly event-driven, the range of corporate participants has significantly expanded. The net absorption of Bitcoin by corporate treasuries across the industry is expected to reach 150,000 BTC.
● However, the downside risks are also clearly visible. In addition to the $70,000 to $56,000 downside risk range warned by CryptoQuant, the market structure itself poses limitations. A large number of positions are concentrated between $92,100 and $117,400, creating a natural resistance zone.
6. Seeking Clear Signals in the Gray Area
● The Bitcoin market in 2026 may not repeat the past cycles of sharply defined boundaries and extreme emotions. Instead, it is more likely to present a complex situation of intense fluctuations within key ranges, with bulls and bears repeatedly tugging at each other.
● The underlying logic of the market is undergoing profound changes. Binance describes a "financial repression" environment in its report. U.S. policy is shifting from traditional monetary tightening to managing financial conditions and suppressing borrowing costs through fiscal expansion and regulatory measures.
● For investors, future decisions may require more patience and precision. They should no longer simply rely on the historical experience of "there must be a big bull after the halving," but should closely monitor several clear turning signals: Can Bitcoin maintain a position above the cost basis of short-term holders and the 365-day moving average, and can ETF capital net inflows form a stable trend?
● Analyst Peter Chung's perspective may reveal the key: "While the market narrative is constantly evolving, one of the key questions determining the long-term growth of this industry is the 'CLARITY Act.' Policy will become the ultimate key to unlocking all current market mysteries.
Before policy clarification, the market is likely to continue navigating between skepticism and expectation, between technical rebounds and structural buying, with each successful breakthrough or failed retreat from key moving averages potentially serving as the starting gun for the next significant market trend.
Bitcoin has once again reached a technical juncture similar to that of 2022, but the market's fundamentals are already different. Exchange inventories are at multi-year lows, and more Bitcoin is locked in ETFs and long-term holders' wallets.
The perpetual contract funding rate has dropped to its lowest since December 2023, indicating that the fervor in the derivatives market has significantly subsided. The market structure has transitioned from a retail-driven emotional cycle to a new paradigm dominated by institutions, policy, and macro liquidity.
Join our community to discuss and grow stronger together!
Official Telegram community: https://t.me/aicoincn
AiCoin Chinese Twitter: https://x.com/AiCoinzh
OKX benefits group: https://aicoin.com/link/chat?cid=l61eM4owQ
Binance benefits group: https://aicoin.com/link/chat?cid=ynr7d1P6Z
免责声明:本文章仅代表作者个人观点,不代表本平台的立场和观点。本文章仅供信息分享,不构成对任何人的任何投资建议。用户与作者之间的任何争议,与本平台无关。如网页中刊载的文章或图片涉及侵权,请提供相关的权利证明和身份证明发送邮件到support@aicoin.com,本平台相关工作人员将会进行核查。


