Bitcoin experienced a slight pullback during the day yesterday. After breaking above the previous high of 94,700, the price rose to around 96,000, then retraced, with the lowest point just falling back to the 94,700 line, forming a structure of support and resistance exchange.
After confirming the pullback, the market surged again in the evening, rising from around 94,700 to about 97,700, creating an upward space of approximately 3,000 points.
This trend aligns with our previous viewpoint: after breaking the previous high, it is not suitable to chase the top at high levels, but rather to focus on low long opportunities after a pullback. The pullback during the day yesterday was essentially a relatively ideal low long window.
Short-term Structure Analysis
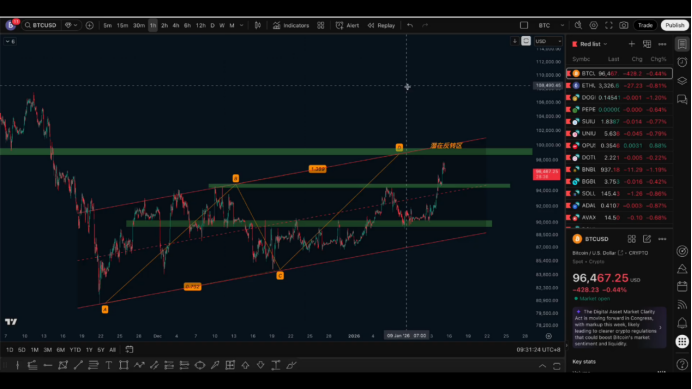
From the 4-hour level, Bitcoin is still in a market structure that is squeezing shorts and enticing longs, and this round of rebound has not yet ended.
Previously, we indicated that the potential reversal zone above is located in the 98,000–99,000 range, which is based on the D point position calculated from equidistant upward movements.
It should be noted that this is merely a deduction based on price behavior and not a deterministic judgment. However, from the current trend, there has not been a clear reversal structure during the upward process, so it is not suitable to engage in top betting prematurely.
The previous high has completed an effective breakout, and under these circumstances, the conditions for left-side top testing are not met, with the short-term trend still leaning towards continuation.
Supplement on the 100,000 Level
From a structural perspective, the medium to short-term target still mainly focuses on the 98,000–99,000 range, but it does not rule out the possibility that the price may only end this round of rebound after breaking above 100,000.
The reason is that 100,000 is a significant round number, and once an effective breakout occurs, it often leads to a noticeable liquidation effect on shorts, thereby pushing the price to accelerate in the final segment.
Differentiation of Views Across Different Timeframes
It is important to emphasize that there are differences in judgments across different timeframes.
On the short-term, the hourly and 4-hour levels still lean towards a rebound structure, primarily focusing on low longs;
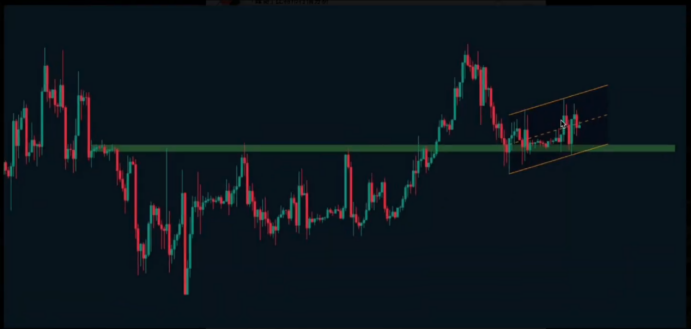
Whereas on the larger timeframes, the daily and weekly levels maintain a medium-term bearish outlook, with the core focus on whether 70,000 is effectively broken.
The current rise is more akin to a technical pullback during the downward process of the daily and weekly charts.
Review of Previous Key Judgments
On the 3rd of this month, when Bitcoin broke above the 90,000 round number, it was clearly mentioned:
After breaking 90,000, the next high is likely to reach around 99,000, while the short-term target is first looking at the previous high of 94,000.
The expected path given at that time was:
94,000 → Pullback or direct continuation → Potential development area at 98,000.
After reaching 94,000, we also provided two possibilities: either a direct rise or a pullback after testing the previous high, retracing to the lower support, and then continuing upward.
From the actual trend, the price pulled back after testing 94,700 and retraced to the support level, and after not breaking down, it surged again, with the overall operational rhythm consistent with expectations, representing a structurally healthy pullback.
Current Structure and Operational Thoughts
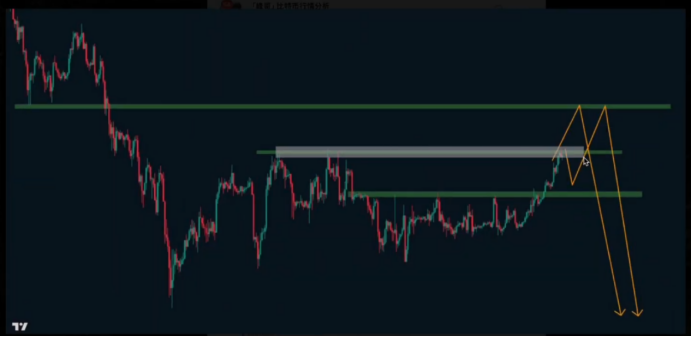
From an overall structural perspective, we are currently in a pullback confirmation phase after a "two-stage rise." As long as the lower support is not effectively broken, the short-term outlook remains bullish.
The previously mentioned channel structure is not a standard bear flag, as the lower boundary of the channel and key support have not been broken, thus the low long logic still holds.
From the hourly level, the market is still in a unilateral upward process, and a top structure has not yet appeared, but a more reasonable short-term rhythm is still to pull back first, then continue upward.
Therefore, today it is not recommended to chase longs above 96,000, but rather to wait for the price to pull back to the support level converted from previous resistance before considering long positions.
Ethereum Supplement
The structure of Ethereum is basically consistent with Bitcoin.
I personally prefer to see the price break above the previous high around 3,450, and only after this position is effectively broken will the short liquidation structure be more complete.
Summary
Overall, the short-term structure still leans bullish, but it is not suitable to chase high;
The approach remains to wait for a pullback, focus on support, and then make layouts.
The key focus above is on the 98,000–99,000 range, and before a clear reversal signal appears, there is no rush to turn to a bearish outlook.
The above content is merely personal opinion and for reference only.
Follow me, join the community, and let's progress together.

免责声明:本文章仅代表作者个人观点,不代表本平台的立场和观点。本文章仅供信息分享,不构成对任何人的任何投资建议。用户与作者之间的任何争议,与本平台无关。如网页中刊载的文章或图片涉及侵权,请提供相关的权利证明和身份证明发送邮件到support@aicoin.com,本平台相关工作人员将会进行核查。