📊 Bitcoin One-Hour Level Market Trend and Key Signal Analysis
1 Recent Trend
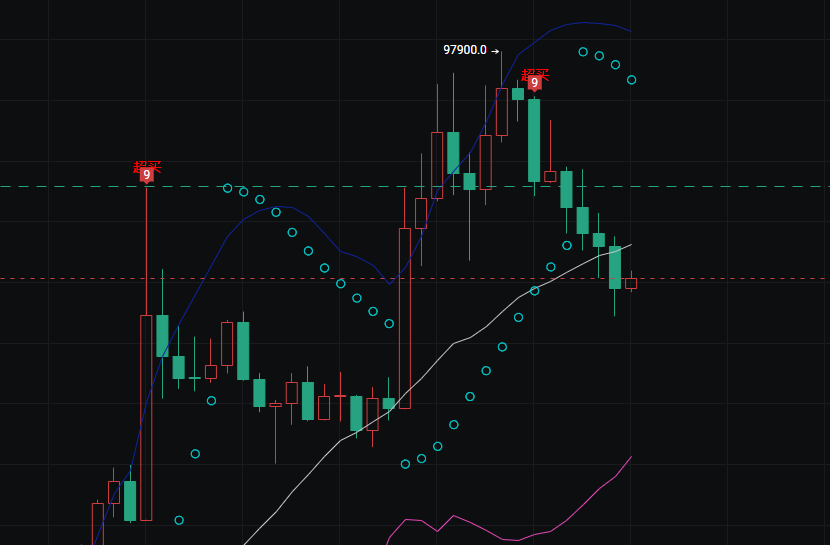
After reaching a high of 97900.0, the price quickly retraced and has now fallen below short-term support, entering a correction phase. The K-line chart shows a series of green bearish bars, indicating that bearish forces have recently dominated.
2 Moving Averages and Indicator Signals
The price has fallen below the white moving average in the chart (which typically represents the short-term trend), and the distance from the blue moving average (mid-term trend) is widening, indicating a clear short-term weakness. The purple indicator line below is still rising, but the slope has slowed down, showing that medium to long-term momentum has not completely exhausted, but there is significant short-term correction pressure. The price has broken below the previous key support level of 96164.8, and attention should be paid to the validity of the next support level at 95914.0.
3 Changes in Bullish and Bearish Forces
Previously, when the price broke through 97000, it was accompanied by a volume increase, but after encountering resistance at 97900, selling pressure significantly increased, forming a "stagnation and retreat" pattern. The current price is in the support range of 95914.0–96164.8. If this range is lost, it may further test around 95000; if it can hold the support, there is a chance for a rebound back to 96500.
🎯 Key Price Levels for Bullish and Bearish Operations:
🔴 Support Levels (Key Defensive Lines Below)
First Support: 95914.0 ◦ Hold: Consider trying a light long position, targeting a rebound to around 96500. ◦ Break: Stop loss and exit, or reverse to short, targeting 95500–95000.
Second Support: 95000 ◦ Hold: Observe for stop-loss signals (such as a doji or bullish engulfing), consider gradually building long positions. ◦ Break: Confirm short-term bearish trend, continue holding short positions, targeting 94500.
Pressure Levels (Key Resistance Above)
First Pressure: 96164.8 ◦ Break: After confirming a valid pullback, consider adding to long positions, targeting 96500–97000. ◦ Encounter Resistance: Take partial profits on long positions, or try a light short, targeting 95914.0.
Second Pressure: 97000–97900 ◦ Approaching: Reduce long positions to avoid chasing highs near previous peaks. ◦ Break: If it breaks the historical high of 97900 with volume, consider following the trend to go long, targeting 98500+.
📊 Ethereum One-Hour Level Market Trend and Key Signal Analysis
Recent Trend
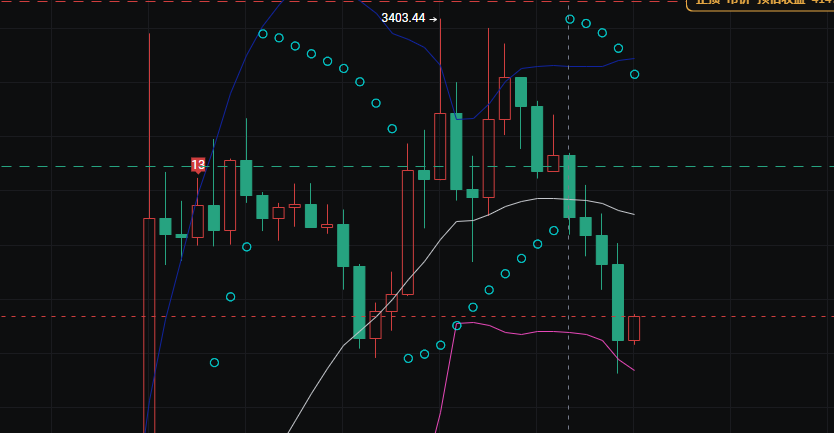
After reaching a high of 3403.44, the price quickly retraced, currently showing a long bearish candle drop, directly breaking through multiple supports, with bearish forces dominating in the short term.
Moving Averages and Indicator Signals
The price has significantly fallen below the white short-term moving average and the blue mid-term moving average, and is far from the moving averages, indicating an oversold state.
The purple indicator line below has turned downward, indicating that medium to long-term momentum is also starting to weaken, with insufficient short-term rebound power. The current price has broken below the previous key support level of 3298.41 and is testing the next support at 3284.00.
Changes in Bullish and Bearish Forces After encountering resistance near 3400, selling pressure has continued to release, especially the last long bearish candle shows strong bearish sentiment.
A technical rebound may occur after the sharp drop, but without new buying support, the rebound height will be limited, with 3298.41 and 3349.19 becoming the main resistance levels.
🎯 Key Price Levels for Bullish and Bearish Response Checklist
🔴 Support Levels (Key Defensive Lines Below)
First Support: 3284.00 Hold: Consider trying a light position to catch a rebound, targeting 3298.41. Break: Stop loss and exit, or go short with the trend, targeting 3260.00.
Second Support: 3260.00 Hold: Observe for stop-loss signals (such as a doji or bullish engulfing), consider gradually building long positions. Break: Confirm continuation of the bearish trend, continue holding short positions, targeting 3240.00.
Pressure Levels (Key Resistance Above)
First Pressure: 3298.41 Break: After confirming a valid pullback, consider adding to long positions, targeting 3349.19. Encounter Resistance: Take partial profits on long positions, or try a light short, targeting 3284.00.
Second Pressure: 3349.19–3403.44 Approaching: Reduce long positions to avoid chasing highs near previous peaks. Break: If it breaks the historical high of 3403.44 with volume, consider following the trend to go long, targeting 3420.00+.
Daily, at irregular times, internal channels share more real-time trading strategies. If you have no direction in long-term operations or have been losing for a long time, follow the public account to contact the teacher—Bitcoin Big Bear.

免责声明:本文章仅代表作者个人观点,不代表本平台的立场和观点。本文章仅供信息分享,不构成对任何人的任何投资建议。用户与作者之间的任何争议,与本平台无关。如网页中刊载的文章或图片涉及侵权,请提供相关的权利证明和身份证明发送邮件到support@aicoin.com,本平台相关工作人员将会进行核查。