Today, we will conduct a systematic review and analysis of the recent market trends and operations.
I. Review of Overall Judgment After Breaking 90,000
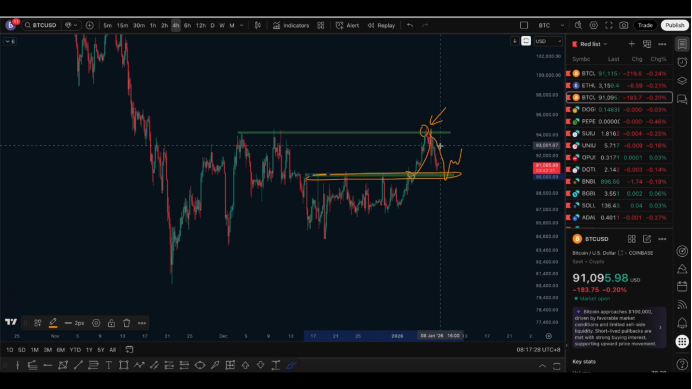
After the price broke through the 90,000 mark, we clearly mentioned at that time that once 90,000 formed an effective break, the next stage's upward target would focus on 94,000.
The 94,000 position corresponds to the breakout point of the previous high and is considered an important target for this phase.
Ultimately, the market validated this judgment, rising from 90,000 to 94,000, creating an overall upward space of about 4,000 points.
After the price reached 94,000, we also emphasized multiple times that this position was no longer suitable for chasing high positions to go long.
On the contrary, a more reasonable approach is to focus on potential pullback opportunities at high levels.
II. No Long Positions at High Levels, Focus on Pullback Opportunities
Around 94,000, our core idea was very clear:
First, no more chasing long positions at high levels;
Second, focus on opportunities for short positions during a pullback.
The overall logic is to first observe a period of decline, with the price retreating to near support levels, then watch for the possibility of forming a new bullish structure in the support area, while also paying attention to whether there is a "resistance turning into support" situation.
Therefore, in terms of short-term thinking, we have consistently leaned towards the judgment of a pullback at high levels.
IV. Has the Current Pullback Ended? Analysis of Core Divergence Points
Next, the most critical question in the market is:
Has this round of breakout against the previous high completed the entire rebound structure?
Or is this rise merely a continuation after a phase of clearing short positions, with further upward space still available?
Currently, this point still requires waiting for further confirmation signals. We cannot yet confirm that this entire adjustment has completely ended.
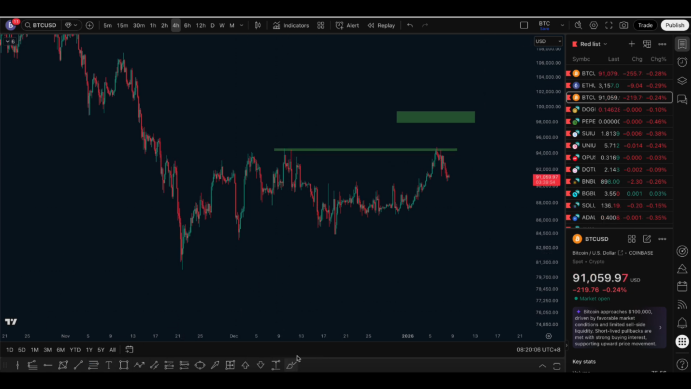
From a structural perspective, the market still has the potential for further rebound, and if it continues to rebound, its potential target range remains between the previously mentioned 98,000 and 99,000.
However, before the price rises again, the probability of completing a pullback first remains relatively high, which is a viewpoint I have repeatedly emphasized.
V. Analysis of Pullback Structure and Key Support Range
The current stage essentially belongs to the pullback phase after an upward movement.
From a structural perspective, this rise has formed a bullish arrangement and has created a bullish expansion in the range of 1.382 to 1.618.
This range is typically viewed as a selling zone for bullish expansions, and this selling zone just happens to include the previous high.
Therefore, when the price touches this expansion range and experiences pressure to retreat, it is a relatively reasonable outcome.
Next, we will focus on the depth of the pullback.
From a technical perspective, we will pay close attention to the pullback range of 0.5 to 0.618.
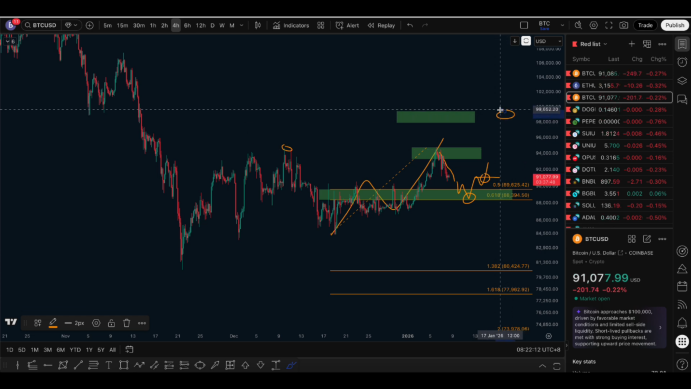
This position corresponds to the upper pressure level of the previous consolidation range, which has been tested multiple times in the past, including spikes and repeated pressure. Once a breakout occurs, this area is likely to convert into support during the pullback.
Currently, this key range is roughly between 88,400 and 89,600.
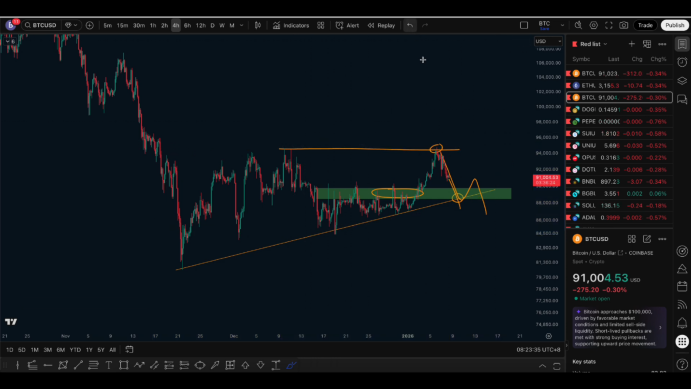
VI. Is It Suitable to Go Long Now?
Considering the current price near 91,000,
My personal suggestion is: continue to observe and not rush to establish new long positions.
The main reasons are twofold:
First, the current price has not yet retested the key support range;
Second, there is still no clear signal of a stop in the short-term structure.
Therefore, in the short term, we do not rule out the possibility of the market continuing to pull back.
VII. Ideal Long Entry Strategy
If the price subsequently pulls back to the range of 88,400 to 89,600, and within that range can:
Show a stop-loss reaction
Form a bullish structure on the hourly level
Confirm effective support
Then, it may be considered to establish new long positions, with the stop-loss set near the previous low.
Once a new bullish structure is established, the subsequent target remains the previously mentioned range of 98,000 to 99,000.
The overall idea is:
Do not bottom-fish prematurely, wait for support confirmation, and participate in the rebound after the bottom is seen, which is a relatively safer and more reasonable approach.
VIII. Another Possibility: Rebound Ends, Entering a New Downtrend
Of course, we also need to consider another scenario.
If the price breaks below the upward trend line and further breaks below the key support range of 88,400 to 89,600, and then forms a clear bearish structure, such as a decline—rebound—decline, then it can be basically confirmed that this round of rebound has ended.
Once this support range is effectively broken, the market will likely enter a new downtrend at the daily level, and the central structure will officially unfold, with the bearish trend expected to continue.
Follow me, join the community, and let's progress together.

免责声明:本文章仅代表作者个人观点,不代表本平台的立场和观点。本文章仅供信息分享,不构成对任何人的任何投资建议。用户与作者之间的任何争议,与本平台无关。如网页中刊载的文章或图片涉及侵权,请提供相关的权利证明和身份证明发送邮件到support@aicoin.com,本平台相关工作人员将会进行核查。