Unable to hold on, fundamentally it’s about not understanding, not knowing why to hold. Trading is not about staring at the position balance waiting, but about insight into market price patterns. When the price breaks, one must adjust their thinking in a timely manner; failing to keep up with the rhythm only leads to being hit and missing out.
Hello everyone, I am trader Gege. After several weeks of low-level fluctuations, the Bitcoin market finally started on the 1st, welcoming a breakthrough above 90,000. The trends this week and next week are quite critical, as they relate to whether the market can achieve a complete reversal. Let’s briefly discuss the technical aspects.
From the weekly candlestick pattern perspective, it is currently favorable for bulls, as the previous candlestick closed as a solid bullish candle, with the closing price above 90,000, and it also broke through the MA7. The consecutive daily bullish candles have opened up the BOLL pattern, putting it in an expanding state, and it has also broken through the MA60. Based on these indicators, it is favorable for bulls. However, uncertainties still exist: is it a rebound or a reversal? We still need to observe how this week’s weekly candlestick closes. If it can maintain the current pattern or advance further, the probability of a reversal will increase; conversely, if it closes as a bearish candlestick, we will continue to see large-range fluctuations.
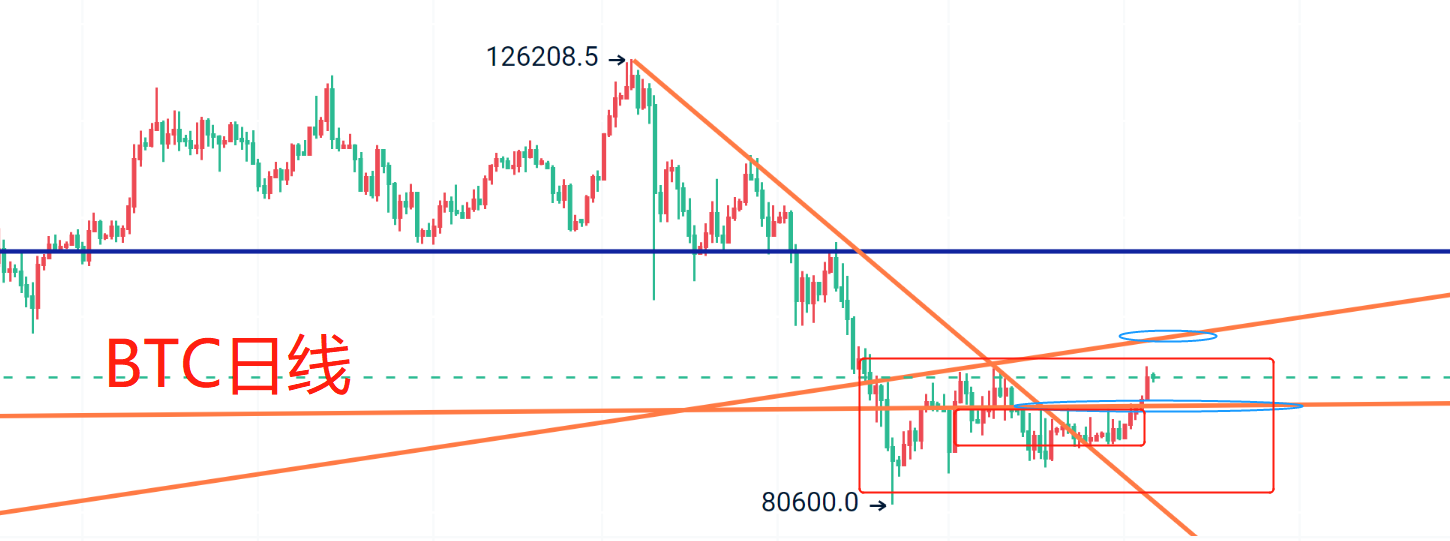
Additionally, the key boundary (the conversion of the bottom and top of the upward trend line) that Gege has been emphasizing in previous articles has been under pressure. As the market fluctuates over time, the current key boundary is slowly moving to the 97,000-98,000 range. If this key boundary can be broken, then the MA60 and the middle track of the BOLL on the weekly level will also be a hurdle that the bulls must overcome to continue. Remember, technical indicators will gradually correspond to price changes over time.
Having discussed the points to pay attention to above, let’s talk about where to focus on buying below. In the short term, there’s no need to overthink it; simply put, around the 90,000 level, based on the principle of top-bottom conversion, the current price corresponds to the weekly MA7 and the daily MA60 nearby. Therefore, as long as the support is not broken with a solid close, one can look to buy and anticipate a rebound. The overall structure is still within expectations; the large box has not been broken. Whether it is a complete reversal or a rebound followed by another retest into fluctuations still requires some time to confirm, so the overall trend is to watch and see while the short-term can refer to the above thoughts.
In summary: For Bitcoin in the short term, buy around the 92,000-91,200 range. Sell around the 97,500-98,200 range; if there is a surge breaking through, do not participate and wait for the article to update the points. That’s all for today.
The suggestions are for reference only. Ensure proper risk control when entering the market, and manage your profit and stop-loss space accordingly. Specific strategies should be based on real-time conditions; feel free to consult.
Alright, friends, we’ll say goodbye until next time. I wish everyone success in their trading endeavors and smooth sailing in the crypto world! More real-time suggestions will be sent internally. Today’s brief update ends here. For more real-time suggestions, find Gege.
Written by / I am trader Gege, a friend willing to accompany you in making a comeback.

免责声明:本文章仅代表作者个人观点,不代表本平台的立场和观点。本文章仅供信息分享,不构成对任何人的任何投资建议。用户与作者之间的任何争议,与本平台无关。如网页中刊载的文章或图片涉及侵权,请提供相关的权利证明和身份证明发送邮件到support@aicoin.com,本平台相关工作人员将会进行核查。