Qinglan Crypto Class is starting! BTC's four cycles + dual perspective on news, guiding you to step in sync with the rhythm of the crypto world.
First, let's talk about the big trend (daily & 4-hour): From the daily chart, a very clear upward oscillation channel is forming! The price has steadily risen above MA5 (approximately 89683) and MA10 (approximately 88733), marking the first appearance of a short-term moving average golden cross crossing above the mid-term moving average in the past two months. After forming a bottom divergence below the zero axis, the MACD lines are continuously diverging upwards, and the green momentum bars are still expanding, which is a positive signal for a mid-term bullish outlook. The 4-hour chart is even more evident, with the price breaking through the upper boundary of the previous month's oscillation box (approximately 90000-90500), and the moving averages are in a standard bullish arrangement (MA5 > MA10 > MA20), with the MACD strongly operating above the zero axis. This indicates that the mid-term trend has shifted from weak to strong, with an upward direction.
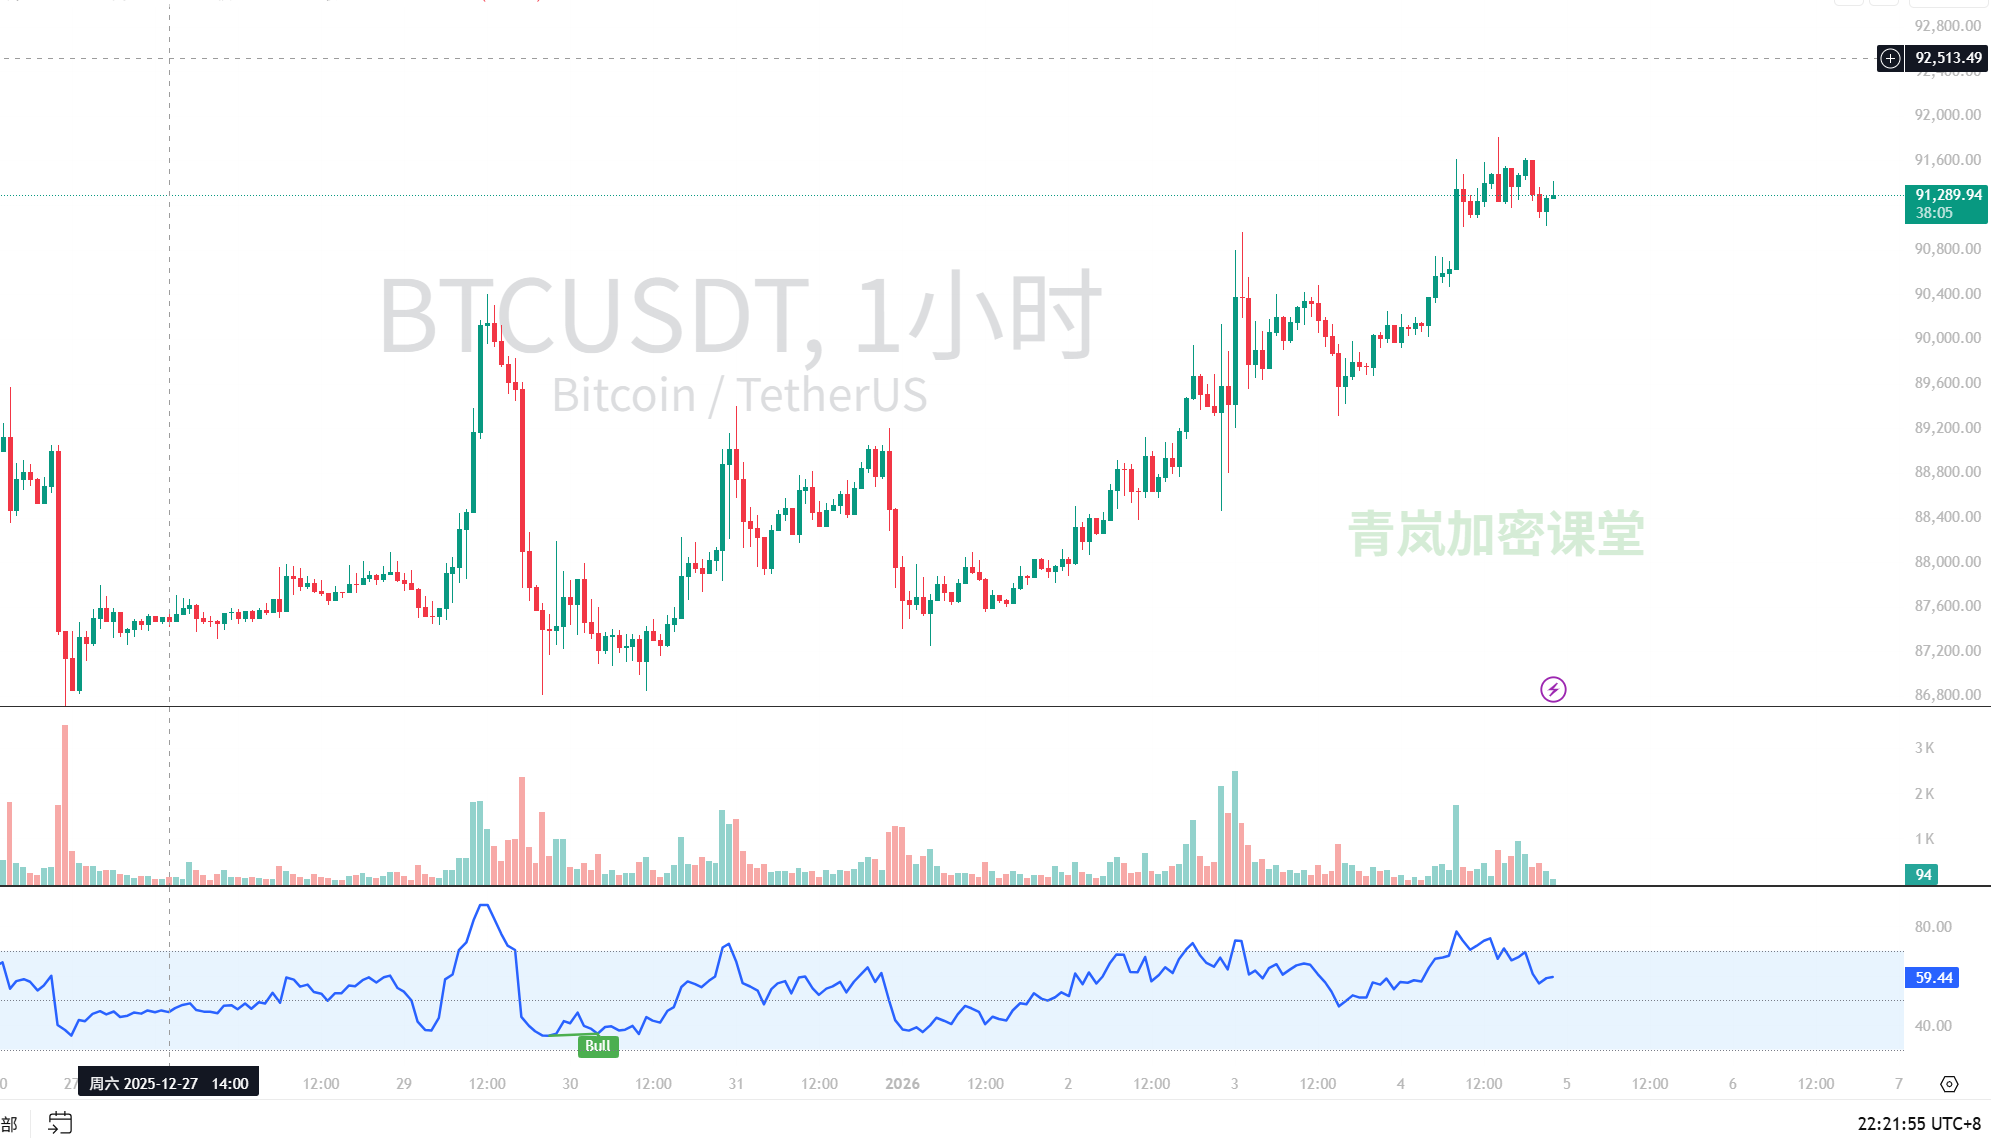
Next, looking at the short to mid-term (1 hour & 15 minutes): The 1-hour chart shows a sharp rise from around 90600 to 91810 during the day, but it was followed by a pullback, currently oscillating in the 91200-91500 range. The MACD's fast and slow lines are showing signs of flattening and convergence above the zero axis, with red momentum bars appearing, indicating that the short-term upward momentum has weakened and needs to digest profit-taking. The 15-minute chart provides more detail; after the afternoon surge, the price is building a small platform, and the MACD has returned to the vicinity of the zero axis seeking support. In the short term (from a few hours to a couple of days), it is in a high-level oscillation phase after the rise, and the direction is not particularly clear, requiring observation to determine whether this consolidation is a continuation of the upward trend or the beginning of a pullback.
Key positions to remember:
Strong support: First is the 91000-91200 area, which is the breakout platform from before, and also roughly where the MA30 on the 1-hour chart and MA5 on the 4-hour chart are located; it cannot effectively break below this. Stronger support is at 90500-90800, where multiple moving averages are concentrated, and this is the starting point of the current upward trend.
Resistance above: The recent resistance is today's high of 91800-92000. If it can break through with volume, the next target is 93000, which is a more significant pressure point on the daily chart.
News providing us with assistance and interference: Positive news is very concentrated! The most significant is that the U.S. Bitcoin spot ETF saw a net inflow of $459 million this week, with funds continuously buying, which is solid support. At the same time, data shows that new giant whales are accumulating BTC at a record pace, with holdings exceeding $120 billion, indicating that "smart money" is quietly positioning itself. Cathie Wood even declared, "The four-year cycle of Bitcoin has ended," which, although a radical viewpoint, represents mainstream institutions' long-term positive attitude towards BTC's asset attributes. All of this reinforces the mid-term bullish logic we see in the technical analysis. Of course, there are also mixed signals: for example, some whales are selling ETH to exchange for WBTC, indicating that funds are rotating within mainstream coins; high-leverage positions are accumulating in altcoins like SOL, which will increase volatility; and there are discussions about "false breakouts," reminding us to be cautious of traps at key positions. However, these are all part of the normal market dynamics and risk warnings and do not change the core narrative of macro funds flowing into BTC.
Comprehensive prediction and trading thoughts: My judgment is: the mid-term upward trend is established, and the short-term is in a high-level oscillation phase for digestion. Therefore, our operational thoughts should be clear:
For those who haven't entered yet: Do not chase the high! Be patient and wait for a pullback. The ideal entry area for long positions is in the support zone of 91000-91200. If the opportunity arises, you can gradually position yourself, with a stop loss set below 90500. If the price is strong and stabilizes around 91500 while breaking out again, you can also enter with a small position, but the stop loss should be tight.
For those who already hold positions: You can continue to hold, moving the stop loss up to below the key support of 90800 to protect profits. If the price can strongly break through 92000 and stabilize, consider moderately increasing your position, targeting 93000.
Bears should be particularly cautious: In the current environment where both the funding and technical aspects are leaning bullish, the risk of shorting against the trend is high, suitable only for short-term experts to quickly enter and exit near key resistance levels (such as 91800-92000), and always ensure to set a stop loss.
For more quantitative breakdowns of how real-time news affects market sentiment, it has been updated in my Qinglan Crypto Class, qinglan.org. Finally, Qinglan would like to share a particularly relevant trading quote for today, echoing the movements of those whales in the news: "When the trend comes, respond to it and follow it; when there is no trend, observe it and remain still. True wealth often comes from positioning quietly alongside smart money when others hesitate." See you next time!
免责声明:本文章仅代表作者个人观点,不代表本平台的立场和观点。本文章仅供信息分享,不构成对任何人的任何投资建议。用户与作者之间的任何争议,与本平台无关。如网页中刊载的文章或图片涉及侵权,请提供相关的权利证明和身份证明发送邮件到support@aicoin.com,本平台相关工作人员将会进行核查。