Analyst Chen Shu: Is Bitcoin and Ethereum's Breakout a False Signal? Pay Attention to Key Resistance Level Testing
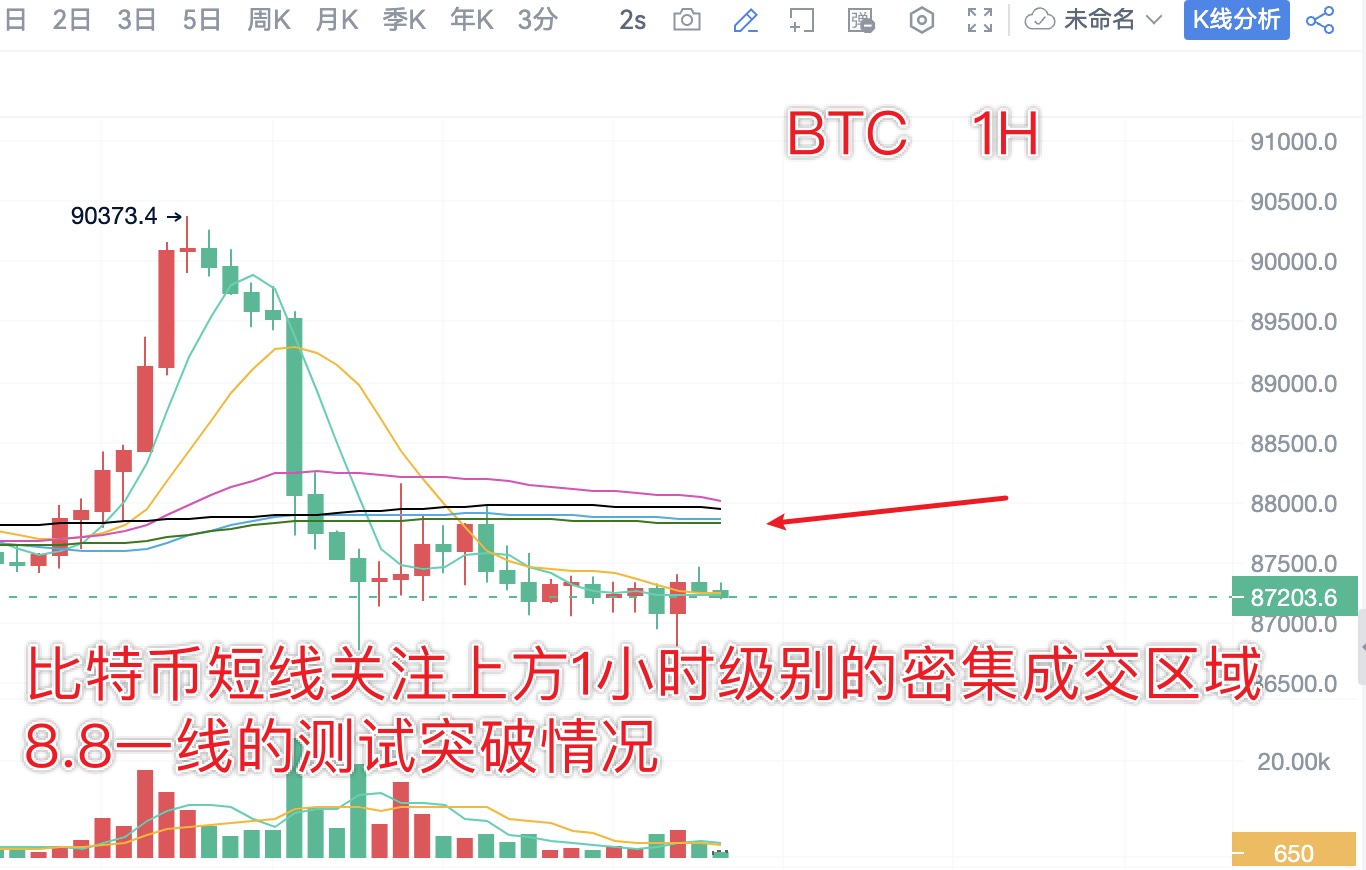
From the daily chart, Bitcoin closed with a green candlestick with an upper shadow yesterday, testing the MA30 moving average. Although there was a significant increase in volume testing the 90,000 resistance level, it quickly fell back into the previous consolidation area. The key short-term rebound resistance level to watch is the dense pressure area around 8.8 on the 1-hour chart. If the rebound touches this level, a short position can be attempted for a short-term pullback, with the support level focusing on the 8.65 area, which is the low of the consolidation.
From the daily chart, Ethereum also closed with a green candlestick resembling an inverted hammer yesterday, failing to break through the MA30 moving average resistance. The current short-term resistance level to watch is the MA256 moving average on the 1-hour and 4-hour charts, specifically in the price range of 2960-3000. The support area focuses on the previous consolidation low around 2900.
Afternoon Trading Strategy (Written at: 13:30):
BTC: Short at 8.8, add to short at 8.9 on rebound, target 8.7/8.6; below 8.65/8.55, small stop loss to attempt a short-term long.
ETH: Short at 2960, add to short at 3010 on rebound, target 2900; below 2900/2830, small stop loss for a short-term long.
The daily analysis strategy has a very high win rate! Analysis is not easy, so I hope everyone can give a free follow, save, like, and comment. Thank you all, and feel free to leave comments below; I will reply to each one.

免责声明:本文章仅代表作者个人观点,不代表本平台的立场和观点。本文章仅供信息分享,不构成对任何人的任何投资建议。用户与作者之间的任何争议,与本平台无关。如网页中刊载的文章或图片涉及侵权,请提供相关的权利证明和身份证明发送邮件到support@aicoin.com,本平台相关工作人员将会进行核查。


