Welcome to the Qinglan Crypto Classroom. Today, we will analyze BTC across four timeframes, including the news aspect:
I. Multi-Period Technical Analysis
1.1 Ultra-Short-Term Period (15-Minute Chart): Strong Surge Followed by High-Position Consolidation, Overbought Risk Highlighted
The price movement shows characteristics of severe volatility: after stabilizing around 87500 in the early morning, a violent surge occurred between 8:00-10:00 AM, with a single large bullish candle breaking above 89300, currently oscillating above the 89000 mark. On the indicator front, MA5 and MA10 formed a golden cross upward, but the price is significantly deviated from the moving averages, indicating a short-term need for regression; the MACD indicator completed a high-level golden cross above the zero line, with red bars significantly expanding, reflecting strong short-term upward momentum; the RSI indicator climbed to 79, entering a clear overbought zone. In summary, the ultra-short-term trend is characterized by strong upward movement followed by high-position consolidation, with an increased probability of short-term correction under overbought pressure.
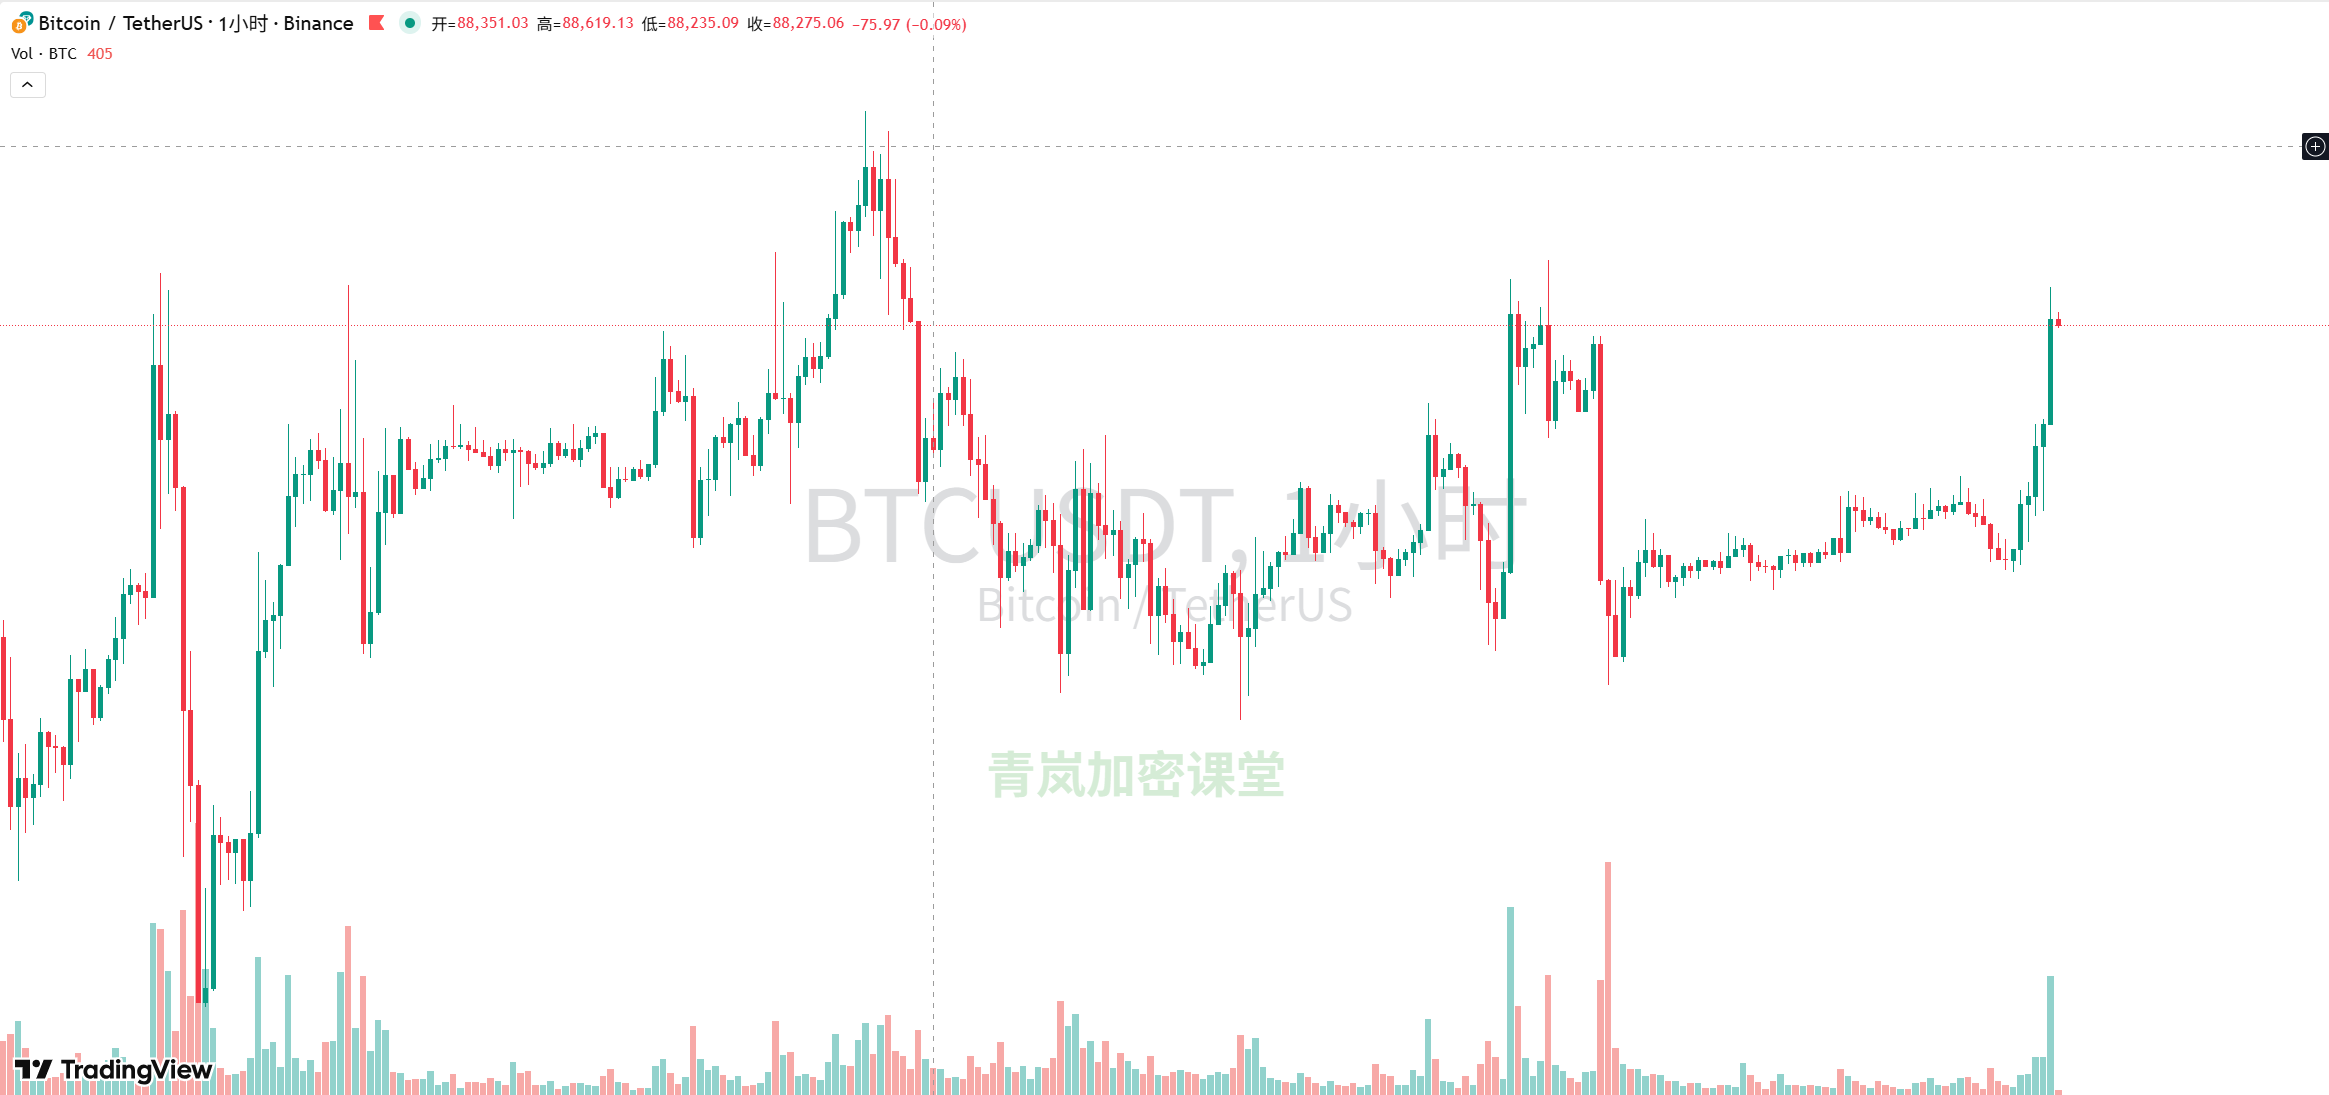
1.2 Short-Term Period (1-Hour Chart): Breakthrough of Consolidation Range, Bullish Arrangement Established
Previously, the price consolidated in the 87500-87800 range for several days, and this morning saw a volume breakout, with the current price firmly above MA5, MA10, and MA20, forming a standard bullish arrangement. On the indicator side, the MACD completed a golden cross near the zero line, with red bars expanding rapidly, providing a clear bullish signal; the RSI indicator rose to 81, also entering the overbought area. Conclusion: The short-term trend has shifted from consolidation to clear upward movement, but overbought pressure needs time to digest, making the risk of chasing high prices relatively high.
1.3 Mid-Term Period (4-Hour Chart): Breakthrough of Downward Trend Resistance, Initial Reversal Signal Emerges
Previously, the price was operating within a downward channel, with lows continuously declining until a phase low was formed around 86655 on December 26, entering a consolidation bottoming phase. The large bullish candle formed during this morning's surge successfully broke through the upper boundary of the previous consolidation range (around 88500) and the downward trend line, significantly repairing the technical pattern. The moving average system has gradually flattened and turned upward from the previous bearish arrangement; the MACD golden cross occurred below the zero line, with the fast line crossing above the zero line, and red bars continuously expanding, indicating a gradual strengthening of bullish momentum. Judgment: A key bullish reversal signal has emerged in the mid-term trend, switching from a downward trend to a consolidation upward trend.
1.4 Long-Term Period (Daily Chart): Rebound in Downward Trend, Reversal Not Confirmed
Looking at the extended period, since the high point of 110000 in November, the overall trend remains downward. Although a rebound has occurred in the past week, the price is still under pressure from key long-term moving averages like MA20, and no effective breakout has been formed. On the indicator front, although the MACD green bars have been continuously shortening, both lines remain in the deep water area below the zero line, and no golden cross has formed; the RSI indicator has risen from the oversold area to around the 50 midpoint, with limited momentum recovery. Conclusion: The long-term trend is still defined as a technical rebound within a downward trend, and a reversal has not been confirmed. Attention should be paid to the breakout situation at the 90000 mark and the long-term moving average resistance.
II. Key Support and Resistance Levels
Support Levels: Short-term core support in the 88500-88800 range (confirmation level after breaking the upper boundary of the previous consolidation); strong support in the 87500-87800 range (previous consolidation range and dense moving average area, serving as the key foundation for this rebound).
Resistance Levels: Immediate resistance at 89300 (today's intraday high); core resistance at the 90000 mark (important psychological round number + long-term moving average resistance, serving as a key verification point for mid-term trend reversal).
III. Interpretation of Bullish and Bearish Logic in News
The current market news presents a mixed characteristic, reflecting a warming market sentiment but with confidence not yet solidified:
3.1 Bullish Factors
Institutions predict that the scale of cryptocurrency ETFs will double by 2026, enhancing market expectations for the long-term development of the industry;
Whales continue to accumulate ETH, boosting sentiment in the mainstream cryptocurrency market and creating a capital linkage effect;
Coinbase CEO publicly supports Bitcoin, reinforcing market recognition of BTC's asset value.
3.2 Bearish Factors
Bloomberg analysts have released pessimistic expectations, suggesting that BTC prices could fall to 10000 USD, which exerts pressure on market sentiment;
Silver prices have surged significantly, potentially diverting some safe-haven funds and reducing the inflow of capital into the cryptocurrency market;
Overall market trading volume has shrunk, with ETF funds showing an outflow trend, reflecting that large funds are still in a wait-and-see state.
In summary: The violent surge in the early morning is essentially a result of year-end capital games, the catalysis of some positive news, and the resonance of the bottom divergence signal in the 4-hour period, representing a short-covering rebound rather than a clear signal of trend reversal.
IV. Comprehensive Judgment and Trading Strategy
4.1 Short-Term Traders (Period: 15 Minutes - 1 Hour)
Core Principle: Avoid chasing high prices in overbought conditions, wait for a stable pullback before entering. Specific Strategy: Wait for the price to fall back to the 88500-88800 support range, observe for stabilization signals in smaller timeframes (such as Pin Bar, Morning Star, Engulfing patterns, etc.); if stabilization is effective, a small position can be taken long, with target 1 at 89300 (today's high) and target 2 at 90000 (core resistance); set a stop-loss below 87500 (if strong support is broken, consider the rebound invalid). If the price directly breaks below 87500, exit immediately and observe to avoid the risk of a rebound ending.
4.2 Medium to Long-Term Investors (Period: 4 Hours - Daily)
Core Principle: Respect the long-term trend, wait for a clear reversal signal. Specific Strategy: The current daily downtrend has not changed, and this rise is temporarily defined as a rebound, so large-scale blind positions are not recommended; wait for one of the two key signals to appear before gradually positioning: ① Price effectively breaks through and stabilizes at the 90000 mark (three consecutive daily closes above this position); ② Price pulls back to 87500 and below, forming a double bottom pattern, with indicators showing resonant bullish signals.
V. Risk Warning and Trading Maxim
Qinglan Crypto Classroom Risk Warning: The cryptocurrency market is highly volatile, and a pullback after short-term overbought conditions may trigger panic selling; the long-term trend reversal has not been confirmed, and changes in policy and macroeconomic environment may alter the current market landscape. Trading requires strict position control and reasonable stop-loss settings.
Today's trading maxim from Qinglan: "Trend as the foundation, signal as the guide, patience as gold. Act in accordance with the trend, precisely intervene in signals, achieving stable profits is far more feasible than chasing short-term fluctuations."
Due to the limitations of chart space and platform compliance guidelines, more quantitative breakdowns of the impact of real-time information on market sentiment have been updated in my Qinglan Crypto Classroom. Feel free to click on my avatar to follow!
免责声明:本文章仅代表作者个人观点,不代表本平台的立场和观点。本文章仅供信息分享,不构成对任何人的任何投资建议。用户与作者之间的任何争议,与本平台无关。如网页中刊载的文章或图片涉及侵权,请提供相关的权利证明和身份证明发送邮件到support@aicoin.com,本平台相关工作人员将会进行核查。


