1. Weekly Structure: The Trend Has Clearly Turned Bearish
From the weekly level, Bitcoin has completed the transition from bullish to bearish since around 124,000 and has entered a full cycle of decline.
The confirmation signal for the trend change is the effective drop of the price below the 50-week moving average, which is at the 102,000 level. Currently, the price continues to operate below the 50-week moving average, and the weekly bearish structure is very clear.
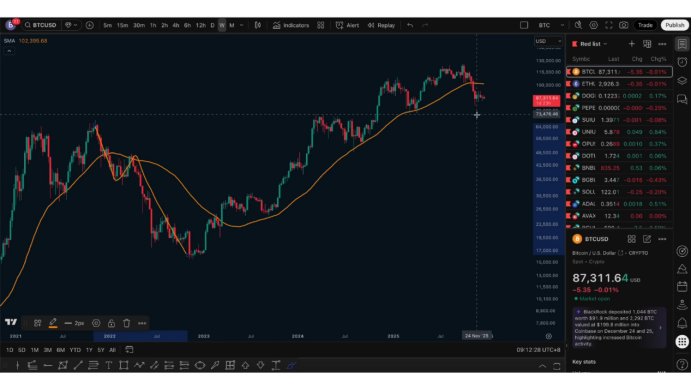
This trend is similar to the previous bear market phase: after breaking below the 50-week moving average, there was a brief stabilization, followed by a continuous decline, presenting a two-phase downward structure, with the second phase often experiencing a larger drop.
2. Mid-term Expectations: The Decline Range Remains Unchanged
Regarding the range that this round of decline may ultimately reach, our previous expectation was between 70,000 and 50,000, and we will not adjust this for now.
As long as the trend has not changed, we can only go with the flow, and the overall mindset remains bearish.
3. Two Possible Paths for the Weekly Chart
Currently, there are mainly two expectations at the weekly level:
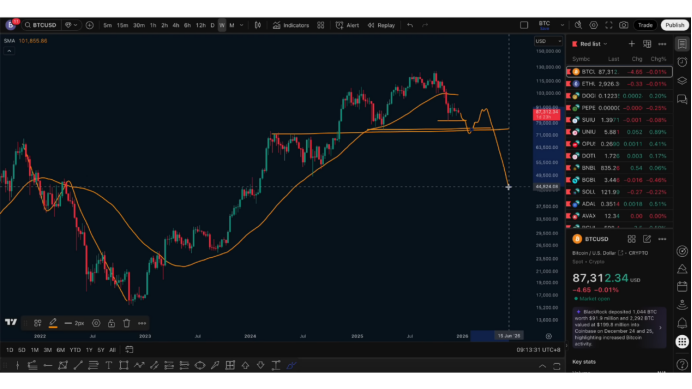
First (lower probability)
The price stops falling around 80,000, then rebounds for adjustment, with the rebound target possibly testing the 50 moving average, which means breaking above 100,000. However, this rebound is more likely to be a trap for bulls and will not change the trend; after the adjustment ends, it may continue to decline.
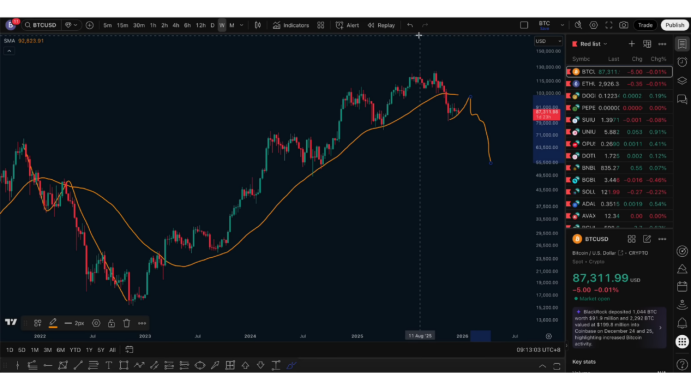
Second (higher probability)
The low of 80,000 is directly broken, followed by a simultaneous drop below 75,000. The first phase of the decline has not yet ended, and the price continues to move downward, rebounding after stabilizing in the support range below, then completing the second phase of the decline, thus completing the entire cycle.
4. Daily and 4-Hour Charts: The High Short Strategy Remains Unchanged
From the daily chart, the price closed lower yesterday, indicating that selling pressure from above still exists.
After the rebound, the focus remains on shorting, with the defense point set at 91,000, and the logic still holds.
The high point of the rebound yesterday was above 89,000, and short positions can be established in this range, providing short-term trading opportunities.
From the 4-hour level, the rebound after the previous decline has resistance concentrated in the 0.5 to 0.618 range, corresponding to prices roughly between 89,500 and 90,700.
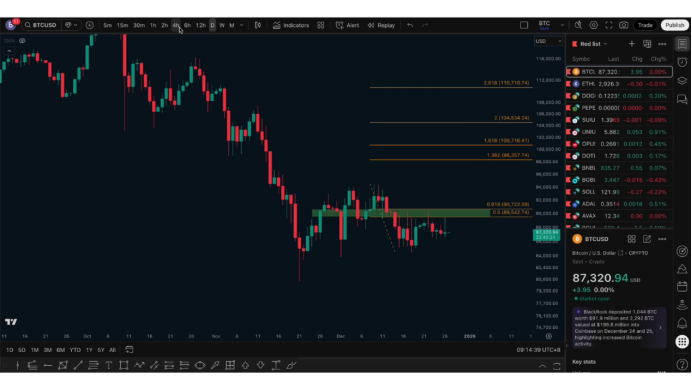
This area has been tested multiple times without breaking through, which can be seen as the current main pressure zone.
Overall, the core pressure range above is between 89,000 and 91,000, with 91,000 still serving as the defense point.
5. Trading Principles and Next Week's Focus
In the absence of bullish conditions across multiple time frame structures and before key resistance is broken, there are no conditions for going long.
Trades should only be made on confirmed structures, not on speculative movements that may occur. The analysis is only for preparation, not for execution basis.
The key focus remains on whether 80,000 is effectively broken below, which is also a key observation point for next week's market.
If there is not much change in the market from today to tomorrow, the viewpoint will remain until next Monday, with no additional updates.
Follow me, join the community, and let's progress together.

免责声明:本文章仅代表作者个人观点,不代表本平台的立场和观点。本文章仅供信息分享,不构成对任何人的任何投资建议。用户与作者之间的任何争议,与本平台无关。如网页中刊载的文章或图片涉及侵权,请提供相关的权利证明和身份证明发送邮件到support@aicoin.com,本平台相关工作人员将会进行核查。


